Women's Day


International Women's Day
The fight for women's rights has now been going on for more than a hundred years, but despite this impressive number of decades during which significant steps were made in favour of giving more social, economic and political rights to women, there are still areas where women have not achieved the status that they could and should have. Although the topic of gender equality is a social issue that deserves the attention 365 days a year, March is still a month when we all ask ourselves the question - what is the status of women in society? To mark International Women's Day, the Croatian Bureau of Statistics gave the answer to that question through a review of the most important indicators regarding population, education and labour market.
We wish a happy International Women's Day to all women, beautiful in their uniqueness.
Population

The average age of women on the rise
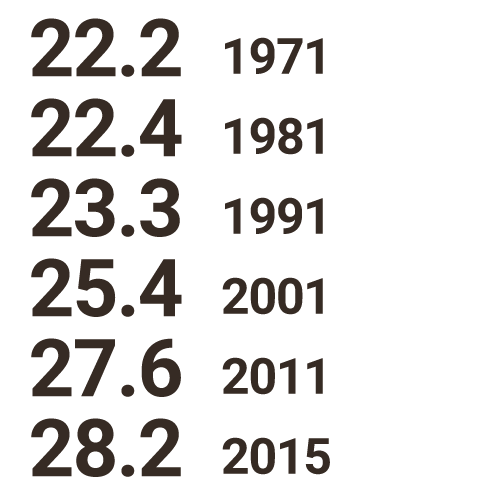
Over the past forty years, the average age of women has continuously been rising. Specifically, in 1971 the average age of women was 35.5 years, rising by almost nine years in 2015. Women aged 60 and over accounted for slightly less than a third of the total number of women (29.3%) in 2015, while in 1971 this share was close to half of that (16.9%).
Average age of women, 1971 – 2015

More boys than girls are born
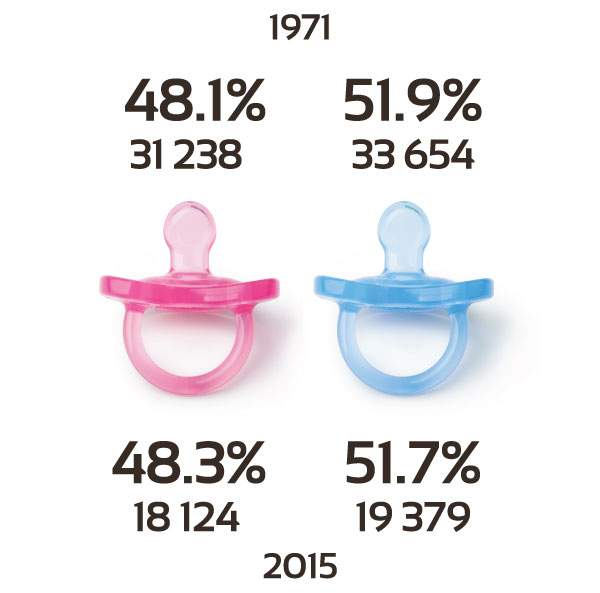
There is a slightly higher percentage of live births of male children, compared to female children. Thus, in 1971 the share of female children in the total number of live births was 48.1% and this trend continued in the following decades. Comparing to the 1970s, the number of live-born female children almost halved in 2015, which is not surprising given the fact that less and less children are being born.
Live births, 2015
The average age of the bride increased by six years
The age at which women are entering into marriage is rising. This rise can be attributed to a web of various social and economic factors. The increasing number of young women with higher education is an important factor that contributes a lot to the increase of average age at first marriage, moving it into older age groups. It is also greatly affected by greater independence of women who are becoming increasingly more involved in the labor market. Today, a growing number of young people who intend to marry live together in consensual unions, before entering marriage. All this has contributed to an increase in the average age of brides at first marriage by six years in the period from 1971 to the present day.
Average age of bride at first marriage,1971 – 2015
Women give birth in their late twenties
The aforementioned web of social and economic factors that have led to a rise in the age at which women enter into marriage is also causing an increase of the age at which women give birth to their first child. Thus, in 1971, the average age of mothers at the birth of their first child was their early twenties, and more than four decades later, it shifted to their late twenties.
Average age of mothers at first birth, 1971 – 2015
Women live longer
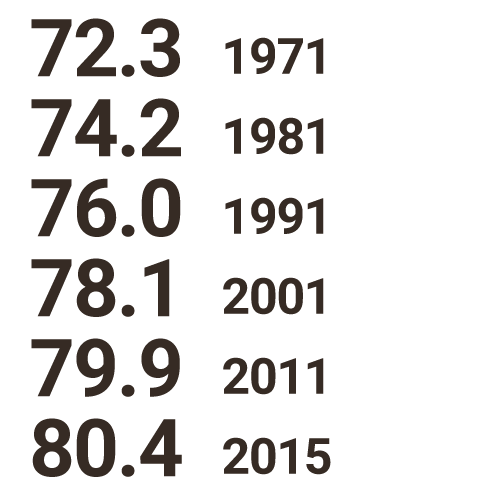
Thanks to better living conditions, life expectancy at birth over the years is increasing. Over the last forty years, average life expectancy of women at birth increased by slightly more than eight years. In addition, the share of women in the total population aged 60 and over is significantly higher, and according to population estimates at the end of 2015 amounted to 57.9%. Such sex distribution is associated with the fact that women on average live seven years longer than men.
Life expectancy of women at birth, 2015
Big changes in the ageing index
Another indicator that confirms that the number of elderly women is on the rise is the ageing index. It represents the share of the population aged 60 and over in relation to the population under the age of 20. The ageing index shows that, at the turn of the century, the boundary value of 100 was exceeded, which means that per each elderly woman, there was one young woman in the population. In fact, in the last thirty years of the 20th century, the share of women aged 60 and over was lower compared to those younger than 20 years, and since 2001 there has been an increase in the share of women aged 60 and over.
Aging index, 1971 – 2015
Education

Kindergartens
If we compare the curent number of children in kindergartens to the same figure ten years ago, we see that their share is slowly increasing. According to the latest available data, those for the beginning of 2015/2016 pedagogic year, a slightly lower share of girls was in kindergartens comparing to boys. There were nearly 64 thousand girls, amounting to 47.5% of the total number of children.

Pupils in elementary schools
At the beginning of the 2015/2016 school year, elementary schools were attended by nearly 156 thousand female pupils, which is 48.7% of the total number of pupils. Compared to the beginning of the 2005/2006 school year, the number of girls has decreased by 17.7%, in line with the overall reduction in the number of pupils in elementary schools.

Teachers in elementary schools
Compared to the beginning of the 2005/2006 school year, the number of female teachers in elementary schools at the beginning of the 2015/2016 school year increased by 14%. Compared by gender, the share of female teachers in both observed years, at around 80%, was significantly higher than the share of male teachers.

Pupils in secondary schools
From a total of just over 85 thousand female pupils in secondary schools at the beginning of the 2015/2016 school year, the share of male and female pupils was almost identical, that is, the share of female pupils stood at 50.1%. Over the past decade, the ratio of male and female pupils has not changed significantly.

Teachers in secondary schools
In secondary schools, the ratio of male and female teachers is somewhat different from what is the case in basic schools. Although women are still prevalent, the share of female teachers in secondary schools is lower than the share in basic schools, and ranged from 64.6% at the beginning of the 2005/2006 school year to 67.1% at the beginning of the 2015/2016 school year.
Female students enrolled in higher education institutions
Of the total number of students enrolled in higher education institutions in the academic year 2015/2016, female students accounted for 56.8%. More than half of these female students were in the field of Social sciences. If we compare the proportion of men and women, the largest share, 75%, was made up of female students enrolled in higher education institutions in the field of Biomedicine and health. Compared to the 2005/2006 academic year, the total number of enrolled students increased by 18.6%, while the contribution of female students to that increase was significantly higher, 71.2%.

Female students who have graduated from higher education institutions
Looking at the last ten years, the share of female students who graduated from higher education institutions in the total number of graduates has not changed significantly and remained at around 60%. Given that the largest number of female students enroll in higher education institutions in the field of Social sciences, it is not surprising that most of them also graduated in the same area.

Doctors of Science
Women are increasingly present in doctoral studies. The share of female doctors of science in 2015 amounted to 56.6%. The largest number of female doctors of science was in the field of Social sciences, Biomedicine and Health, and the Humanities, while the lowest number was recorded in the Arts. Although most female doctors of science in 2015 were between 30 and 34 years of age, their average age was 37.3 years.

Women are getting more educated
In half a century, there have been major changes in education of women. If we look at women aged 15 and over by highest educational attainment, it is evident that women are getting more educated over the decades. According to census data, in 1961, as much as 92.4% of women had primary education or less, and only 0.8% of them had higher education. On the other hand, data from the last, 2011 Census show that the majority of women, namely almost half of the total, had a secondary education. The biggest changes were recorded in higher education. The share of women with higher education was 16.7%, while the share of men with higher education was 16%. Higher education is also one of the areas in which women have not only achieved equality with men, but have already surpassed them.
Women aged 15 and over by highest completed level of educational attainment, 1961 – 2011 censuses
* Difference to 100% refers to unknown educational attainment.
Labour market

Looking at the 2015 average, 52.3% of the working-age population were women, while they accounted for almost half of the total number of persons in paid employment, 46.1%.
Working-age women (15+), 2015 average
Women in employment, 2015 average
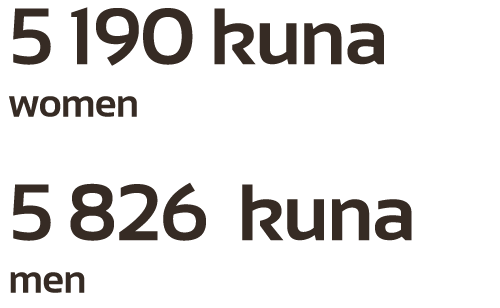
Women were best paid in Financial and insurance activities
The average monthly net earnings of women in 2014 amounted to 5 190 kuna and was by 10.9% lower than the average monthly net earnings of men. Women employed in Administrative and support service activities (3 986 kuna) and Manufacturing (4 259 kuna) had the lowest net earnings, while those employed in Financial and insurance activities (7 140 kuna) and Information and communication (7 119 kuna) activities had the highest net earnings. In two areas of activity, women had higher earnings than men, by 10.0% in Construction and by 4.0% in Administrative and support service activities.
Equal Pay Day in 2015 fell on 14 February, which indicates that, if we take the average net earnings of men and women and divide it by the number of days in a year, women reached the same pay as men 45 days later.
Average monthly net earnings, 2014
Activities in which women dominate
The highest number of women in paid employment in legal entities in 2015 was recorded in Wholesale and retail trade (17.4%) and Education (15.8%) activities, while the largest share of employed women was recorded in Human health and social work activities (78.3%) and Education (77.4%).

Good to know ;)

40.5%

by women, 2016
Information on goods
and services
90.9%


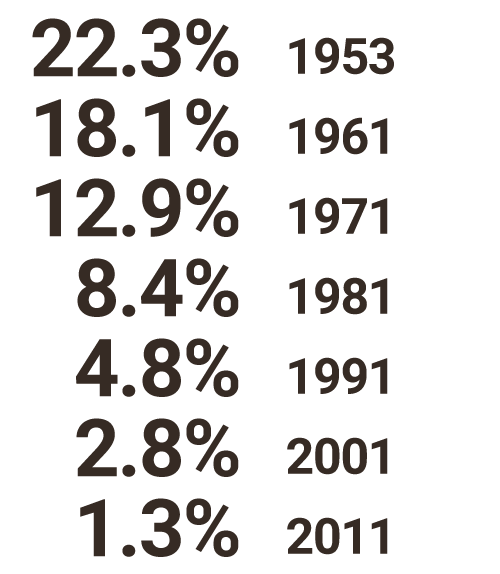
Share of illiterate women aged 10 and over, 1953 – 2011 censuses