TOURISM - CUMULATIVE DATA
Period January - December 2000
|
In the period January - December 2000, the number of
tourist arrivals in commercial accommodation facilities (excluding marinas)
in Croatia increased by 39% and there were 45% tourist nights more than in
the same period 1999. Tourists
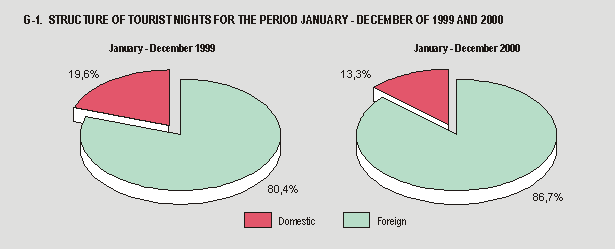
realised 38 405 930 nights: 13.3% by domestic tourists, which is 2% less than
in the period January - December 1999 and 86.7% by foreign tourists, which is
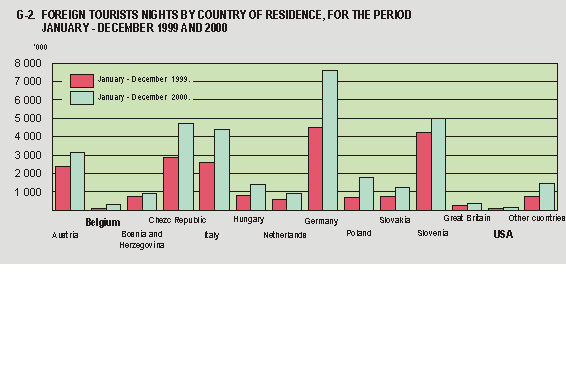
56% more than in the same period last year. Most
foreign tourist nights (90.5%) were realised by tourists from Germany
(22.8%), Slovenia (14.9%), Czech Republic (14.2%), Italy (13.1%), Austria
(9.5%), Poland (5.4%), Hungary (4.2%), Slovakia (3.7%) and Bosnia and
Herzegovina (2.7%). In
the period January - December 2000 tourist nights from Poland increased by
166%, from Hungary by 73%, from Slovakia by 72%, from Italy by 69%, from
Germany by 68%, from Czech Republic by 66%, from Austria by 33% and from
Slovenia and Bosina and Herzegovina by 17%, as compared to the same period of
1999. |
1.
TOURIST ARRIVALS AND NIGHTS
|
|
Arrivals |
Nights |
January -
December 2000 |
|||||
|
January
- December |
Indices I
- XII. 2000. |
January
- December |
Indices I
- XII. 2000. |
structure,
of nights (%) |
average
number |
|||
|
1999. |
2000. |
1999. |
2000. |
|||||
|
|
|
|
|
|
|
|
|
|
|
Total |
4 750 563 |
6 619 684 |
139 |
26 563 845 |
38 405 930 |
145 |
100,0 |
5,8 |
|
|
|
|
|
|
|
|
|
|
|
Domestic tourists |
1 307 331 |
1 282 035 |
98 |
5 214 948 |
5 098 522 |
98 |
13,3 |
4,0 |
|
|
|
|
|
|
|
|
|
|
|
Foreign tourists |
3 443 232 |
5 337 649 |
155 |
21
348 897 |
33 307 408 |
156 |
86,7 |
6,2 |
2. FOREIGN TOURISTS ARRIVALS AND NIGHTS BY COUNTRY OF
RESIDENCE
|
|
Arrivals |
Nights |
January - December 2000 |
|||||
|
January - December |
Indices I - XII. 2000 |
January - December |
Indices I
- XII. 2000 |
structure, |
average |
|||
|
1999. |
2000. |
1999. |
2000. |
|||||
|
|
|
|
|
|
|
|
|
|
|
TOTAL |
3 443 232 |
5 337 649 |
155 |
21 348 897 |
33 307 408 |
156 |
100,0 |
6,2 |
|
|
|
|
|
|
|
|
|
|
|
Austria |
374 276 |
511 896 |
137 |
2 377 516 |
3 159 151 |
133 |
9,5 |
6,2 |
|
Belgium |
16 159 |
39 296 |
243 |
109 307 |
290 158 |
265 |
0,9 |
7,4 |
|
Belarus |
1 983 |
3 956 |
199 |
13 585 |
31 786 |
234 |
0,1 |
8,0 |
|
Bosnia and Herzegovina |
157 027 |
181 693 |
116 |
763 041 |
889 876 |
117 |
2,7 |
4,9 |
|
Bulgaria |
4 669 |
5 775 |
124 |
21 830 |
19 916 |
91 |
0,1 |
3,4 |
|
Czech Republic |
415 295 |
697 521 |
168 |
2 844 657 |
4 713 186 |
166 |
14,2 |
6,8 |
|
Denmark |
11 954 |
20 542 |
172 |
67 494 |
128 596 |
191 |
0,4 |
6,3 |
|
Estonia |
264 |
514 |
195 |
1 258 |
1 823 |
145 |
0,0 |
3,5 |
|
Finland |
2 840 |
3 481 |
123 |
7 584 |
10 053 |
133 |
0,0 |
2,9 |
|
France |
31 646 |
51 828 |
164 |
87 818 |
172 498 |
196 |
0,5 |
3,3 |
|
Greece |
1 556 |
2 398 |
154 |
5 481 |
8 721 |
159 |
0,0 |
3,6 |
|
Ireland |
4 061 |
5 326 |
131 |
12 237 |
19 403 |
159 |
0,1 |
3,6 |
|
Iceland |
1 498 |
866 |
58 |
5 684 |
3 096 |
54 |
0,0 |
3,6 |
|
Italy |
538 347 |
886 461 |
165 |
2 577 648 |
4 360 507 |
169 |
13,1 |
4,9 |
|
Israel |
7 084 |
33 041 |
466 |
12 900 |
77 047 |
597 |
0,2 |
2,3 |
|
Yugoslavia |
3 481 |
5 075 |
146 |
12 058 |
19 652 |
163 |
0,1 |
3,9 |
|
Latvia |
368 |
320 |
87 |
1 912 |
912 |
48 |
0,0 |
2,8 |
|
Lithuania |
1 564 |
6 226 |
398 |
5 133 |
25 852 |
504 |
0,1 |
4,2 |
|
Luxembourg |
1 143 |
837 |
73 |
4 640 |
3 385 |
73 |
0,0 |
4,0 |
|
Hungary |
141 413 |
238 774 |
169 |
813 403 |
1 403 295 |
173 |
4,2 |
5,9 |
|
Macedonia |
8 186 |
11 785 |
144 |
29 401 |
46 186 |
157 |
0,1 |
3,9 |
|
Netherlands |
72 551 |
100 052 |
138 |
592 192 |
895 316 |
151 |
2,7 |
8,9 |
|
Norway |
6 235 |
8 855 |
142 |
22 548 |
35 878 |
159 |
0,1 |
4,1 |
|
Germany |
531 259 |
919 789 |
173 |
4
514 765 |
7 597 881 |
168 |
22,8 |
8,3 |
|
Poland |
104 893 |
274 956 |
262 |
679
487 |
1 804 933 |
266 |
5,4 |
6,6 |
|
Portugal |
1 799 |
4 199 |
233 |
5
113 |
12
032 |
235 |
0,0 |
2,9 |
|
Romania |
7 455 |
16
600 |
223 |
28 491 |
67
450 |
237 |
0,2 |
4,1 |
|
Russian Federation |
9 001 |
27
951 |
311 |
51 793 |
226 699 |
438 |
0,7 |
8,1 |
|
Slovakia |
107 629 |
183 740 |
171 |
723
090 |
1 243 795 |
172 |
3,7 |
6,8 |
|
Slovenia |
689 851 |
818 868 |
119 |
4
237 203 |
4 968 383 |
117 |
14,9 |
6,1 |
|
Spain |
10
879 |
24
493 |
225 |
26 604 |
50
796 |
191 |
0,2 |
2,1 |
|
Sweden |
13
893 |
19
826 |
143 |
65 750 |
99
588 |
151 |
0,3 |
5,0 |
|
Switzerland |
24
227 |
32
284 |
133 |
98 366 |
148 313 |
151 |
0,4 |
4,6 |
|
Turkey |
4 382 |
5 309 |
121 |
11 263 |
13
542 |
120 |
0,0 |
2,6 |
|
Ukraine |
3 425 |
5 549 |
162 |
21 455 |
37
949 |
177 |
0,1 |
6,8 |
|
Great Britain |
50
890 |
68
070 |
134 |
269
814 |
387 646 |
144 |
1,2 |
5,7 |
|
Other European countries |
6 515 |
13
605 |
209 |
25 899 |
34
756 |
134 |
0,1 |
2,6 |
|
|
|
|
|
|
|
|
|
|
|
Australia |
7 039 |
9 204 |
131 |
18 805 |
23
522 |
125 |
0,1 |
2,6 |
|
Japan |
6 375 |
10
914 |
171 |
12 360 |
20
110 |
163 |
0,1 |
1,8 |
|
Canada |
9 600 |
14
002 |
146 |
25 729 |
40
189 |
156 |
0,1 |
2,9 |
|
New Zealand |
1 367 |
2 696 |
197 |
3
279 |
6 793 |
207 |
0,0 |
2,5 |
|
USA |
36
060 |
50
340 |
140 |
97 333 |
142 147 |
146 |
0,4 |
2,8 |
|
Other non-European countries |
13
093 |
18
736 |
143 |
42 971 |
64
591 |
150 |
0,2 |
3,4 |
3. TOURIST ARRIVALS
AND NIGHTS IN PORTS OF NAUTICAL TOURISM
|
|
Arrivals |
Nights |
||||
|
January -
December |
Indices I
- XII. 2000. |
January -
December |
Indices I
- XII. 2000. |
|||
|
1999. |
2000. |
1999. |
2000. |
|||
|
|
|
|
|
|
|
|
|
Total |
376 339 |
516 870 |
137,3 |
562 319 |
776 924 |
138,2 |
|
|
|
|
|
|
|
|
|
Domestic
tourists |
14 228 |
23 339 |
164,0 |
26 207 |
39 100 |
149,2 |
|
|
|
|
|
|
|
|
|
Foreign
tourists |
362 111 |
493 531 |
136,3 |
536 112 |
737 824 |
137,6 |
NOTES
ON METHODOLOGY
Source
Data on
tourist turnover (number of tourist arrivals and tourist nights) are collected
from regular monthly report (report form TU-11). Reports are usually made on
the basis of reception records in guest books.
Methods of collection
The methodology of this survey is based on the
recommendations of Eurostat and World Tourist Organisation
(WTO).
Coverage
Reports cover all legal
persons and their parts and natural persons (including those engaged in
managing ports of nautical tourism) as well as households that rent
accommodation facilities to tourists.
Data do not include non-commercial
tourist turnover (owner’s stay and stay of their relatives and friends in
villas and summer houses). This is covered by a separate statistical survey
(report form TU-11v).
Although
since 1998 the data on tourist turnover in ports of nautical tourism have been
collected by this survey, they are presented as separate data (in table 3 of
this Release only), following the Eurostat recommendations
Definitions
Tourist is every person who, outside his place of permanent
residence, spends at least one night in a hotel or some other accommodation
facility for reasons of rest, recreation, health, study, sport, religion,
family, business, public tasks or meeting. Excluded are migrants, borderline
workers, diplomats, military force members on their regular duties, displaced
persons and nomads
Residence
is a place where a person came with an intention of permanent stay.
Tourist is registered in every place or object where he
stays and, therefore, in case of change of place or object he must register
again, which results in data ambiguity. Consequently, the statistics register
the number of tourist arrivals, and not the number of tourists.
Domestic tourist
is a person with permanent residence in the Republic of Croatia who spends at
least one night in a hotel or some other accommodation facility outside their
place or residence.
Foreign tourist is
every person with permanent residence outside of the Republic of Croatia who
temporarily resides in Croatia and who spends at least one night in a hotel or
some other accommodation facility.
Symbols
- no
occurence
Abbreviations
'000 thousand