|
GODINA/ YEAR: L. ZAGREB, 9. LISTOPADA 2013./ 9 OCTOBER, 2013 BROJ/ NUMBER: 4.2.1/7.
CODEN POPCEA ISSN 1330-0350
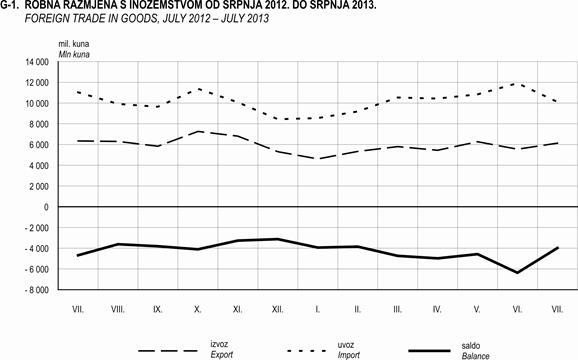
ROBNA RAZMJENA REPUBLIKE HRVATSKE S INOZEMSTVOMza razdoblje od siječnja
do srpnja 2013.1)
FOREIGN TRADE IN GOODS OF THE REPUBLIC OF CROATIAJanuary – July 20131)
|
|||||||||||||||||||||||||||||||||||||||||||||||||||||||||||||||||||||||||||||||||||||||||||||||||||||||||||||||||||||||||||||||||||||||||||||||||||||||||||||||||||||||||||||||||||||||||||||||||||||||||||||||||||||||||||||||||||||||||||||||||||||||||||||||||||||||||||||||||||||||||||||||||||||||||||||||||||||||||||||||||||||||||||||||||||||||||||||||||||||||||||||||||||||||||||||||||||||||||||||||||||||||||||||||||||||||||||||||||||||||||||||||||||||||||||||||||||||||||||||||||||||||||||||||||||||||||||||||||||||||||||||||||||||||||||||||||||||||||||||||||||||||||||||||||||||||||||||||||||||||||||||||||||||||||||||||||||||||||||||||||||||||||||||||||||||||||||||||||||||||||||||||||||||||||||||||||||||||||||||||||||||||||||||||||||||||||||||||||||||||||||||||||||||||||||||||||||||||||||||||||||||||||||||||||||||||||||||||||||||||||||||||||||||||||||||||||||||||||||||||||||||||||||||||||||||||||||||||||||||||||||||||||||||||||||||||||||||||||||||||||||||||||||||||||||||||||||||||||||||||

|
Ukupan izvoz Republike Hrvatske u razdoblju od siječnja do srpnja 2013., prema privremenim podacima, iznosio je 39,1 milijardu kuna. Istodobno je uvoz iznosio 71,6 milijardi kuna. Vanjskotrgovinski deficit iznosio je 32,4 milijarde kuna. |
|
According to the provisional data, in the period from January to July 2013, the total export of the Republic of Croatia amounted to 39.1 billion kuna. At the same time, the import was 71.6 billion kuna. The foreign trade deficit amounted to 32.4 billion kuna. |
|
|
|
|
|
Izvoz je u razdoblju od siječnja do srpnja 2013. iznosio 5,2 milijarde eura, a uvoz je iznosio 9,5 milijardi eura. Vanjskotrgovinski deficit iznosio je 4,3 milijarde eura. |
|
In the period from January to July 2013, the export amounted to 5.2 billion euros and the import to 9.5 billion euros, while the foreign trade deficit amounted to 4.3 billion euros. |
|
|
|
|
|
Izvoz je u razdoblju od siječnja do srpnja 2013. iznosio 6,8 milijardi američkih dolara, a uvoz je iznosio 12,4 milijarde američkih dolara. Vanjskotrgovinski deficit iznosio je 5,6 milijardi američkih dolara. |
|
In the period from January to July 2013, the export amounted to 6.8 billion American dollars, the import to 12.4 billion American dollars and the foreign trade deficit to 5.6 billion American dollars. |
|
|
|
|
|
Pokrivenost uvoza izvozom bila je 54,6%. |
|
The coverage of import by export was 54.6%. |
1) Privremeni podaci
2) Vidi metodološka objašnjenja.
1) Provisional data
2) See Notes on Methodology.
1. ROBNA RAZMJENA REPUBLIKE HRVATSKE S INOZEMSTVOM
FOREIGN TRADE IN GOODS OF THE REPUBLIC OF CROATIA
|
|
Izvoz Export |
Uvoz Import |
Saldo robne razmjene Balance of foreign trade in goods |
Pokrivenost
uvoza Coverage
of import by |
||||||
|
|
tis. kuna Thousand |
tis. eura Thousand |
tis. USD Thousand |
tis. kuna Thousand |
tis. eura Thousand |
tis. USD Thousand |
tis. kuna Thousand |
tis. eura Thousand |
tis. USD Thousand |
|
|
|
|
|
|
|
|
|
|
|
|
|
|
2012. |
|
|
|
|
|
|
|
|
|
|
|
I. |
5 032 728 |
666 687 |
859 860 |
8 618 015 |
1 141 439 |
1 472 618 |
-3 585 287 |
- 474 752 |
- 612 758 |
58,4 |
|
II. |
5 167 700 |
681 743 |
901 426 |
9 647 770 |
1 272 629 |
1 681 958 |
-4 480 070 |
- 590 886 |
- 780 532 |
53,6 |
|
III. |
6 830 402 |
905 989 |
1 196 668 |
11 814 936 |
1 566 673 |
2 066 627 |
-4 984 534 |
- 660 684 |
- 869 959 |
57,8 |
|
IV. |
5 399 487 |
720 365 |
948 407 |
10 110 390 |
1 348 989 |
1 775 642 |
-4 710 903 |
- 628 624 |
- 827 235 |
53,4 |
|
V. |
6 149 337 |
816 623 |
1 046 997 |
10 975 442 |
1 457 608 |
1 870 707 |
-4 826 105 |
- 640 985 |
- 823 710 |
56,0 |
|
VI. |
5 947 961 |
788 245 |
987 899 |
10 254 249 |
1 358 540 |
1 701 377 |
-4 306 288 |
- 570 295 |
- 713 478 |
58,0 |
|
VII. |
6 346 109 |
846 792 |
1 041 739 |
11 031 191 |
1 471 723 |
1 810 485 |
-4 685 082 |
- 624 931 |
- 768 746 |
57,5 |
|
VIII. |
6 295 656 |
840 671 |
1 040 956 |
9 914 859 |
1 324 030 |
1 638 338 |
-3 619 203 |
- 483 359 |
- 597 382 |
63,5 |
|
IX. |
5 829 969 |
785 007 |
1 008 136 |
9 641 122 |
1 298 254 |
1 668 277 |
-3 811 153 |
- 513 247 |
- 660 141 |
60,5 |
|
X. |
7 264 244 |
968 069 |
1 254 894 |
11 376 565 |
1 516 983 |
1 966 877 |
-4 112 321 |
- 548 914 |
- 711 983 |
63,8 |
|
XI. |
6 808 694 |
903 338 |
1 158 929 |
10 076 280 |
1 336 962 |
1 713 371 |
-3 267 586 |
- 433 624 |
- 554 442 |
67,6 |
|
XII. |
5 308 437 |
705 122 |
923 072 |
8 438 545 |
1 120 566 |
1 467 986 |
-3 130 108 |
- 415 444 |
- 544 914 |
62,9 |
|
I. – XII. |
72 380 725 |
9 628 650 |
12 368 983 |
121 899 363 |
16 214 395 |
20 834 262 |
-49 518 638 |
-6 585 745 |
-8 465 279 |
59,4 |
|
2013. |
|
|
|
|
|
|
|
|
|
|
|
I. |
4 606 619 |
608 556 |
807 945 |
8 549 938 |
1 129 505 |
1 498 685 |
-3 943 320 |
- 520 948 |
- 690 741 |
53,9 |
|
II. |
5 334 228 |
703 431 |
941 878 |
9 189 218 |
1 211 791 |
1 623 120 |
-3 854 990 |
- 508 360 |
- 681 241 |
58,0 |
|
III. |
5 793 466 |
763 733 |
990 524 |
10 535 323 |
1 388 844 |
1 801 956 |
-4 741 858 |
- 625 110 |
- 811 432 |
55,0 |
|
IV. |
5 445 310 |
716 245 |
931 672 |
10 428 570 |
1 371 679 |
1 785 036 |
-4 983 261 |
- 655 434 |
- 853 364 |
52,2 |
|
V. |
6 267 501 |
828 282 |
1 074 535 |
10 839 467 |
1 432 576 |
1 857 915 |
-4 571 967 |
- 604 295 |
- 783 380 |
57,8 |
|
VI. |
5 545 897 |
739 872 |
975 502 |
11 912 711 |
1 589 437 |
2 096 445 |
-6 366 813 |
- 849 564 |
-1 120 943 |
46,5 |
|
VII. |
6 129 936 |
811 031 |
1 082 984 |
10 112 989 |
1 344 522 |
1 779 709 |
-3 983 053 |
- 533 491 |
- 696 725 |
60,3 |
|
I. – VII. |
39 122 956 |
5 171 151 |
6 805 040 |
71 568 217 |
9 468 354 |
12 442 866 |
-32 445 261 |
-4 297 203 |
-5 637 826 |
54,6 |
I. ROBNA RAZMJENA REPUBLIKE HRVATSKE S INOZEMSTVOM U KUNAMA
FOREIGN TRADE IN GOODS OF THE REPUBLIC OF CROATIA, KUNA
1. IZVOZ I UVOZ PREMA MEĐUNARODNOJ KLASIFIKACIJI EKONOMSKE NAMJENE PROIZVODA (BEC)
EXPORT AND IMPORT, ACCORDING TO CLASSIFICATION BY BROAD ECONOMIC CATEGORIES (BEC)
tis. kuna
Thousand kuna
|
|
|
Izvoz Export |
Uvoz Import |
|
|
||||
|
|
|
I.–VII. 2012. |
I.–VII. 2013. |
indeksi |
I.–VII. 2012. |
I.–VII. 2013. |
indeksi |
|
|
|
|
|
|
|
|
|
|
|
|
|
|
|
Ukupno |
40 873 724 |
39 122 956 |
95,7 |
72 451 991 |
71 568 217 |
98,8 |
|
Total |
|
|
|
|
|
|
|
|
|
|
|
|
1 |
Hrana i pića |
4 213 842 |
3 935 109 |
93,4 |
6 729 756 |
7 158 101 |
106,4 |
1 |
Food and beverages |
|
|
|
|
|
|
|
|
|
|
|
|
2 |
Industrijski materijali, d. n. |
18 013 448 |
17 285 212 |
96,0 |
32 035 439 |
31 117 674 |
97,1 |
2 |
Industrial supplies n. e. s. |
|
|
|
|
|
|
|
|
|
|
|
|
3 |
Goriva i maziva |
1 293 901 |
1 665 775 |
128,7 |
5 302 566 |
4 768 696 |
89,9 |
3 |
Fuels and lubricants |
|
|
|
|
|
|
|
|
|
|
|
|
4 |
Kapitalni proizvodi (osim prijevoznih sredstava), njihovi dijelovi i pribor |
6 652 714 |
6 803 337 |
102,3 |
10 580 157 |
11 942 186 |
112,9 |
4 |
Capital goods (except transport equipment), and parts and accessories thereof |
|
|
|
|
|
|
|
|
|
|
|
|
5 |
Prijevozna sredstva, njihovi dijelovi i pribor |
3 891 554 |
2 210 651 |
56,8 |
6 018 648 |
5 260 659 |
87,4 |
5 |
Transport equipment and parts and accessories thereof |
|
|
|
|
|
|
|
|
|
|
|
|
6 |
Proizvodi za široku potrošnju, d. n. |
6 523 920 |
6 572 341 |
100,7 |
11 565 334 |
11 182 414 |
96,7 |
6 |
Consumer goods n. e. s. |
|
|
|
|
|
|
|
|
|
|
|
|
7 |
Proizvodi, d. n. |
284 346 |
650 530 |
228,8 |
220 091 |
138 488 |
62,9 |
7 |
Goods n. e. s. |
2. IZVOZ I UVOZ PREMA NKD-u 2007.
EXPORT AND IMPORT, ACCORDING TO NKD 2007.
tis. kuna
Thousand kuna
|
|
|
|
Izvoz Export |
Uvoz Import |
|
|
|
||||
|
|
|
|
I.–VII. 2012. |
I.–VII. 2013. |
indeksi |
I.–VII. 2012. |
I.–VII. 2013. |
indeksi |
|
|
|
|
|
|
|
|
|
|
|
|
|
|
|
|
|
|
|
Ukupno |
40 873 724 |
39 122 956 |
95,7 |
72 451 991 |
71 568 217 |
98,8 |
|
|
Total |
|
|
|
|
|
|
|
|
|
|
|
|
|
|
A |
|
Poljoprivreda, šumarstvo i ribarstvo |
1 621 048 |
1 480 869 |
91,4 |
2 007 892 |
2 063 778 |
102,8 |
A |
|
Agriculture, forestry and fishing |
|
|
|
|
|
|
|
|
|
|
|
|
|
|
B |
|
Rudarstvo i vađenje |
475 013 |
491 169 |
103,4 |
9 220 429 |
9 911 248 |
107,5 |
B |
|
Mining and quarrying |
|
|
|
|
|
|
|
|
|
|
|
|
|
|
C |
|
Prerađivačka industrija |
36 721 222 |
34 992 423 |
95,3 |
58 496 399 |
57 637 986 |
98,5 |
C |
|
Manufacturing |
|
|
10 |
Proizvodnja prehrambenih proizvoda |
2 917 517 |
2 730 638 |
93,6 |
5 774 610 |
6 122 873 |
106,0 |
|
10 |
Manufacture of food products |
|
|
11 |
Proizvodnja pića |
550 241 |
510 631 |
92,8 |
448 699 |
504 896 |
112,5 |
|
11 |
Manufacture of beverages |
|
|
12 |
Proizvodnja duhanskih proizvoda |
216 506 |
255 915 |
118,2 |
226 096 |
193 328 |
85,5 |
|
12 |
Manufacture of tobacco products |
|
|
13 |
Proizvodnja tekstila |
376 645 |
404 160 |
107,3 |
1 440 814 |
1 418 668 |
98,5 |
|
13 |
Manufacture of textiles |
|
|
14 |
Proizvodnja odjeće |
1 842 666 |
1 569 556 |
85,2 |
1 997 122 |
1 812 485 |
90,8 |
|
14 |
Manufacture of wearing apparel |
|
|
15 |
Proizvodnja kože i srodnih proizvoda |
1 177 348 |
1 191 272 |
101,2 |
1 101 290 |
1 525 053 |
138,5 |
|
15 |
Manufacture of leather and related products |
|
|
16 |
Prerada drva i proizvoda od drva i pluta, osim namještaja; proizvodnja proizvoda od slame i pletarskih materijala |
1 664 697 |
1 701 153 |
102,2 |
789 751 |
760 751 |
96,3 |
|
16 |
Manufacture of wood and of products of wood and cork, except furniture; manufacture of articles of straw and plaiting materials |
|
|
17 |
Proizvodnja papira i proizvoda od papira |
698 605 |
614 574 |
88,0 |
1 771 761 |
1 825 520 |
103,0 |
|
17 |
Manufacture of paper and paper products |
|
|
18 |
Tiskanje i umnožavanje snimljenih zapisa |
5 777 |
4 855 |
84,0 |
15 821 |
13 874 |
87,7 |
|
18 |
Printing and reproduction of recorded media |
|
|
19 |
Proizvodnja
koksa i rafiniranih |
4 778 481 |
4 575 682 |
95,8 |
5 159 929 |
3 451 079 |
66,9 |
|
19 |
Manufacture of coke and refined petroleum products |
|
|
20 |
Proizvodnja kemikalija i kemijskih proizvoda |
2 351 292 |
2 269 075 |
96,5 |
6 096 379 |
6 198 533 |
101,7 |
|
20 |
Manufacture of chemicals and chemical products |
|
|
21 |
Proizvodnja osnovnih farmaceutskih proizvoda i farmaceutskih pripravaka |
1 764 715 |
1 972 065 |
111,7 |
2 997 384 |
3 069 663 |
102,4 |
|
21 |
Manufacture of basic pharmaceutical products and pharmaceutical preparations |
|
|
22 |
Proizvodnja proizvoda od gume i plastike |
740 947 |
818 285 |
110,4 |
2 728 107 |
2 695 766 |
98,8 |
|
22 |
Manufacture of rubber and plastic products |
|
|
23 |
Proizvodnja ostalih nemetalnih mineralnih proizvoda |
1 462 579 |
1 596 230 |
109,1 |
1 291 907 |
1 207 322 |
93,5 |
|
23 |
Manufacture of other non-metallic mineral products |
|
|
24 |
Proizvodnja metala |
1 835 084 |
1 612 500 |
87,9 |
4 279 386 |
4 167 984 |
97,4 |
|
24 |
Manufacture of basic metals |
|
|
25 |
Proizvodnja gotovih metalnih proizvoda, osim strojeva i opreme |
2 188 828 |
2 645 465 |
120,9 |
2 319 869 |
2 279 943 |
98,3 |
|
25 |
Manufacture of fabricated metal products, except machinery and equipment |
|
|
26 |
Proizvodnja računala te elektroničkih i optičkih proizvoda |
1 109 008 |
849 416 |
76,6 |
3 814 963 |
4 739 767 |
124,2 |
|
26 |
Manufacture of computer, electronic and optical products |
|
|
27 |
Proizvodnja električne opreme |
3 030 671 |
2 834 436 |
93,5 |
2 870 635 |
2 860 409 |
99,6 |
|
27 |
Manufacture of electrical equipment |
|
|
28 |
Proizvodnja strojeva i uređaja, d. n. |
3 140 081 |
3 173 266 |
101,1 |
5 662 708 |
6 117 031 |
108,0 |
|
28 |
Manufacture of machinery and equipment n. e. c. |
|
|
29 |
Proizvodnja
motornih vozila, |
763 376 |
724 181 |
94,9 |
3 291 769 |
3 402 957 |
103,4 |
|
29 |
Manufacture of motor vehicles, |
|
|
30 |
Proizvodnja ostalih prijevoznih sredstava |
2 723 783 |
1 628 436 |
59,8 |
2 101 697 |
1 150 990 |
54,8 |
|
30 |
Manufacture of other transport equipment |
|
|
31 |
Proizvodnja namještaja |
1 135 144 |
1 072 109 |
94,4 |
1 084 348 |
903 137 |
83,3 |
|
31 |
Manufacture of furniture |
|
|
32 |
Ostala prerađivačka industrija |
247 232 |
238 523 |
96,5 |
1 231 356 |
1 215 959 |
98,7 |
|
32 |
Other manufacturing |
|
|
|
|
|
|
|
|
|
|
|
|
|
|
D |
|
Opskrba električnom energijom, plinom, parom i klimatizacija |
217 428 |
644 671 |
296,5 |
2 284 912 |
1 517 019 |
66,4 |
D |
|
Electricity, gas, steam and air conditioning supply |
|
|
|
|
|
|
|
|
|
|
|
|
|
|
E |
|
Opskrba vodom;
uklanjanje |
1 589 134 |
1 204 784 |
75,8 |
113 777 |
138 148 |
121,4 |
E |
|
Water supply; sewerage, waste management and remediation activities |
|
|
|
|
|
|
|
|
|
|
|
|
|
|
J |
|
Informacije i komunikacije |
245 238 |
243 302 |
99,2 |
325 368 |
293 083 |
90,1 |
J |
|
Information and communication |
|
|
|
|
|
|
|
|
|
|
|
|
|
|
M |
|
Stručne, znanstvene i tehničke djelatnosti |
925 |
230 |
24,9 |
1 073 |
793 |
73,9 |
M |
|
Professional, scientific and technical activities |
|
|
|
|
|
|
|
|
|
|
|
|
|
|
R |
|
Umjetnost, zabava i rekreacija |
3 716 |
2 550 |
68,6 |
2 142 |
2 544 |
118,8 |
R |
|
Arts, entertainment and recreation |
|
|
|
Neraspoređeno |
- |
62 958 |
- |
- |
3 618 |
- |
|
|
Not classified |
3. IZVOZ I UVOZ PO SEKTORIMA SMTK
EXPORT AND IMPORT, ACCORDING TO SITC SECTIONS
tis. kuna
Thousand kuna
|
|
|
Izvoz Export |
Uvoz Import |
|
|
||||
|
|
|
I.–VII. 2012. |
I.–VII. 2013. |
indeksi |
I.–VII. 2012. |
I.–VII. 2013. |
indeksi |
|
|
|
|
|
|
|
|
|
|
|
|
|
|
|
Ukupno |
40 873 724 |
39 122 956 |
95,7 |
72 451 991 |
71 568 217 |
98,8 |
|
Total |
|
|
|
|
|
|
|
|
|
|
|
|
0 |
Hrana i žive životinje |
3 944 320 |
3 599 335 |
91,3 |
6 749 942 |
7 215 778 |
106,9 |
0 |
Food and live animals |
|
|
|
|
|
|
|
|
|
|
|
|
1 |
Pića i duhan |
751 870 |
772 544 |
102,7 |
719 439 |
714 554 |
99,3 |
1 |
Beverages and tobacco |
|
|
|
|
|
|
|
|
|
|
|
|
2 |
Sirove materije, osim goriva |
3 274 928 |
3 025 001 |
92,4 |
1 087 961 |
1 091 005 |
100,3 |
2 |
Crude materials, except fuels |
|
|
|
|
|
|
|
|
|
|
|
|
3 |
Mineralna goriva i maziva |
5 556 919 |
5 815 595 |
104,7 |
16 724 439 |
14 953 778 |
89,4 |
3 |
Mineral fuels and lubricants |
|
|
|
|
|
|
|
|
|
|
|
|
4 |
Životinjska i biljna ulja i masti |
90 065 |
49 333 |
54,8 |
525 030 |
505 291 |
96,2 |
4 |
Animal and vegetable oils and fats |
|
|
|
|
|
|
|
|
|
|
|
|
5 |
Kemijski proizvodi |
4 232 387 |
4 378 164 |
103,4 |
9 883 222 |
10 039 949 |
101,6 |
5 |
Chemical products |
|
|
|
|
|
|
|
|
|
|
|
|
6 |
Proizvodi svrstani prema materijalu |
6 094 618 |
6 330 298 |
103,9 |
12 171 149 |
12 325 496 |
101,3 |
6 |
Manufactured goods classified chiefly by material |
|
|
|
|
|
|
|
|
|
|
|
|
7 |
Strojevi i prijevozna sredstva |
10 647 226 |
9 048 358 |
85,0 |
16 489 902 |
17 185 642 |
104,2 |
7 |
Machinery and transport equipment |
|
|
|
|
|
|
|
|
|
|
|
|
8 |
Razni gotovi proizvodi |
5 478 898 |
5 561 914 |
101,5 |
8 096 103 |
7 528 415 |
93,0 |
8 |
Miscellaneous manufactured articles |
|
|
|
|
|
|
|
|
|
|
|
|
9 |
Proizvodi i transakcije, d. n. |
802 493 |
479 455 |
59,7 |
4 803 |
4 692 |
97,7 |
9 |
Commodities and transactions, n. e. s. |
|
|
Neraspoređeno |
- |
62 958 |
- |
- |
3 618 |
- |
|
Not classified |
4. IZVOZ I UVOZ PREMA EKONOMSKIM GRUPACIJAMA ZEMALJA
EXPORT AND IMPORT, ACCORDING TO ECONOMIC CLASSIFICATION OF COUNTRIES
tis. kuna
Thousand kuna
|
|
Izvoz Export |
Uvoz Import |
|
||||
|
|
I.–VII. 2012. |
I.–VII. 2013. |
indeksi |
I.–VII. 2012. |
I.–VII. 2013. |
indeksi |
|
|
|
|
|
|
|
|
|
|
|
Ukupno |
40 873 724 |
39 122 956 |
95,7 |
72 451 991 |
71 568 217 |
98,8 |
Total |
|
|
|
|
|
|
|
|
|
|
Zemlje Europske unije |
23 676 629 |
24 140 804 |
102,0 |
52 835 036 |
52 731 902 |
99,8 |
EU countries |
|
|
|
|
|
|
|
|
|
|
Austrija |
2 899 946 |
2 600 706 |
89,7 |
7 170 144 |
7 020 055 |
97,9 |
Austria |
|
Belgija |
444 877 |
347 891 |
78,2 |
1 358 463 |
1 124 975 |
82,8 |
Belgium |
|
Bugarska |
129 153 |
158 369 |
122,6 |
289 464 |
216 176 |
74,7 |
Bulgaria |
|
Cipar |
40 757 |
41 581 |
102,0 |
51 534 |
21 715 |
42,1 |
Cyprus |
|
Češka |
431 010 |
397 844 |
92,3 |
1 455 347 |
1 548 401 |
106,4 |
Czech Republic |
|
Danska |
134 872 |
147 666 |
109,5 |
417 183 |
1 120 154 |
268,5 |
Denmark |
|
Estonija |
20 525 |
16 507 |
80,4 |
10 755 |
79 495 |
739,1 |
Estonia |
|
Finska |
69 099 |
75 427 |
109,2 |
259 689 |
188 798 |
72,7 |
Finland |
|
Francuska |
675 083 |
607 010 |
89,9 |
1 688 598 |
1 597 875 |
94,6 |
France |
|
Grčka |
175 510 |
554 306 |
315,8 |
208 440 |
318 801 |
152,9 |
Greece |
|
Irska |
41 924 |
39 996 |
95,4 |
225 876 |
257 171 |
113,9 |
Ireland |
|
Italija |
6 068 699 |
5 664 360 |
93,3 |
10 520 392 |
8 434 889 |
80,2 |
Italy |
|
Letonija |
23 276 |
17 717 |
76,1 |
21 133 |
16 788 |
79,4 |
Latvia |
|
Litva |
32 180 |
45 626 |
141,8 |
118 401 |
36 163 |
30,5 |
Lithuania |
|
Luksemburg |
11 207 |
586 949 |
1) |
15 379 |
77 328 |
502,8 |
Luxembourg |
|
Mađarska |
1 077 138 |
876 963 |
81,4 |
4 089 592 |
4 494 516 |
109,9 |
Hungary |
|
Malta |
586 786 |
514 152 |
87,6 |
417 678 |
102 682 |
24,6 |
Malta |
|
Nizozemska |
733 469 |
574 900 |
78,4 |
2 524 464 |
2 221 771 |
88,0 |
Netherlands |
|
Njemačka |
4 429 651 |
4 484 285 |
101,2 |
9 497 724 |
9 597 206 |
101,0 |
Germany |
|
Poljska |
437 754 |
449 355 |
102,7 |
1 337 389 |
1 531 211 |
114,5 |
Poland |
|
Portugal |
18 683 |
40 541 |
217,0 |
34 681 |
52 525 |
151,5 |
Portugal |
|
Rumunjska |
380 163 |
320 123 |
84,2 |
534 958 |
480 229 |
89,8 |
Romania |
|
Slovačka |
475 128 |
367 694 |
77,4 |
961 515 |
1 018 265 |
105,9 |
Slovakia |
|
Slovenija |
3 314 404 |
4 021 318 |
121,3 |
6 975 866 |
8 983 416 |
128,8 |
Slovenia |
|
Španjolska |
157 228 |
223 027 |
141,8 |
999 058 |
982 538 |
98,3 |
Spain |
|
Švedska |
198 586 |
234 819 |
118,2 |
895 430 |
512 584 |
57,2 |
Sweden |
|
Ujedinjena Kraljevina |
669 519 |
731 408 |
109,2 |
755 882 |
631 715 |
83,6 |
United Kingdom |
|
Neraspoređeno |
- |
261 |
- |
- |
64 464 |
- |
Not classified |
|
|
|
|
|
|
|
|
|
|
Zemlje Efte |
622 562 |
631 465 |
101,4 |
1 775 885 |
1 261 377 |
71,0 |
EFTA countries |
|
|
|
|
|
|
|
|
|
|
Island |
12 510 |
3 760 |
30,1 |
770 |
4 479 |
582,0 |
Iceland |
|
Lihtenštajn |
60 464 |
29 376 |
48,6 |
17 193 |
11 119 |
64,7 |
Liechtenstein |
|
Norveška |
250 345 |
172 605 |
68,9 |
114 628 |
121 242 |
105,8 |
Norway |
|
Švicarska |
299 243 |
425 724 |
142,3 |
1 643 295 |
1 124 538 |
68,4 |
Switzerland |
|
|
|
|
|
|
|
|
|
|
Zemlje Cefte |
8 397 407 |
7 827 452 |
93,2 |
4 503 819 |
4 419 071 |
98,1 |
CEFTA countries |
|
|
|
|
|
|
|
|
|
|
Albanija |
254 452 |
281 577 |
110,7 |
11 895 |
12 130 |
102,0 |
Albania |
|
Bosna i Hercegovina |
4 983 245 |
4 917 591 |
98,7 |
2 469 613 |
2 707 729 |
109,6 |
Bosnia and Herzegovina |
|
Crna Gora |
760 518 |
429 729 |
56,5 |
333 350 |
17 157 |
5,1 |
Montenegro |
|
Kosovo |
293 846 |
309 652 |
105,4 |
13 316 |
12 897 |
96,9 |
Kosovo |
|
Makedonija |
407 212 |
418 175 |
102,7 |
380 178 |
391 892 |
103,1 |
Macedonia |
|
Moldavija |
6 688 |
7 876 |
117,8 |
6 128 |
4 835 |
78,9 |
Moldova |
|
Srbija |
1 691 446 |
1 462 852 |
86,5 |
1 289 340 |
1 272 430 |
98,7 |
Serbia |
|
|
|
|
|
|
|
|
|
|
Zemlje OPEC-a |
728 898 |
688 586 |
94,5 |
355 669 |
916 279 |
257,6 |
OPEC countries |
|
|
|
|
|
|
|
|
|
|
Alžir |
300 385 |
21 837 |
7,3 |
25 531 |
9 462 |
37,1 |
Algeria |
|
Angola |
1 067 |
1 718 |
160,9 |
544 |
- |
- |
Angola |
|
Ekvador |
20 |
405 |
1) |
81 779 |
58 699 |
71,8 |
Ecuador |
|
Irak |
22 337 |
85 653 |
383,5 |
1 |
4 123 |
1) |
Iraq |
|
Iran, Islamska Republika |
31 048 |
17 490 |
56,3 |
2 502 |
1 177 |
47,1 |
Iran, Islamic Republic of |
|
Katar |
70 339 |
37 663 |
53,5 |
10 724 |
16 912 |
157,7 |
Qatar |
|
Kuvajt |
2 509 |
2 199 |
87,7 |
8 035 |
134 |
1,7 |
Kuwait |
|
Libija |
120 051 |
108 102 |
90,0 |
17 699 |
412 017 |
1) |
Libya |
|
Nigerija |
11 378 |
59 745 |
525,1 |
181 566 |
354 267 |
195,1 |
Nigeria |
|
Saudijska Arabija |
103 075 |
107 529 |
104,3 |
2 330 |
7 074 |
303,6 |
Saudi Arabia |
|
Ujedinjeni Arapski Emirati |
65 980 |
245 512 |
372,1 |
24 856 |
52 371 |
210,7 |
United Arab Emirates |
|
Venezuela |
709 |
733 |
103,3 |
102 |
41 |
40,4 |
Venezuela |
|
|
|
|
|
|
|
|
|
|
Ostale europske zemlje |
2 093 303 |
1 734 334 |
82,9 |
7 951 482 |
5 134 043 |
64,6 |
Other countries in Europe |
|
|
|
|
|
|
|
|
|
|
Bjelorusija |
29 280 |
54 083 |
184,7 |
1 491 |
108 062 |
1) |
Belarus |
|
Rusija |
1 247 276 |
926 016 |
74,2 |
5 554 885 |
3 356 196 |
60,4 |
Russian Federation |
|
Turska |
476 920 |
479 807 |
100,6 |
2 136 204 |
1 176 474 |
55,1 |
Turkey |
|
Ukrajina |
159 772 |
86 981 |
54,4 |
256 983 |
490 378 |
190,8 |
Ukraine |
|
Ostale zemlje |
180 055 |
187 447 |
104,1 |
1 919 |
2 933 |
152,9 |
Other countries |
|
|
|
|
|
|
|
|
|
|
Ostale azijske zemlje |
1 441 856 |
1 307 458 |
90,7 |
3 112 846 |
5 216 200 |
167,6 |
Other countries in Asia |
|
|
|
|
|
|
|
|
|
|
Azerbajdžan |
5 277 |
18 148 |
343,9 |
- |
365 727 |
- |
Azerbaijan |
|
Bangladeš |
12 225 |
14 078 |
115,2 |
7 247 |
12 000 |
165,6 |
Bangladesh |
|
Filipini |
46 964 |
42 690 |
90,9 |
6 721 |
5 475 |
81,5 |
Philippines |
|
Hong Kong, Kina |
12 902 |
16 655 |
129,1 |
84 708 |
129 393 |
152,8 |
Hong Kong, China |
|
Indija |
109 640 |
21 532 |
19,6 |
328 167 |
370 398 |
112,9 |
India |
|
Indonezija |
22 727 |
24 258 |
106,7 |
36 678 |
23 432 |
63,9 |
Indonesia |
|
Izrael |
39 205 |
83 659 |
213,4 |
94 357 |
83 651 |
88,7 |
Israel |
|
Japan |
370 042 |
271 682 |
73,4 |
75 081 |
61 125 |
81,4 |
Japan |
|
Kazahstan |
40 557 |
56 296 |
138,8 |
2 891 |
378 828 |
1) |
Kazakhstan |
|
Kina |
167 805 |
243 796 |
145,3 |
1 899 215 |
3 267 047 |
172,0 |
China |
|
Koreja, Republika |
12 076 |
34 091 |
282,3 |
161 652 |
142 877 |
88,4 |
Korea, Republic of |
|
Libanon |
403 170 |
79 400 |
19,7 |
12 130 |
417 |
3,4 |
Lebanon |
|
Malezija |
9 140 |
15 007 |
164,2 |
37 097 |
39 628 |
106,8 |
Malaysia |
|
Pakistan |
2 393 |
7 518 |
314,2 |
24 364 |
23 458 |
96,3 |
Pakistan |
|
Singapur |
20 363 |
12 691 |
62,3 |
67 056 |
48 366 |
72,1 |
Singapore |
|
Sirija |
1 868 |
1 183 |
63,3 |
28 178 |
54 |
0,2 |
Syrian Arab Republic |
|
Tajland |
13 085 |
8 832 |
67,5 |
49 317 |
70 786 |
143,5 |
Thailand |
|
Tajvan, Kina |
32 402 |
6 295 |
19,4 |
122 346 |
109 522 |
89,5 |
Taiwan, China |
|
Vijetnam |
11 194 |
21 743 |
194,2 |
43 255 |
67 930 |
157,0 |
Viet Nam |
|
Ostale zemlje |
108 821 |
327 905 |
301,3 |
32 386 |
16 088 |
49,7 |
Other countries |
|
|
|
|
|
|
|
|
|
|
Ostale afričke zemlje |
1 464 239 |
677 325 |
46,3 |
119 605 |
157 806 |
131,9 |
Other countries in Africa |
|
|
|
|
|
|
|
|
|
|
Egipat |
273 562 |
188 363 |
68,9 |
15 018 |
23 168 |
154,3 |
Egypt |
|
Gana |
2 806 |
1 585 |
56,5 |
670 |
753 |
112,3 |
Ghana |
|
Južnoafrička Republika |
72 211 |
105 881 |
146,6 |
29 727 |
20 270 |
68,2 |
South Africa |
|
Liberija |
361 962 |
2 671 |
0,7 |
762 |
8 |
1,1 |
Liberia |
|
Maroko |
17 351 |
146 719 |
845,6 |
22 004 |
83 003 |
377,2 |
Morocco |
|
Tunis |
631 865 |
203 398 |
32,2 |
19 092 |
23 911 |
125,2 |
Tunisia |
|
Ostale zemlje |
104 483 |
28 709 |
27,5 |
32 332 |
6 693 |
20,7 |
Other countries |
|
|
|
|
|
|
|
|
|
|
Ostale američke zemlje |
2 336 784 |
1 628 433 |
69,7 |
1 767 527 |
1 704 958 |
96,5 |
Other countries in America |
|
|
|
|
|
|
|
|
|
|
Argentina |
13 052 |
6 037 |
46,3 |
22 649 |
240 855 |
1) |
Argentina |
|
Brazil |
114 353 |
98 758 |
86,4 |
340 817 |
408 890 |
120,0 |
Brazil |
|
Čile |
29 842 |
3 880 |
13,0 |
4 078 |
3 493 |
85,6 |
Chile |
|
Kanada |
297 028 |
189 917 |
63,9 |
83 343 |
58 106 |
69,7 |
Canada |
|
Kolumbija |
3 131 |
21 586 |
689,3 |
178 142 |
179 277 |
100,6 |
Colombia |
|
Meksiko |
31 426 |
32 203 |
102,5 |
5 941 |
11 886 |
200,1 |
Mexico |
|
Peru |
10 825 |
2 333 |
21,6 |
1 281 |
1 206 |
94,1 |
Peru |
|
SAD |
1 201 514 |
1 248 687 |
103,9 |
605 037 |
716 894 |
118,5 |
United States |
|
Ostale zemlje |
635 613 |
25 031 |
3,9 |
526 237 |
84 351 |
16,0 |
Other countries |
|
|
|
|
|
|
|
|
|
|
Oceanijske zemlje |
112 047 |
424 643 |
379,0 |
30 119 |
26 472 |
87,9 |
Countries of Oceania |
|
|
|
|
|
|
|
|
|
|
Australija |
105 891 |
59 902 |
56,6 |
4 007 |
6 927 |
172,9 |
Australia |
|
Maršalovi Otoci |
522 |
360 967 |
1) |
13 |
92 |
706,4 |
Marshall Islands |
|
Novi Zeland |
5 551 |
3 167 |
57,1 |
25 975 |
19 375 |
74,6 |
New Zealand |
|
Ostale zemlje |
82 |
607 |
740,3 |
124 |
78 |
62,5 |
Other countries |
|
Neraspoređeno |
- |
62 456 |
- |
- |
109 |
- |
Not classified |
1) Indeks je veći od 999.
1) The index exceeds 999.
II. ROBNA RAZMJENA REPUBLIKE HRVATSKE S INOZEMSTVOM U EURIMA
FOREIGN TRADE IN GOODS OF THE REPUBLIC OF CROATIA, EURO
1. PROSJEČNA VRIJEDNOST EURA ZA REPUBLIKU HRVATSKU
AVERAGE EXCHANGE RATE OF EURO IN THE REPUBLIC OF CROATIA
|
|
Izvoz Export |
Uvoz Import |
||||
|
|
I. – VII. 2012. |
I. – VII. 2013. |
indeksi |
I. – VII. 2012. |
I. – VII. 2013. |
indeksi |
|
|
|
|
|
|
|
|
|
Prosječan tečaj 1 eura u kunama Average exchange rate for 1 euro in kuna |
7,5329 |
7,5656 |
100,4 |
7,5324 |
7,5587 |
100,3 |
2. IZVOZ I UVOZ PREMA MEĐUNARODNOJ KLASIFIKACIJI EKONOMSKE NAMJENE PROIZVODA (BEC)
EXPORT AND IMPORT, ACCORDING TO CLASSIFICATION BY BROAD ECONOMIC CATEGORIES (BEC)
tis. eura
Thousand euros
|
|
|
Izvoz Export |
Uvoz Import |
|
|
||||
|
|
|
I.–VII. 2012. |
I.–VII. 2013. |
indeksi |
I.–VII. 2012. |
I.–VII. 2013. |
indeksi |
|
|
|
|
|
|
|
|
|
|
|
|
|
|
|
Ukupno |
5 426 044 |
5 171 151 |
95,3 |
9 618 746 |
9 468 354 |
98,4 |
|
Total |
|
|
|
|
|
|
|
|
|
|
|
|
1 |
Hrana i pića |
559 458 |
520 137 |
93,0 |
893 680 |
947 940 |
106,1 |
1 |
Food and beverages |
|
|
|
|
|
|
|
|
|
|
|
|
2 |
Industrijski materijali, d. n. |
2 391 582 |
2 284 441 |
95,5 |
4 253 547 |
4 114 088 |
96,7 |
2 |
Industrial supplies n. e. s. |
|
|
|
|
|
|
|
|
|
|
|
|
3 |
Goriva i maziva |
171 687 |
220 544 |
128,5 |
703 702 |
630 793 |
89,6 |
3 |
Fuels and lubricants |
|
|
|
|
|
|
|
|
|
|
|
|
4 |
Kapitalni proizvodi (osim prijevoznih sredstava), njihovi dijelovi i pribor |
883 261 |
899 341 |
101,8 |
1 404 580 |
1 581 254 |
112,6 |
4 |
Capital goods (except transport |
|
|
|
|
|
|
|
|
|
|
|
|
5 |
Prijevozna sredstva, njihovi dijelovi |
516 296 |
292 055 |
56,6 |
798 733 |
696 481 |
87,2 |
5 |
Transport
equipment and parts
|
|
|
|
|
|
|
|
|
|
|
|
|
6 |
Proizvodi za široku potrošnju, d. n. |
866 001 |
868 966 |
100,3 |
1 535 298 |
1 479 524 |
96,4 |
6 |
Consumer goods n. e. s. |
|
|
|
|
|
|
|
|
|
|
|
|
7 |
Proizvodi, d. n. |
37 758 |
85 666 |
226,9 |
29 206 |
18 274 |
62,6 |
7 |
Goods n. e. s. |
3. IZVOZ I UVOZ PREMA NKD-u 2007.
EXPORT AND IMPORT, ACCORDING TO NKD 2007.
tis. eura
Thousand euros
|
|
|
|
Izvoz Export |
Uvoz Import |
|
|
|
||||
|
|
|
|
I.–VII. 2012. |
I.–VII. 2013. |
indeksi |
I.–VII. 2012. |
I.–VII. 2013. |
indeksi |
|
|
|
|
|
|
|
|
|
|
|
|
|
|
|
|
|
|
|
Ukupno |
5 426 044 |
5 171 151 |
95,3 |
9 618 746 |
9 468 354 |
98,4 |
|
|
Total |
|
|
|
|
|
|
|
|
|
|
|
|
|
|
A |
|
Poljoprivreda, šumarstvo i ribarstvo |
215 158 |
195 905 |
91,1 |
266 492 |
272 809 |
102,4 |
A |
|
Agriculture, forestry and fishing |
|
|
|
|
|
|
|
|
|
|
|
|
|
|
B |
|
Rudarstvo i vađenje |
62 974 |
65 204 |
103,5 |
1 224 294 |
1 307 719 |
106,8 |
B |
|
Mining and quarrying |
|
|
|
|
|
|
|
|
|
|
|
|
|
|
C |
|
Prerađivačka industrija |
4 874 897 |
4 624 451 |
94,9 |
7 765 928 |
7 628 743 |
98,2 |
C |
|
Manufacturing |
|
|
10 |
Proizvodnja prehrambenih proizvoda |
387 313 |
360 891 |
93,2 |
766 907 |
810 895 |
105,7 |
|
10 |
Manufacture of food products |
|
|
11 |
Proizvodnja pića |
73 106 |
67 423 |
92,2 |
59 619 |
66 885 |
112,2 |
|
11 |
Manufacture of beverages |
|
|
12 |
Proizvodnja duhanskih proizvoda |
28 755 |
33 884 |
117,8 |
30 032 |
25 652 |
85,4 |
|
12 |
Manufacture of tobacco products |
|
|
13 |
Proizvodnja tekstila |
50 002 |
53 476 |
106,9 |
191 250 |
187 781 |
98,2 |
|
13 |
Manufacture of textiles |
|
|
14 |
Proizvodnja odjeće |
244 597 |
207 872 |
85,0 |
265 094 |
239 771 |
90,4 |
|
14 |
Manufacture of wearing apparel |
|
|
15 |
Proizvodnja
kože i srodnih |
156 280 |
157 625 |
100,9 |
146 181 |
201 896 |
138,1 |
|
15 |
Manufacture of leather and related products |
|
|
16 |
Prerada drva i proizvoda od drva i pluta, osim namještaja; proizvodnja proizvoda od slame i pletarskih materijala |
221 001 |
224 893 |
101,8 |
104 846 |
100 600 |
95,9 |
|
16 |
Manufacture of wood and of products of wood and cork, except furniture; manufacture of articles of straw and plaiting materials |
|
|
17 |
Proizvodnja papira i proizvoda od papira |
92 745 |
81 300 |
87,7 |
235 232 |
241 591 |
102,7 |
|
17 |
Manufacture of paper and paper products |
|
|
18 |
Tiskanje i umnožavanje snimljenih zapisa |
767 |
641 |
83,6 |
2 100 |
1 836 |
87,4 |
|
18 |
Printing and reproduction of recorded media |
|
|
19 |
Proizvodnja koksa i rafiniranih naftnih proizvoda |
634 428 |
603 778 |
95,2 |
685 092 |
456 298 |
66,6 |
|
19 |
Manufacture of coke and refined petroleum products |
|
|
20 |
Proizvodnja kemikalija i kemijskih proizvoda |
312 194 |
299 737 |
96,0 |
809 453 |
820 581 |
101,4 |
|
20 |
Manufacture of chemicals and chemical products |
|
|
21 |
Proizvodnja osnovnih farmaceutskih proizvoda i farmaceutskih pripravaka |
234 230 |
260 423 |
111,2 |
397 868 |
406 057 |
102,1 |
|
21 |
Manufacture of basic pharmaceutical products and pharmaceutical preparations |
|
|
22 |
Proizvodnja proizvoda od gume i plastike |
98 372 |
108 212 |
110,0 |
362 224 |
356 732 |
98,5 |
|
22 |
Manufacture of rubber and plastic products |
|
|
23 |
Proizvodnja ostalih nemetalnih mineralnih proizvoda |
194 254 |
210 940 |
108,6 |
171 542 |
159 783 |
93,1 |
|
23 |
Manufacture of other non-metallic mineral products |
|
|
24 |
Proizvodnja metala |
243 632 |
213 260 |
87,5 |
568 104 |
551 404 |
97,1 |
|
24 |
Manufacture of basic metals |
|
|
25 |
Proizvodnja gotovih metalnih proizvoda, osim strojeva i opreme |
290 632 |
349 291 |
120,2 |
307 959 |
301 807 |
98,0 |
|
25 |
Manufacture of fabricated metal products, except machinery and equipment |
|
|
26 |
Proizvodnja
računala te elektroničkih |
147 232 |
112 349 |
76,3 |
506 520 |
628 209 |
124,0 |
|
26 |
Manufacture of computer, electronic and optical products |
|
|
27 |
Proizvodnja električne opreme |
402 341 |
374 630 |
93,1 |
381 053 |
378 505 |
99,3 |
|
27 |
Manufacture of electrical equipment |
|
|
28 |
Proizvodnja strojeva i uređaja, d. n. |
416 918 |
419 552 |
100,6 |
751 789 |
809 283 |
107,6 |
|
28 |
Manufacture of machinery and equipment n. e. c. |
|
|
29 |
Proizvodnja motornih vozila, prikolica i poluprikolica |
101 348 |
95 798 |
94,5 |
436 746 |
450 701 |
103,2 |
|
29 |
Manufacture of motor vehicles, trailers and semi-trailers |
|
|
30 |
Proizvodnja ostalih prijevoznih sredstava |
361 251 |
215 063 |
59,5 |
278 945 |
152 284 |
54,6 |
|
30 |
Manufacture of other transport equipment |
|
|
31 |
Proizvodnja namještaja |
150 682 |
141 903 |
94,2 |
143 920 |
119 398 |
83,0 |
|
31 |
Manufacture of furniture |
|
|
32 |
Ostala prerađivačka industrija |
32 817 |
31 508 |
96,0 |
163 451 |
160 795 |
98,4 |
|
32 |
Other manufacturing |
|
|
|
|
|
|
|
|
|
|
|
|
|
|
D |
|
Opskrba električnom energijom, plinom, parom i klimatizacija |
28 861 |
85 289 |
295,5 |
303 274 |
201 115 |
66,3 |
D |
|
Electricity, gas, steam and air conditioning supply |
|
|
|
|
|
|
|
|
|
|
|
|
|
|
E |
|
Opskrba vodom; uklanjanje otpadnih voda, gospodarenje otpadom te djelatnosti sanacije okoliša |
210 977 |
159 394 |
75,6 |
15 110 |
18 242 |
120,7 |
E |
|
Water supply; sewerage, waste management and remediation activities |
|
|
|
|
|
|
|
|
|
|
|
|
|
|
J |
|
Informacije i komunikacije |
32 560 |
32 143 |
98,7 |
43 221 |
38 818 |
89,8 |
J |
|
Information and communication |
|
|
|
|
|
|
|
|
|
|
|
|
|
|
M |
|
Stručne, znanstvene i tehničke djelatnosti |
123 |
30 |
24,6 |
143 |
105 |
73,4 |
M |
|
Professional, scientific and technical activities |
|
|
|
|
|
|
|
|
|
|
|
|
|
|
R |
|
Umjetnost, zabava i rekreacija |
493 |
337 |
68,3 |
284 |
336 |
118,1 |
R |
|
Arts, entertainment and recreation |
|
|
|
|
|
|
|
|
|
|
|
|
|
|
|
|
Neraspoređeno |
- |
8 397 |
- |
- |
467 |
- |
|
|
Not classified |
4. IZVOZ I UVOZ PO SEKTORIMA SMTK
EXPORT AND IMPORT, ACCORDING TO SITC SECTIONS
tis. eura
Thousand euros
|
|
|
Izvoz Export |
Uvoz Import |
|
|
||||
|
|
|
I.–VII. 2012. |
I.–VII. 2013. |
indeksi |
I.–VII. 2012. |
I.–VII. 2013. |
indeksi |
|
|
|
|
|
|
|
|
|
|
|
|
|
|
|
Ukupno |
5 426 044 |
5 171 151 |
95,3 |
9 618 746 |
9 468 354 |
98,4 |
|
Total |
|
|
|
|
|
|
|
|
|
|
|
|
0 |
Hrana i žive životinje |
523 587 |
475 825 |
90,9 |
896 281 |
955 419 |
106,6 |
0 |
Food and live animals |
|
|
|
|
|
|
|
|
|
|
|
|
1 |
Pića i duhan |
99 877 |
102 115 |
102,2 |
95 569 |
94 659 |
99,0 |
1 |
Beverages and tobacco |
|
|
|
|
|
|
|
|
|
|
|
|
2 |
Sirove materije, osim goriva |
434 816 |
400 041 |
92,0 |
144 433 |
144 150 |
99,8 |
2 |
Crude materials, except fuels |
|
|
|
|
|
|
|
|
|
|
|
|
3 |
Mineralna goriva i maziva |
737 690 |
768 055 |
104,1 |
2 220 514 |
1 975 004 |
88,9 |
3 |
Mineral fuels and lubricants |
|
|
|
|
|
|
|
|
|
|
|
|
4 |
Životinjska i biljna ulja i masti |
11 949 |
6 523 |
54,6 |
69 766 |
66 805 |
95,8 |
4 |
Animal and vegetable oils and fats |
|
|
|
|
|
|
|
|
|
|
|
|
5 |
Kemijski proizvodi |
561 870 |
578 227 |
102,9 |
1 312 155 |
1 328 744 |
101,3 |
5 |
Chemical products |
|
|
|
|
|
|
|
|
|
|
|
|
6 |
Proizvodi svrstani prema materijalu |
809 206 |
837 079 |
103,4 |
1 615 813 |
1 631 239 |
101,0 |
6 |
Manufactured goods classified chiefly by material |
|
|
|
|
|
|
|
|
|
|
|
|
7 |
Strojevi i prijevozna sredstva |
1 413 211 |
1 195 952 |
84,6 |
2 188 869 |
2 275 463 |
104,0 |
7 |
Machinery and transport equipment |
|
|
|
|
|
|
|
|
|
|
|
|
8 |
Razni gotovi proizvodi |
727 304 |
735 562 |
101,1 |
1 074 709 |
995 782 |
92,7 |
8 |
Miscellaneous manufactured articles |
|
|
|
|
|
|
|
|
|
|
|
|
9 |
Proizvodi i transakcije, d. n. |
106 534 |
63 377 |
59,5 |
637 |
622 |
97,5 |
9 |
Commodities and transactions, n. e. s. |
|
|
Neraspoređeno |
- |
8 397 |
- |
- |
467 |
- |
|
Not classified |
5. IZVOZ I UVOZ PREMA EKONOMSKIM GRUPACIJAMA ZEMALJA
EXPORT AND IMPORT, ACCORDING TO ECONOMIC CLASSIFICATION OF COUNTRIES
tis. eura
Thousand euros
|
|
Izvoz Export |
Uvoz Import |
|
||||
|
|
I.–VII. 2012. |
I.–VII. 2013. |
indeksi |
I.–VII. 2012. |
I.–VII. 2013. |
indeksi |
|
|
|
|
|
|
|
|
|
|
|
Ukupno |
5 426 044 |
5 171 151 |
95,3 |
9 618 746 |
9 468 354 |
98,4 |
Total |
|
|
|
|
|
|
|
|
|
|
Zemlje Europske unije |
3 143 035 |
3 197 853 |
101,7 |
7 014 150 |
6 983 020 |
99,6 |
EU countries |
|
|
|
|
|
|
|
|
|
|
Austrija |
384 870 |
344 523 |
89,5 |
951 701 |
929 675 |
97,7 |
Austria |
|
Belgija |
59 064 |
46 068 |
78,0 |
180 455 |
148 972 |
82,6 |
Belgium |
|
Bugarska |
17 147 |
20 999 |
122,5 |
38 426 |
28 634 |
74,5 |
Bulgaria |
|
Cipar |
5 425 |
5 501 |
101,4 |
6 841 |
2 879 |
42,1 |
Cyprus |
|
Češka |
57 230 |
52 726 |
92,1 |
193 177 |
205 225 |
106,2 |
Czech Republic |
|
Danska |
17 901 |
19 560 |
109,3 |
55 367 |
147 864 |
267,1 |
Denmark |
|
Estonija |
2 727 |
2 185 |
80,1 |
1 428 |
10 510 |
736,2 |
Estonia |
|
Finska |
9 168 |
9 978 |
108,8 |
34 472 |
24 965 |
72,4 |
Finland |
|
Francuska |
89 608 |
80 469 |
89,8 |
224 224 |
211 642 |
94,4 |
France |
|
Grčka |
23 296 |
73 091 |
313,7 |
27 660 |
42 195 |
152,5 |
Greece |
|
Irska |
5 579 |
5 339 |
95,7 |
30 009 |
34 057 |
113,5 |
Ireland |
|
Italija |
805 579 |
750 621 |
93,2 |
1 396 923 |
1 118 026 |
80,0 |
Italy |
|
Letonija |
3 091 |
2 345 |
75,9 |
2 808 |
2 223 |
79,2 |
Latvia |
|
Litva |
4 277 |
6 035 |
141,1 |
15 721 |
4 786 |
30,4 |
Lithuania |
|
Luksemburg |
1 489 |
77 576 |
1) |
2 044 |
10 191 |
498,6 |
Luxembourg |
|
Mađarska |
142 983 |
116 164 |
81,2 |
542 911 |
594 946 |
109,6 |
Hungary |
|
Malta |
77 912 |
68 005 |
87,3 |
55 431 |
13 654 |
24,6 |
Malta |
|
Nizozemska |
97 358 |
76 143 |
78,2 |
335 089 |
294 356 |
87,8 |
Netherlands |
|
Njemačka |
588 078 |
593 918 |
101,0 |
1 260 743 |
1 271 247 |
100,8 |
Germany |
|
Poljska |
58 108 |
59 515 |
102,4 |
177 578 |
202 838 |
114,2 |
Poland |
|
Portugal |
2 479 |
5 390 |
217,5 |
4 603 |
6 953 |
151,1 |
Portugal |
|
Rumunjska |
50 483 |
42 377 |
83,9 |
71 008 |
63 609 |
89,6 |
Romania |
|
Slovačka |
63 084 |
48 712 |
77,2 |
127 640 |
134 855 |
105,7 |
Slovakia |
|
Slovenija |
439 938 |
532 986 |
121,2 |
926 020 |
1 188 746 |
128,4 |
Slovenia |
|
Španjolska |
20 856 |
29 574 |
141,8 |
132 618 |
130 086 |
98,1 |
Spain |
|
Švedska |
26 366 |
31 100 |
118,0 |
118 913 |
67 844 |
57,1 |
Sweden |
|
Ujedinjena Kraljevina |
88 938 |
96 917 |
109,0 |
100 338 |
83 721 |
83,4 |
United Kingdom |
|
Neraspoređeno |
- |
35 |
- |
- |
8 321 |
- |
Not classified |
|
|
|
|
|
|
|
|
|
|
Zemlje Efte |
82 667 |
83 214 |
100,7 |
235 748 |
166 473 |
70,6 |
EFTA countries |
|
|
|
|
|
|
|
|
|
|
Island |
1 665 |
496 |
29,8 |
102 |
591 |
579,2 |
Iceland |
|
Lihtenštajn |
8 023 |
3 867 |
48,2 |
2 284 |
1 469 |
64,3 |
Liechtenstein |
|
Norveška |
33 252 |
22 731 |
68,4 |
15 202 |
15 988 |
105,2 |
Norway |
|
Švicarska |
39 727 |
56 121 |
141,3 |
218 161 |
148 425 |
68,0 |
Switzerland |
|
|
|
|
|
|
|
|
|
|
Zemlje Cefte |
1 114 880 |
1 031 400 |
92,5 |
598 026 |
582 625 |
97,4 |
CEFTA countries |
|
|
|
|
|
|
|
|
|
|
Albanija |
33 729 |
37 040 |
109,8 |
1 578 |
1 602 |
101,5 |
Albania |
|
Bosna i Hercegovina |
661 805 |
647 951 |
97,9 |
327 914 |
357 159 |
108,9 |
Bosnia and Herzegovina |
|
Crna Gora |
100 837 |
56 617 |
56,1 |
44 267 |
2 253 |
5,1 |
Montenegro |
|
Kosovo |
39 007 |
40 938 |
105,0 |
1 768 |
1 702 |
96,3 |
Kosovo |
|
Makedonija |
54 074 |
55 164 |
102,0 |
50 473 |
51 647 |
102,3 |
Macedonia |
|
Moldavija |
887 |
1 040 |
117,2 |
813 |
637 |
78,3 |
Moldova |
|
Srbija |
224 541 |
192 651 |
85,8 |
171 214 |
167 625 |
97,9 |
Serbia |
|
|
|
|
|
|
|
|
|
|
Zemlje OPEC-a |
96 920 |
90 700 |
93,6 |
47 362 |
120 726 |
254,9 |
OPEC countries |
|
|
|
|
|
|
|
|
|
|
Alžir |
40 001 |
2 877 |
7,2 |
3 386 |
1 235 |
36,5 |
Algeria |
|
Angola |
142 |
227 |
160,1 |
73 |
- |
- |
Angola |
|
Ekvador |
3 |
53 |
1) |
10 858 |
7 698 |
70,9 |
Ecuador |
|
Irak |
2 969 |
11 286 |
380,2 |
0 |
544 |
1) |
Iraq |
|
Iran, Islamska Republika |
4 127 |
2 293 |
55,6 |
332 |
155 |
46,8 |
Iran, Islamic Republic of |
|
Katar |
9 334 |
4 945 |
53,0 |
1 422 |
2 227 |
156,6 |
Qatar |
|
Kuvajt |
333 |
290 |
87,3 |
1 066 |
18 |
1,7 |
Kuwait |
|
Libija |
15 963 |
14 238 |
89,2 |
2 362 |
54 337 |
1) |
Libya |
|
Nigerija |
1 508 |
7 879 |
522,3 |
24 237 |
46 680 |
192,6 |
Nigeria |
|
Saudijska Arabija |
13 690 |
14 165 |
103,5 |
309 |
939 |
303,5 |
Saudi Arabia |
|
Ujedinjeni Arapski Emirati |
8 757 |
32 350 |
369,4 |
3 304 |
6 889 |
208,5 |
United Arab Emirates |
|
Venezuela |
94 |
96 |
102,3 |
14 |
5 |
39,4 |
Venezuela |
|
|
|
|
|
|
|
|
|
|
Ostale europske zemlje |
277 827 |
228 015 |
82,1 |
1 055 695 |
678 964 |
64,3 |
Other countries in Europe |
|
|
|
|
|
|
|
|
|
|
Bjelorusija |
3 888 |
7 121 |
183,2 |
198 |
14 220 |
1) |
Belarus |
|
Rusija |
165 613 |
122 025 |
73,7 |
737 642 |
443 828 |
60,2 |
Russian Federation |
|
Turska |
63 295 |
63 159 |
99,8 |
283 457 |
155 605 |
54,9 |
Turkey |
|
Ukrajina |
21 232 |
11 447 |
53,9 |
34 143 |
64 923 |
190,1 |
Ukraine |
|
Ostale zemlje |
23 799 |
24 264 |
102,0 |
255 |
388 |
152,2 |
Other countries |
|
|
|
|
|
|
|
|
|
|
Ostale azijske zemlje |
191 167 |
172 123 |
90,0 |
413 221 |
687 730 |
166,4 |
Other countries in Asia |
|
|
|
|
|
|
|
|
|
|
Azerbajdžan |
702 |
2 392 |
340,5 |
- |
47 214 |
- |
Azerbaijan |
|
Bangladeš |
1 624 |
1 855 |
114,3 |
966 |
1 569 |
162,5 |
Bangladesh |
|
Filipini |
6 250 |
5 629 |
90,1 |
893 |
723 |
80,9 |
Philippines |
|
Hong Kong, Kina |
1 713 |
2 190 |
127,8 |
11 246 |
17 120 |
152,2 |
Hong Kong, China |
|
Indija |
14 580 |
2 829 |
19,4 |
43 567 |
48 782 |
112,0 |
India |
|
Indonezija |
3 020 |
3 207 |
106,2 |
4 870 |
3 084 |
63,3 |
Indonesia |
|
Izrael |
5 211 |
11 008 |
211,2 |
12 521 |
11 033 |
88,1 |
Israel |
|
Japan |
48 990 |
35 839 |
73,2 |
9 972 |
8 016 |
80,4 |
Japan |
|
Kazahstan |
5 389 |
7 385 |
137,1 |
385 |
48 908 |
1) |
Kazakhstan |
|
Kina |
22 282 |
32 113 |
144,1 |
252 084 |
432 901 |
171,7 |
China |
|
Koreja, Republika |
1 601 |
4 490 |
280,5 |
21 497 |
18 817 |
87,5 |
Korea, Republic of |
|
Libanon |
53 381 |
10 520 |
19,7 |
1 600 |
56 |
3,5 |
Lebanon |
|
Malezija |
1 214 |
1 978 |
163,0 |
4 932 |
5 221 |
105,9 |
Malaysia |
|
Pakistan |
316 |
973 |
307,9 |
3 233 |
3 087 |
95,5 |
Pakistan |
|
Singapur |
2 702 |
1 671 |
61,8 |
8 904 |
6 384 |
71,7 |
Singapore |
|
Sirija |
248 |
156 |
63,1 |
3 726 |
7 |
0,2 |
Syrian Arab Republic |
|
Tajland |
1 734 |
1 164 |
67,2 |
6 553 |
9 326 |
142,3 |
Thailand |
|
Tajvan, Kina |
4 279 |
831 |
19,4 |
16 238 |
14 430 |
88,9 |
Taiwan, China |
|
Vijetnam |
1 487 |
2 860 |
192,3 |
5 740 |
8 939 |
155,7 |
Viet Nam |
|
Ostale zemlje |
14 444 |
43 033 |
297,9 |
4 295 |
2 114 |
49,2 |
Other countries |
|
|
|
|
|
|
|
|
|
|
Ostale afričke zemlje |
194 505 |
89 203 |
45,9 |
15 893 |
20 754 |
130,6 |
Other countries in Africa |
|
|
|
|
|
|
|
|
|
|
Egipat |
36 315 |
24 835 |
68,4 |
1 991 |
3 062 |
153,8 |
Egypt |
|
Gana |
374 |
209 |
55,9 |
89 |
98 |
109,1 |
Ghana |
|
Južnoafrička Republika |
9 611 |
13 954 |
145,2 |
3 947 |
2 665 |
67,5 |
South Africa |
|
Liberija |
48 043 |
352 |
0,7 |
101 |
1 |
1,1 |
Liberia |
|
Maroko |
2 295 |
19 277 |
840,2 |
2 933 |
10 897 |
371,6 |
Morocco |
|
Tunis |
84 003 |
26 803 |
31,9 |
2 525 |
3 155 |
124,9 |
Tunisia |
|
Ostale zemlje |
13 865 |
3 772 |
27,2 |
4 307 |
877 |
20,4 |
Other countries |
|
|
|
|
|
|
|
|
|
|
Ostale američke zemlje |
310 172 |
214 570 |
69,2 |
234 645 |
224 565 |
95,7 |
Other countries in America |
|
|
|
|
|
|
|
|
|
|
Argentina |
1 728 |
798 |
46,2 |
3 004 |
31 791 |
1) |
Argentina |
|
Brazil |
15 178 |
13 021 |
85,8 |
45 246 |
53 945 |
119,2 |
Brazil |
|
Čile |
3 963 |
510 |
12,9 |
541 |
460 |
85,0 |
Chile |
|
Kanada |
39 295 |
25 035 |
63,7 |
11 061 |
7 648 |
69,1 |
Canada |
|
Kolumbija |
415 |
2 852 |
687,3 |
23 560 |
23 613 |
100,2 |
Colombia |
|
Meksiko |
4 171 |
4 187 |
100,4 |
790 |
1 551 |
196,4 |
Mexico |
|
Peru |
1 443 |
307 |
21,3 |
170 |
158 |
92,7 |
Peru |
|
SAD |
159 503 |
164 565 |
103,2 |
80 337 |
94 261 |
117,3 |
United States |
|
Ostale zemlje |
84 476 |
3 294 |
3,9 |
69 936 |
11 138 |
15,9 |
Other countries |
|
|
|
|
|
|
|
|
|
|
Oceanijske zemlje |
14 871 |
56 020 |
376,7 |
4 006 |
3 482 |
86,9 |
Countries of Oceania |
|
|
|
|
|
|
|
|
|
|
Australija |
14 054 |
7 893 |
56,2 |
531 |
911 |
171,5 |
Australia |
|
Maršalovi Otoci |
69 |
47 635 |
1) |
2 |
12 |
678,0 |
Marshall Islands |
|
Novi Zeland |
737 |
411 |
55,9 |
3 456 |
2 549 |
73,8 |
New Zealand |
|
Ostale zemlje |
11 |
81 |
731,8 |
17 |
10 |
58,8 |
Other countries |
|
|
|
|
|
|
|
|
|
|
Neraspoređeno |
- |
8 053 |
- |
- |
15 |
- |
Not classified |
1) Indeks je veći od 999.
1) The index exceeds 999.
|
METODOLOŠKA OBJAŠNJENJA |
|
NOTES ON METHODOLOGY |
|
|
|
|
|
|
|
|
|
Pridruživanjem Republike Hrvatske Europskoj uniji, 1. srpnja 2013., statistički podaci o robnoj razmjeni Republike Hrvatske s inozemstvom dobivaju se iz dva različita izvora: Intrastat obrasca za statistiku robne razmjene između zemalja članica EU-a (Intrastat) i Jedinstvene carinske deklaracije za statistiku robne razmjene sa zemljama nečlanicama EU-a (Extrastat). |
|
After the accession of the Republic of Croatia in the European Union, data on foreign trade in goods statistics of the Republic of Croatia are acquired from two different sources: the Intrastat form for the statistics of trading in goods between the EU Member States (Intrastat) and the single administrative document for statistics of trading in goods with non-EU countries (Extrastat). |
|
|
|
|
|
|
|
|
|
Pravna osnova |
|
Legal basis |
|
|
|
|
|
Pravna osnova za provođenje istraživanja Intrastat jest europsko zakonodavstvo za statistiku robne razmjene između zemalja članica EU-a (Uredba br. 638/2004. i 222/2009. Europskog parlamenta i Vijeća te provedbena Uredba Komisije br. 1982/2004. i nadopunjujuće Uredbe Komisije br. 1915/2005., 91/2010. i 96/2010.), Zakon o provedbi carinskih propisa Europske unije (NN, br. 54/13.), Zakon o službenoj statistici (NN, br. 103/03., 75/09. i 59/12.), Godišnji provedbeni plan statističkih aktivnosti Republike Hrvatske, Program statističkih aktivnosti Republike Hrvatske, Zakon o carinskoj službi (NN, br. 83/09., 49/11. i 34/12.) te Uredba o izmjenama i dopunama Uredbe o unutarnjem ustrojstvu Ministarstva financija (NN, br. 67/12.). |
|
The legal basis of the conduct of the Intrastat survey is the European legislation related to the statistics of trading in goods between the EU Member States (Regulations No 638/2004 and 222/2009 of the European Parliament and the Council as well as Commission Implementing Regulation No 1982/2004 and Commission Amending Regulation Nos 1915/2005, 91/2010 and 96/2010), the EU Customs Regulations Implementation Act (NN, No. 54/13), the Official Statistics Act (NN, Nos 103/03, 75/09 and 59/12), the Annual Implementation Plan of Statistical Activities of the Republic of Croatia, the Programme of Statistical Activities of the Republic of Croatia, the Customs Administration Act (NN, Nos 83/09, 49/11 and 34/12) and the Regulation on Amendments on the Decree on the Internal Organisation of the Ministry of Finance (NN, No. 67/12). |
|
|
|
|
|
Pravna osnova za Extrastat jest europsko zakonodavstvo za statistku robne razmjene s trećim zemljama (Uredba (EZ-a) br. 471/2009. Europskog parlamenta i Vijeća, Uredba Komisije (EU) br. 92/2010 i Uredba Komisije (EU-a) br. 113/2010.), Zakon o provedbi carinskih propisa Europske unije (NN, br. 54/13.), Zakon o službenoj statistici (NN, br. 103/03., 75/09. i 59/12.), Godišnji provedbeni plan statističkih aktivnosti Republike Hrvatske, Program statističkih aktivnosti Republike Hrvatske, Zakon o carinskoj službi (NN, br. 83/09., 49/11. i 34/12.) i Pravilnik o ispunjavanju Jedinstvene carinske deklaracije (NN, br. 77/13.). |
|
The legal basis for the Extrastat is the European legislation related to the statistics of trading in goods with non-EU countries (Regulation (EC) No 471/2009 of the European Parliament and the Council, the Commission Regulation (EU) No 92/2010 and the Commission Regulation (EU) No 113/2010), the EU Customs Regulations Implementation Act (NN, No. 54/13), the Official Statistics Act (NN, Nos 103/03, 75/09 and 59/12), the Annual Implementation Plan of Statistical Activities of the Republic of Croatia, the Programme of Statistical Activities of the Republic of Croatia, the Customs Administration Act (NN, Nos 83/09, 49/11 and 34/12) and the Ordinance on Filling the Single Administrative Document (NN, No. 77/13). |
|
|
|
|
|
|
|
|
|
Izvori podataka |
|
Data sources |
|
|
|
|
|
Izvor podataka za robnu razmjenu sa zemljama članicama EU-a jest Intrastat obrazac putem kojeg izvještajne jedinice izvještavaju primitke i/ili otpreme na mjesečnoj osnovi, tj. u mjesecu u kojem roba fizički ulazi ili napušta teritorij Republike Hrvatske. Izvještajne jedinice jesu svi poslovni subjekti, obveznici poreza na dodanu vrijednost, čija vrijednost robne razmjene sa zemljama članicama EU prelazi prag uključivanja određenog za izvještajnu godinu. Za 2013. određena je vrijednost praga uključivanja za oba tijeka izvještavanja (primici i otpreme) od 1,7 milijuna kuna. |
|
Data source for the trading in goods with EU countries is the Intrastat form used by Providers of Statistical Information (PSIs) to report on arrivals and/or dispatches on the monthly basis, that is, in a month in which goods physically enter or exits the territory of the Republic of Croatia. The Providers of Statistical Information (PSIs) are all business entities, value added tax payers, whose value of trading in goods with EU countries exceeds the inclusion threshold for the reference year. For 2013, the value of 1.7 milion kuna of the exemption threshold for both flows of reporting (receipts and deliveries) has been determined. |
|
|
|
|
|
Izvor podataka za statistiku robne razmjene s trećim zemljama, odn. zemljama nečlanicama EU-a jesu Jedinstvene carinske deklaracije o izvozu i uvozu robe. Državni zavod za statistiku Republike Hrvatske dobiva od Carinske uprave Republike Hrvatske kontrolirane Jedinstvene carinske deklaracije u obliku slogova. |
|
Data sources for the trade in goods statistics with non-EU countries are single administrative documents on export and import of goods. The Croatian Bureau of Statistics receives the reviewed Single administrative documents from the Customs Administration of the Republic of Croatia in the form of data records. |
|
|
|
|
|
Poštujući osnovne metodološke preporuke Statističkog ureda UN-a i Eurostata, Državni zavod za statistiku prikupljene podatke Intrastata i Extrastata statistički obrađuje i objavljuje kao jedinstveni podatak robne razmjene Republike Hrvatske s inozemstvom. |
|
Following the basic methodological recommendations of the UN Statistical Office and Eurostat, the Croatian Bureau of Statistics statistically processes and disseminate the collected Intrastat and Extrastat data as unique information on the foreign trade in goods of the Republic of Croatia. |
|
|
|
|
|
|
|
|
|
Obuhvat i usporedivost |
|
Coverage and comparability |
|
|
|
|
|
Statistika robne razmjene s inozemstvom obuhvaća svu robu koja se izvozi iz zemlje odnosno uvozi u zemlju. U podatke o robnoj razmjeni s inozemstvom uključeni su i izvoz i uvoz prema osnovi unutarnje i vanjske proizvodnje na bruto osnovi. |
|
The statistics on foreign trade in goods comprises all the goods exported from or imported into the country. Data on foreign trade in goods include both export and import based on gross inward and outward processing. |
|
|
|
|
|
Iskazuju se stvarno postignute vrijednosti u vrijeme kad su poslovi zaključeni (fakturne vrijednosti) i preračunavaju se na osnovi isporuke na hrvatskoj granici. |
|
The values expressed are actual values achieved at the time when deals were contracted (invoice values), which are then further recalculated according to deliveries at the Croatian border. |
|
|
|
|
|
Statistička vrijednost robe jest vrijednost robe na hrvatskoj granici. Kod izvoza odnosno otprema vrijednosti su obračunane prema paritetu fob, a kod uvoza odnosno primitika vrijednosti se obračunavaju prema paritetu cif. |
|
The statistical value of goods is the value of goods at the Croatian border. The export values are calculated on the basis of the FOB parity and import ones according to the CIF parity. |
|
|
|
|
|
Iznosi u stranim valutama preračunavaju se u kune, eure i američke dolare primjenom mjesečnih tečajnih lista određenih za izvještajni mjesec. Primjenjuje se srednji valutni tečaj Hrvatske narodne banke. |
|
The amounts expressed in foreign currencies are converted into kuna, euros and American dollars according to the current monthly exchange rate lists. The mean exchange rate of the Croatian National Bank is used. |
|
|
|
|
|
U pojedinim tablicama može se dogoditi da ukupni zbroj ne odgovara zbroju pojedinačnih stavki zbog zaokruživanja na tisuće. |
|
In certain tables, the sum total may not equal the sum of individual figures due to the rounding to thousands. |
|
|
|
|
|
Tablice I. 1. i II. 2. obrađuju izvoz i uvoz prema Međunarodnoj klasifikaciji ekonomske namjene proizvoda (BEC). To je klasifikacija Ujedinjenih naroda utemeljena na Standardnoj međunarodnoj trgovinskoj klasifikaciji, Rev. 4 (SMTK, Rev. 4). Proizvodi SMTK, Rev. 4, razvrstavaju se u odgovarajuće skupine Međunarodne klasifikacije ekonomske namjene proizvoda na osnovi svoje glavne ekonomske namjene. Državni zavod za statistiku Republike Hrvatske obrađuje podatke na osnovi navedene klasifikacije od 2000. |
|
In tables I. 1. and II. 2., data on export and import were processed according to the UN Classification by Broad Economic Categories (BEC). It is a UN classification based on the Standard International Trade Classification, Rev. 4 (SITC, Rev. 4). Goods classified in the SITC, Rev. 4, are put into appropriate BEC groups on the grounds of their main intended use. The Croatian Bureau of Statistics has processed data according to the BEC since 2000. |
|
|
|
|
|
U prikazivanju podataka po djelatnostima primjenjuje se NKD 2007. (NN, br. 58/07. i 72/07.), koji je stupio na snagu 1. siječnja 2008. Utemeljen je na europskoj klasifikaciji NACE, Rev. 2, koja je obvezatna za zemlje članice Europske unije. Uvođenje NKD-a 2007. katkad dovodi do prekida vremenskih serija s obzirom na promjene u strukturi klasifikacije. Sve bitne promjene koje su se dogodile u klasifikaciji objavljene su u Metodologiji za statističku primjenu Nacionalne klasifikacije djelatnosti 2007. – NKD 2007. (NN, br. 102/07. i 123/08.). |
|
Data by type of activities have been presented according to the NKD 2007. (NN, Nos 58/07 and 72/07), which entered into force on 1 January 2008 and is based on the European classification NACE, Rev. 2, which is obligatory in the EU Member States. The implementation of NKD 2007. leads occasionally to the break in time series due to the changes in classification's structure. All relevant changes in the classification were published in the Methodology for Statistical Implementation of the National Classification of Activities, 2007 version – NKD 2007. (NN, Nos 102/07 and 123/08). |
|
|
|
|
|
Podaci se iskazuju prema proizvodnom načelu kod kojeg se podaci za izvoz i uvoz dobivaju prema djelatnosti koja proizvodi dotični proizvod, odnosno iz koje proizvod potječe. |
|
Data are presented by using the production approach according to which export and import data are reported according to the manufacturing activity from which the product originates. |
|
|
|
|
|
Roba koja se pojavljuje u izvozu i uvozu za potrebe statistike razvrstava se prema Standardnoj međunarodnoj trgovinskoj klasifikaciji (SMTK, Rev. 4). |
|
Goods listed under export and import are, for statistical needs, classified according to the Standard International Trade Classification (SITC, Rev. 4). |
|
|
|
|
|
Podaci se iskazuju kod izvoza robe prema zemljama namjene, a od 1. srpnja 2013. kod uvoza robe primjenjuje se novi metodološki kriterij iskazivanja podataka uvoza prema zemljama. U Extrastatu se kod uvoza robe podaci iskazuju prema zemljama podrijetla robe, dok se kod primitaka robe u Intrastatu iskazuju prema zemljama otpreme. Uslijed toga, u ovom priopćenje podaci o uvozu za razdoblje od siječnja 2012. do srpnja 2013. prema zemljama članicama i zemljama nečlanicama nisu usporedivi s podacima koji su za ta razdoblja prikazani u prijašnjim publikacijama. |
|
Data on the export are shown by countries of destination, while since 1 July 2013, a new methodological criterion has been applied, by which data on the import are shown by countries. In Extrastat, data on the import are shown by countries of the origin of goods, while in Intrastat data on the reception of goods are presented by countries of delivery. Consequently, data on the import to EU and non-EU countries, for the period from January to July 2013, are not comparable in this release to those presented for these periods in previous publications. |
|
|
|
|
|
Za određeni mjesec obrađuju se samo Jedinstvene carinske deklaracije koje imaju datum prihvaćanja u carinarnici/ispostavi iz tog mjeseca i Intrastat obrasci dostavljeni za izvještajni mjesec. U tekućoj godini mijenjaju se već objavljeni podaci za prijašnje mjesece radi razvrstavanja naknadno pristiglih i/ili ispravljenih Intrastat obrazaca i Jedinstvenih carinskih deklaracija koje se odnose na prijašnja razdoblja. |
|
Only single administrative documents containing the date of receipt in the customs office in a particular month are processed for that month as well as Intrastat forms submitted for the reporting month. The already issued data for previous months are changed during the current year in order to classify later received and/or corrected Intrastat forms and single administrative documents from previous periods. |
|
|
|
|
|
Mjesečni podaci ispravljaju se sve dok se ne zaključi konačna obrada tekuće godine (sredinom sljedeće godine). Mjesečni rezultati sve do konačne obrade tekuće godine i objavljivanja konačnih podataka smatraju se privremenima. Korigiranje mjesečnih podataka za 2012. zaključeno je 27. svibnja 2013. Podaci za mjesece u 2012. u ovom priopćenju smatraju se konačnima. |
|
The monthly data are corrected until the final data processing for the current year is done (the middle of the next year). The monthly data are considered provisional until the final processing of the current year and dissemination of the final data are done. The corrections of monthly data for 2012 were concluded on 27 May 2012 and, therefore, monthly data for 2012 issued in this Release are considered final. |
|
|
|
|
|
Konačni podaci za 2012. te podaci od siječnja 2013. uključuju i Jedinstvene carinske deklaracije s vrijednostima manjima od 500 kuna. |
|
The final data for 2012 and data of January 2013 also include single administrative documents containing values. |
|
|
|
|
|
|
|
|
|
Kratice |
|
Abbreviations |
|
|
|
|
|
BEC Međunarodna klasifikacija ekonomske namjene proizvoda br. broj Cefta Sporazum o slobodnoj trgovini srednjoeuropskih
cif cijena s osiguranjem i vozarinom d. n. drugdje nespomenuto Efta Europsko udruženje za slobodnu trgovinu Eurostat Statistički ured Europske unije fob franko brod mil. milijun NACE Statistička klasifikacija ekonomskih djelatnosti u Europskoj zajednici NKD 2007. Nacionalna klasifikacija djelatnosti, verzija 2007. NN Narodne novine OPEC Organizacija zemalja izvoznica nafte SAD Sjedinjene Američke Države SMTK Standardna međunarodna trgovinska klasifikacija tis. tisuća UN Ujedinjeni narodi USD američki dolar |
|
BEC Classification by Broad Economic Categories CEFTA Central European Free Trade Agreement CIF cost, insurance and freight EFTA European Free Trade Association EU European Union Eurostat Statistical
Office of the European Communities mln million NACE Statistical Classification of Economic
Activities n. e. c. not elsewhere classified n. e. s. not elsewhere specified NKD 2007. National Classification of Activities, 2007 version NN Narodne
novine, official gazette of the Republic of No. number OPEC Organization of Petroleum Exporting Countries SITC Standard International Trade Classification UN United Nations U.S. United States US $ American dollar |
|
|
|
|
|
|
|
|
|
Znakovi |
|
Symbols |
|
|
|
|
|
- nema pojave 0 podatak je manji od 0,5 upotrijebljene mjerne jedinice |
|
- no occurrence 0 value non zero but less than 0.5 of the unit of measure |
|
|
|
|
|
|
|
|
Izdaje i tiska Državni zavod za statistiku Republike Hrvatske, Zagreb, Ilica 3, p. p. 80.
Published and printed by the Croatian Bureau of Statistics, Zagreb, Ilica 3, P. O. B. 80
Telefon/ Phone: +385 (0) 1 4806-111, telefaks/ Fax: +385 (0) 1 4817-666
Odgovara ravnatelj Marko Krištof.
Person responsible: Marko Krištof, Director General
Priredile: Vesna Polančec i Darinka Grgurić
Prepared by: Vesna Polančec and Darinka Grgurić
|
|
MOLIMO KORISNIKE DA PRI KORIŠTENJU PODATAKA NAVEDU IZVOR.USERS ARE KINDLY REQUESTED TO STATE THE SOURCE |
|
Naklada: 20 primjeraka
20 copies printed
Podaci iz ovog priopćenja objavljuju se i na internetu.
First Release data are also published on the Internet.
Služba za komunikaciju s korisnicima
User Communication Service
|
· Informacije i korisnički zahtjevi Information and user requests |
· Pretplata publikacija Subscription |
· Novinarski upiti Press corner |
|
Telefon/ Phone: Elektronička pošta/ E-mail: Telefaks/ Fax: |
Telefon/ Phone: +385 (0) 1 4814-791 Elektronička pošta/ E-mail: Telefaks/ Fax: |
Telefon/ Phone: Elektronička pošta/ E-mail: Telefaks/ Fax: |