|

GODINA/ YEAR: L. ZAGREB,
17. RUJNA 2013./ 17 SEPTEMBER, 2013 BROJ/
NUMBER: 13.1.1/5. - CORR.
CODEN POPCEA ISSN 1330-0350
INDEKSI POTROŠAČKIH CIJENA U SVIBNJU 2013.
CONSUMER
PRICE INDICES, MAY 2013
|
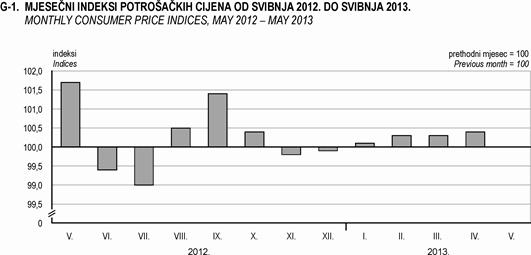
Cijene dobara
i usluga za osobnu potrošnju, mjerene indeksom potrošačkih cijena, u
svibnju 2013., u odnosu na travanj 2013., u prosjeku su ostale na istoj
razini, a u odnosu na svibanj 2012., tj. na godišnjoj razini, više su za
1,6%, dok su u godišnjem prosjeku više za 4,0%.
|
|
In May
2013, as compared to April 2013, the prices of goods and services for
personal consumption, measured by consumer price indices, remained at the
same level on the average. As compared to May 2012, that is, at the annual
level, they increased by 1.6% and on the annual average by 4.0%.
|
|
|
|
|
|
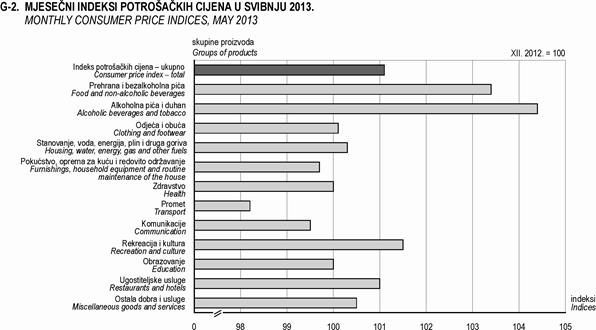
Promatrano
po glavnim skupinama prema namjeni potrošnje, u svibnju 2013., u odnosu na
travanj 2013., najviše su porasle cijene Odjeće i obuće, koje su u prosjeku
više za 1,3% (nova kolekcija odjeće i obuće), cijene Prehrane i
bezalkoholnih pića, koje su u prosjeku više za 1,2% (više cijene mlijeka i
mliječnih proizvoda te svježeg voća), cijene Ugostiteljskih usluga koje su
u prosjeku više za 0,3% te cijene Rekreacije i kulture, koje su u prosjeku
više za 0,2%. Cijene Pokućstva, opreme za kuću i redovitog održavanja te
cijene Ostalih dobara i usluga, koje su u prosjeku po svakoj skupini više
za 0,1%.
|
|
Reviewed
by the main groups by purpose of consumption, the highest increase in the
consumer price indices in May 2013, as compared to April 2013, was recorded
in the prices of Clothing and footwear (1.3%, new collection of clothing
and footwear), in the prices of Food and non-alcoholic beverages (1.2%, higher prices of milk and dairy products, and fresh fruits), in the prices of Restaurants and
hotels (0.3%) and in the prices of Recreation and
Culture (0.2%) as well as in the prices of Furnishings, household equipment
and routine maintenance of the house and the prices of Miscellaneous goods
and services (0.1% in each group).
|
|
|
|
|
|
Porast
indeksa potrošačkih cijena u svibnju 2013., u odnosu na travanj 2013.,
ublažile su cijene Komunikacija, koje su u prosjeku niže za 2,3% (niže
cijene mobilne mreže), cijene Prometa (niže cijene goriva za osobne
automobile), koje su u prosjeku niže za 2,2%, cijene Zdravstva, koje su u
prosjeku niže za 1,4% te cijene Stanovanja, vode, energije, plina i drugih
goriva, koje su
u prosjeku niže za 0,3%.
|
|
The increase
in the consumer price indices in May 2013, as compared to April 2013, was
alleviated by the decrease of 2.3% in the prices of
Communication (lower prices of mobile network), of
2.2% in the prices of Transport (lower prices of fuels for personal transport
equipment), of 1.4% in the
prices of Health and of 0.3% in the prices of Housing, water, electricity,
gas and other fuels.
|
|
|
|
|
|
Istodobno
su cijene Alkoholnih pića i duhana te cijene Obrazovanja u svibnju 2013., u
odnosu na travanj 2013., u prosjeku ostale na razini cijena iz travnja.
|
|
At the
same time, in May 2013, as compared to April 2013, the prices of Alcoholic beverages and tobacco as well as the
prices of Education remained on the average at the April level.
|
|
|
|
|
|
Najveći
doprinos porastu indeksa potrošačkih cijena u svibnju 2013., u odnosu na
travanj 2013., imale su cijene Prehrane i bezalkoholnih pića (za 0,35%) te
cijene Odjeće i obuće (za 0,08%), a najveći doprinos padu indeksa imale su
cijene Prometa (za -0,30%) te cijene Komunikacija (za -0,11%).
|
|
The
prices of Food and non-alcoholic beverages (by 0.35%) and the prices of
Clothing and footwear (by 0.08%) contributed the most to the increase of
consumer price indices in May 2013, as compared to April 2013, while the
prices of Transport (by -0.30%) and the prices of Communication (by -0.11%)
contributed the most to their decrease.
|
|
|
|
|
|
U
sklopu indeksa potrošačkih cijena, cijene Dobara u svibnju 2013., u odnosu
na travanj 2013., u prosjeku su više za 0,1%, a cijene Usluga u prosjeku su
niže za 0,4%.
|
|
Within
the consumer price indices, in May 2013, as compared to April 2013, the
prices of Goods increased by 0.1% on the average, while the prices of
Services decreased by 0.4% on the average.
|

ISPRAVAK
Molimo korisnike da se umjesto priopćenjem 13.1.1/5. Indeks
potrošačkih cijena u svibnju 2013. od 14. lipnja 2013. koriste ovim.
CORRECTION
Users are kindly requested to use this First Release
instead of the First Release No. 13.1.1/5. Consumer price indices, May 2013, published on 14 June 2013.
1. INDEKSI POTROŠAČKIH CIJENA PREMA
KLASIFIKACIJI COICOP U SVIBNJU 2013.
CONSUMER
PRICE INDICES, ACCORDING TO COICOP, MAY
2013
|
|
COICOP
|
Struktura
Structure
(%)
|
V. 2013.
Ø 2010.
|
V. 2013.
V. 2012.
|
V. 2013.
IV. 2013.
|
V. 2013.
XII. 2012.
|
VI.
2012. − V. 2013.
VI.
2011. −
V.
2012.
|
|
COICOP
|
|
|
|
|
|
|
|
|
|
|
|
|
00
|
Indeksi
potrošačkih cijena – ukupno
|
100,00
|
108,6
|
101,6
|
100,0
|
101,1
|
104,0
|
00
|
Consumer price indices – total
|
|
|
|
|
|
|
|
|
|
|
|
|
01
|
Prehrana i bezalkoholna pića
|
29,40
|
113,6
|
106,0
|
101,2
|
103,4
|
104,9
|
01
|
Food and non-alcoholic
beverages
|
|
|
|
|
|
|
|
|
|
|
|
|
01.1
|
Prehrana
|
26,87
|
114,4
|
106,5
|
101,3
|
103,7
|
105,3
|
01.1
|
Food
|
|
01.1.1
|
Kruh i žitarice
|
5,22
|
111,0
|
103,7
|
99,7
|
102,7
|
102,1
|
01.1.1
|
Bread and cereals
|
|
01.1.2
|
Meso
|
7,81
|
109,1
|
102,8
|
100,4
|
99,8
|
105,9
|
01.1.2
|
Meat
|
|
01.1.3
|
Ribe
|
1,13
|
111,2
|
103,0
|
101,0
|
104,2
|
103,2
|
01.1.3
|
Fish
|
|
01.1.4
|
Mlijeko, sir i jaja
|
4,47
|
118,0
|
109,2
|
104,8
|
105,1
|
104,7
|
01.1.4
|
Milk, cheese and eggs
|
|
01.1.5
|
Ulja i masti
|
1,26
|
119,9
|
108,1
|
101,8
|
100,8
|
100,1
|
01.1.5
|
Oils and fats
|
|
01.1.6
|
Voće
|
1,56
|
128,4
|
112,2
|
105,4
|
116,7
|
111,0
|
01.1.6
|
Fruit
|
|
01.1.7
|
Povrće
|
2,66
|
128,8
|
122,2
|
100,4
|
110,9
|
115,3
|
01.1.7
|
Vegetables
|
|
01.1.8
|
Šećer, džem, med, čokolada
i konditorski proizvodi
|
1,63
|
105,7
|
100,4
|
99,5
|
100,6
|
101,0
|
01.1.8
|
Sugar, jam, honey, chocolate
and confectionery
|
|
01.1.9
|
Ostali prehrambeni proizvodi,
d. n.
|
1,13
|
113,4
|
102,6
|
99,8
|
100,9
|
104,3
|
01.1.9
|
Food products n. e. c.
|
|
01.2
|
Bezalkoholna pića
|
2,53
|
105,6
|
100,7
|
100,1
|
100,3
|
100,8
|
01.2
|
Non-alcoholic beverages
|
|
01.2.1
|
Kava, čaj i kakao
|
1,14
|
108,7
|
99,6
|
99,2
|
99,8
|
100,3
|
01.2.1
|
Coffee, tea and cocoa
|
|
01.2.2
|
Mineralna voda, osvježavajuća
pića i sokovi
|
1,39
|
103,5
|
101,5
|
100,8
|
100,7
|
101,3
|
01.2.2
|
Mineral waters, soft drinks
and juices
|
|
|
|
|
|
|
|
|
|
|
|
|
02
|
Alkoholna pića i duhan
|
4,68
|
118,5
|
107,5
|
100,0
|
104,4
|
105,9
|
02
|
Alcoholic
beverages and tobacco
|
|
02.1
|
Alkoholna pića
|
1,26
|
109,8
|
104,5
|
100,0
|
101,9
|
103,8
|
02.1
|
Alcoholic
beverages
|
|
02.1.1
|
Žestoka pića
|
0,12
|
106,4
|
103,0
|
100,2
|
102,6
|
102,1
|
02.1.1
|
Spirits
|
|
02.1.2
|
Vino
|
0,45
|
105,3
|
101,1
|
100,2
|
99,5
|
103,0
|
02.1.2
|
Wine
|
|
02.1.3
|
Pivo
|
0,69
|
113,7
|
107,1
|
99,8
|
103,4
|
104,7
|
02.1.3
|
Beer
|
|
02.2
|
Duhan
|
3,42
|
122,3
|
108,5
|
100,0
|
105,3
|
106,6
|
02.2
|
Tobacco
|
|
|
|
|
|
|
|
|
|
|
|
|
03
|
Odjeća i obuća
|
5,76
|
94,1
|
95,6
|
101,3
|
100,1
|
95,6
|
03
|
Clothing and footwear
|
|
03.1
|
Odjeća
|
3,94
|
92,2
|
94,5
|
101,2
|
99,8
|
93,9
|
03.1
|
Clothing
|
|
03.1.1
|
Materijal za odjeću
|
0,02
|
101,9
|
101,9
|
99,6
|
101,6
|
100,8
|
03.1.1
|
Clothing materials
|
|
03.1.2
|
Odjevni predmeti
|
3,81
|
92,1
|
94,4
|
101,3
|
99,7
|
93,8
|
03.1.2
|
Garments
|
|
03.1.3
|
Ostali odjevni predmeti i pribor
|
0,04
|
95,1
|
97,7
|
100,3
|
101,9
|
95,7
|
03.1.3
|
Other articles of cloth
ng and clothing accessories
|
|
03.1.4
|
Čišćenje, popravak i posudba
odjeće
|
0,07
|
100,7
|
100,8
|
100,3
|
100,8
|
99,5
|
03.1.4
|
Cleaning, repair and hire of
clothing
|
|
03.2
|
Obuća i popravci obuće
|
1,82
|
98,5
|
98,1
|
101,6
|
101,0
|
99,7
|
03.2
|
Footwear and repair of footwear
|
|
03.2.1
|
Obuća
|
1,82
|
98,5
|
98,1
|
101,6
|
101,0
|
99,7
|
03.2.1
|
Footwear
|
|
|
|
|
|
|
|
|
|
|
|
|
04
|
Stanovanje, voda, energija,
plin i druga goriva
|
17,89
|
118,8
|
101,1
|
99,7
|
100,3
|
112,0
|
04
|
Housing, water, electricity,
gas and other fuels
|
|
04.1
|
Najamnina
|
0,88
|
101,2
|
100,0
|
100,0
|
100,0
|
100,0
|
04.1
|
Actual rentals for housing
|
|
04.3
|
Održavanje i popravci stana
|
0,93
|
107,6
|
101,3
|
100,3
|
100,5
|
103,3
|
04.3
|
Maintenance and repair of the
dwelling
|
|
04.3.1
|
Proizvodi za održavanje
i popravak stana
|
0,67
|
108,0
|
101,1
|
100,3
|
100,4
|
103,0
|
04.3.1
|
Materials for the maintenance
and repair of the dwelling
|
|
04.3.2
|
Usluge za održavanje i popravci
u stanu
|
0,26
|
107,2
|
101,9
|
100,5
|
100,9
|
104,0
|
04.3.2
|
Services for the maintena
ce
and repair of the dwelling
|
|
04.4
|
Opskrba vodom i različite
komunalne usluge
|
4,17
|
110,6
|
102,3
|
100,0
|
102,2
|
103,6
|
04.4
|
Water supply and
miscellaneous
services relating to the dwelling
|
|
04.4.1
|
Opskrba vodom
|
1,96
|
114,4
|
104,9
|
100,0
|
104,6
|
104,9
|
04.4.1
|
Water supply
|
|
04.4.2
|
Odvoz smeća i otpada
|
0,75
|
103,2
|
100,0
|
100,0
|
100,0
|
100,9
|
04.4.2
|
Refuse collection
|
|
04.4.3
|
Kanalizacija
|
0,92
|
112,8
|
100,0
|
100,0
|
100,0
|
105,3
|
04.4.3
|
Sewage collection
|
|
04.4.4
|
Ostale usluge za stanovanje
|
0,54
|
103,4
|
100,4
|
100,1
|
100,2
|
100,8
|
04.4.4
|
Other services related to the
dwelling
|
|
04.5
|
Goriva i energija
|
11,91
|
124,8
|
100,7
|
99,6
|
99,6
|
117,2
|
04.5
|
Electricity, gas and other fuels
|
|
04.5.1
|
Električna energija
|
5,79
|
125,0
|
100,0
|
100,0
|
100,0
|
119,8
|
04.5.1
|
Electricity
|
|
04.5.2
|
Plin
|
2,99
|
129,7
|
97,9
|
98,9
|
96,9
|
124,3
|
04.5.2
|
Gas
|
|
04.5.3
|
Tekuća goriva
|
0,35
|
126,1
|
89,4
|
93,9
|
91,2
|
102,4
|
04.5.3
|
Liquid fuels
|
|
04.5.4
|
Kruta goriva
|
2,16
|
105,7
|
104,6
|
100,0
|
103,5
|
102,8
|
04.5.4
|
Solid fuels
|
|
04.5.5
|
Zagrijavanje stana
|
0,62
|
122,4
|
117,0
|
100,0
|
100,0
|
111,2
|
04.5.5
|
Heat energy
|
|
|
|
|
|
|
|
|
|
|
|
|
05
|
Pokućstvo, oprema za kuću
i redovito održavanje
|
4,70
|
104,9
|
100,4
|
100,1
|
99,7
|
101,8
|
05
|
Furnishings, household equipment
and routine maintenance of the house
|
|
05.1
|
Namještaj i pokućstvo, tepisi
i ostale podne prostirke
|
0,95
|
99,1
|
99,0
|
99,9
|
99,1
|
100,4
|
05.1
|
Furniture and furnishings, carpets
and other floor coverings
|
|
05.1.1
|
Namještaj i
pokućstvo
|
0,91
|
98,9
|
99,0
|
100,0
|
99,1
|
100,4
|
05.1.1
|
Furniture and furnishings
|
|
05.1.2
|
Tepisi i
ostale podne prostirke
|
0,03
|
101,1
|
96,9
|
99,1
|
99,5
|
99,3
|
05.1.2
|
Carpets and other floor coverings
|
|
05.1.3
|
Popravci namještaja,
pokućstva i podnih prostirki
|
0,01
|
99,3
|
100,9
|
100,0
|
99,5
|
100,2
|
05.1.3
|
Repair of furniture, furnishings
and floor coverings
|
|
|
|
|
|
|
|
|
|
|
|
|
05.2
|
Tekstilni
proizvodi za kućanstvo
|
0,17
|
107,0
|
99,2
|
99,8
|
100,7
|
102,3
|
05.2
|
Household textiles
|
|
05.3
|
Kućanski
aparati
|
0,68
|
101,2
|
99,7
|
99,7
|
99,2
|
100,6
|
05.3
|
Household appliances
|
|
05.3.1
|
Veliki
kućanski aparati
|
0,60
|
100,9
|
99,6
|
99,7
|
99,2
|
100,5
|
05.3.1
|
Major hou
ehold appliances
|
|
05.3.2
|
Mali
kućanski električni aparati
|
0,05
|
102,5
|
99,6
|
99,9
|
99,3
|
101,2
|
05.3.2
|
Small electric household
appliances
|
|
05.3.3
|
Popravak
kućanskih aparata
|
0,03
|
105,5
|
100,4
|
99,8
|
99,8
|
102,3
|
05.3.3
|
Repair of household appliances
|
|
05.4
|
Stakleno i stolno
posuđe
|
0,15
|
105,8
|
101,6
|
100,1
|
100,5
|
102,2
|
05.4
|
Glassware and tableware utensils
|
|
05.5
|
Alat i oprema za kuću i vrt
|
0,36
|
109,2
|
102,5
|
100,1
|
101,1
|
103,9
|
05.5
|
Tools and equipment for house and
garden
|
|
05.5.1
|
Veći alati i oprema za kuću i vrt
|
0,13
|
104,2
|
99,5
|
101,0
|
100,3
|
100,6
|
05.5.1
|
Major tools and equipment for
house and garden
|
|
05.5.2
|
Mali alati i pomagala
|
0,23
|
112,4
|
104,5
|
99,7
|
101,5
|
106,0
|
05.5.2
|
Small tools and accessories
|
|
05.6
|
Proizvodi i usluge za održavanje
kućanstva
|
2,39
|
108,4
|
100,0
|
100,3
|
99,7
|
102,5
|
05.6
|
Goods and services for household
maintenance
|
|
05.6.1
|
Proizvodi za održavanje kućanstva
|
2,26
|
108,8
|
100,8
|
100,3
|
99,5
|
102,5
|
05.6.1
|
Non-durable household goods
|
|
05.6.2
|
Kućanske usluge i usluge u
kućanstvima
|
0,13
|
105,6
|
103,8
|
100,2
|
103,4
|
102,9
|
05.6.2
|
Domestic services and household
services
|
|
|
|
|
|
|
|
|
|
|
|
|
06
|
Zdravstvo
|
2,81
|
103,6
|
100,8
|
98,6
|
100,0
|
102,6
|
06
|
Health
|
|
06.1
|
Medicinski proizvodi, pomagala
i oprema
|
2,16
|
105,4
|
100,5
|
98,2
|
100,1
|
103,0
|
06.1
|
Medical products, appliances and
equipment
|
|
06.1.1
|
Farmaceutski proizvodi
|
1,90
|
105,7
|
100,6
|
97,9
|
100,0
|
103,3
|
06.1.1
|
Pharmaceutical products
|
|
06.1.2
|
Ostali medicinski i terapeutski
proizvodi
|
0,26
|
104,0
|
100,5
|
100,0
|
100,8
|
101,4
|
06.1.2
|
Other medical and therapeutic
products
|
|
06.2
|
Zdravstvene usluge osim bolničkih
|
0,57
|
103,6
|
102,7
|
101,5
|
100,9
|
102,5
|
06.2
|
Medical services, except hospital
services
|
|
06.2.1
|
Medicinske usluge
|
0,22
|
98,9
|
101,0
|
100,0
|
99,6
|
102,0
|
06.2.1
|
Medical services
|
|
06.2.2
|
Zubarske usluge
|
0,35
|
108,9
|
104,0
|
102,5
|
101,8
|
103,0
|
06.2.2
|
Dental services
|
|
06.3
|
Bolničke usluge
|
0,08
|
90,8
|
90,8
|
91,0
|
90,8
|
99,2
|
06.3
|
Hospital services
|
|
|
|
|
|
|
|
|
|
|
|
|
07
|
Promet
|
13,42
|
106,6
|
95,9
|
97,8
|
98,2
|
101,4
|
07
|
Transport
|
|
07.1
|
Prometna sredstva
|
2,05
|
97,0
|
96,5
|
99,8
|
99,5
|
99,2
|
07.1
|
Purchase of vehicles
|
|
07.1.1
|
Automobili
|
2,02
|
97,0
|
96,5
|
99,7
|
99,4
|
99,2
|
07.1.1
|
Motor cars
|
|
07.1.2
|
Motocikli i bicikli
|
0,03
|
98,0
|
95,7
|
102,1
|
103,5
|
97,7
|
07.1.2
|
Motor cycle and bicycles
|
|
07.2
|
Upotreba prometnih sredstava
|
9,99
|
110,0
|
94,7
|
97,1
|
97,1
|
101,5
|
07.2
|
Operation of personal transport
equipment
|
|
07.2.1
|
Rezervni dijelovi i pribor
|
0,68
|
106,3
|
100,3
|
100,4
|
100,5
|
101,4
|
07.2.1
|
Spare parts and accessories
|
|
07.2.2
|
Goriva i maziva za osobna vozila
|
7,37
|
112,0
|
92,7
|
96,1
|
95,9
|
101,3
|
07.2.2
|
Fuels and lubricants for personal
transport equipment
|
|
07.2.3
|
Održavanje i popravci osobnih
vozila
|
1,02
|
104,0
|
101,5
|
99,8
|
100,8
|
102,3
|
07.2.3
|
Maintenance and repair of personal
transport equipment
|
|
07.2.4
|
Ostale usluge vezane za
prometna sredstva
|
0,92
|
101,8
|
102,0
|
100,0
|
100,0
|
102,1
|
07.2.4
|
Other services in respect of
personal transport equipment
|
|
07.3
|
Prometne usluge
|
1,38
|
110,6
|
105,0
|
100,0
|
104,1
|
103,4
|
07.3
|
Transport services
|
|
07.3.1
|
Željeznički putnički promet
|
0,30
|
115,1
|
115,1
|
100,0
|
115,1
|
106,3
|
07.3.1
|
Passenger transport by railway
|
|
07.3.2
|
Cestovni putnički promet
|
0,80
|
108,0
|
100,9
|
99,9
|
100,1
|
103,1
|
07.3.2
|
Passenger transport by road
|
|
07.3.3
|
Avionski putnički promet
|
0,06
|
125,7
|
119,1
|
101,4
|
114,1
|
108,0
|
07.3.3
|
Passenger transport by air
|
|
07.3.4
|
Vodeni promet putnika
|
0,04
|
96,2
|
101,4
|
100,0
|
100,0
|
101,1
|
07.3.4
|
Passenger transport by sea and
inland waterway
|
|
07.3.5
|
Ostali putnički promet
|
0,18
|
143,6
|
100,7
|
100,0
|
100,7
|
121,3
|
07.3.5
|
Combined passenger transport
|
|
|
|
|
|
|
|
|
|
|
|
|
08
|
Komunikacije
|
4,96
|
89,0
|
97,2
|
97,7
|
99,5
|
98,4
|
08
|
Communication
|
|
08.1
|
Poštanske usluge
|
0,05
|
117,1
|
100,0
|
100,0
|
100,0
|
100,0
|
08.1
|
Postal services
|
|
08.2
|
Telefonska i telefaksna oprema
i usluge
|
4,91
|
88,8
|
97,1
|
97,7
|
99,5
|
98,4
|
08.2
|
Telephone and telefax equipment
and services
|
|
|
|
|
|
|
|
|
|
|
|
|
09
|
Rekreacija i kultura
|
5,12
|
101,4
|
101,0
|
100,2
|
101,5
|
102,7
|
09
|
Recreation and culture
|
|
09.1
|
Audiovizualna, fotooprema
i informatička oprema
|
0,41
|
88,0
|
97,3
|
99,9
|
99,5
|
97,5
|
09.1
|
Audio-visual, photographic and
information processing equipment
|
|
09.1.1
|
Oprema za prijam, snimanje
i reprodukciju zvuka i slike
|
0,23
|
88,1
|
95,7
|
99,7
|
99,5
|
95,2
|
09.1.1
|
Equipment for the reception,
recording and reproduction of sound and pictures
|
|
09.1.2
|
Oprema za fotografiranje
i snimanje
|
0,02
|
81,8
|
94,6
|
99,6
|
97,6
|
95,8
|
09.1.2
|
Photographic and recording
equipment
|
|
09.1.3
|
Informatička oprema
|
0,13
|
86,9
|
99,4
|
100,4
|
100,0
|
99,7
|
09.1.3
|
Information processing equipment
|
|
09.1.4
|
Nosači zvuka i slike s priborom
|
0,03
|
93,5
|
97,7
|
99,4
|
98,5
|
99,1
|
09.1.4
|
Recording media for pictures and
sound
|
|
09.2
|
Ostala trajna dobra za rekreaciju
i kulturu
|
0,01
|
105,7
|
103,8
|
100,0
|
104,7
|
103,6
|
09.2
|
Other major durables for
recreation and culture
|
|
09.3
|
Ostala dobra za rekreaciju,
vrt i kućni ljubimci
|
0,87
|
103,5
|
101,0
|
100,3
|
101,9
|
101,9
|
09.3
|
Other recreational items and
equipment, gardens and pets
|
|
09.3.1
|
Igračke, igre i hobi
|
0,05
|
101,0
|
99,5
|
99,5
|
100,0
|
101,9
|
09.3.1
|
Toys, games and hobbies
|
|
09.3.2
|
Sportska oprema, oprema za
kampiranje i rekreaciju na otvorenome
|
0,05
|
96,4
|
97,4
|
100,1
|
99,3
|
99,1
|
09.3.2
|
Equipment for sport, camping and
open-air recreation
|
|
09.3.3
|
Vrtlarstvo
|
0,31
|
110,7
|
103,5
|
101,1
|
103,2
|
104,6
|
09.3.3
|
Gardens, plants and flowers
|
|
09.3.4
|
Kućni ljubimci, proizvodi i usluge
vezane za kućne ljubimce
|
0,46
|
99,4
|
99,7
|
99,8
|
101,6
|
100,2
|
09.3.4
|
Pets and related products and
services for pets including veterinary services
|
|
09.4
|
Usluge rekreacije i kulture
|
2,05
|
104,6
|
100,2
|
100,0
|
100,2
|
103,1
|
09.4
|
Recreational and cultural services
|
|
09.4.1
|
Rekreacijske i sportske usluge
|
0,34
|
98,0
|
99,7
|
100,0
|
100,0
|
99,8
|
09.4.1
|
Recreational and sporting services
|
|
09.4.2
|
Usluge kulture
|
1,71
|
106,1
|
100,4
|
100,0
|
100,2
|
103,9
|
09.4.2
|
Cultural services
|
|
|
|
|
|
|
|
|
|
|
|
09.5
|
Knjige, novine i pisaći pribor
|
1,44
|
100,2
|
102,0
|
100,0
|
101,2
|
100,9
|
09.5
|
Books, newspapers and stationery
|
|
09.5.1
|
Knjige
|
0,67
|
96,3
|
100,2
|
100,1
|
100,0
|
100,1
|
09.5.1
|
Books
|
|
09.5.2
|
Novine i časopisi
|
0,54
|
100,9
|
103,3
|
100,0
|
102,8
|
100,2
|
09.5.2
|
Newspapers and periodicals
|
|
09.5.3
|
Različiti tiskani materijali,
pribor
za pisanje i crtanje
|
0,23
|
111,7
|
103,8
|
99,8
|
100,8
|
105,3
|
09.5.3
|
Miscellaneous printed matter and
stationary and drawing materials
|
|
09.6
|
Paket-aranžman
|
0,34
|
100,0
|
107,0
|
102,0
|
111,5
|
110,3
|
09.6
|
Package holidays
|
|
|
|
|
|
|
|
|
|
|
|
|
10
|
Obrazovanje
|
0,91
|
92,3
|
100,3
|
100,0
|
100,0
|
99,6
|
10
|
Education
|
|
|
|
|
|
|
|
|
|
|
|
|
11
|
Ugostiteljske usluge
|
3,15
|
103,8
|
101,9
|
100,3
|
101,0
|
101,4
|
11
|
Restaurants and hotels
|
|
11.1
|
Hrana i piće
|
2,91
|
104,7
|
101,5
|
100,3
|
100,8
|
102,3
|
11.1
|
Catering services
|
|
11.1.1
|
Hrana i piće u restoranima,
kavanama i slično
|
2,73
|
104,6
|
101,4
|
100,3
|
100,8
|
102,3
|
11.1.1
|
Meals and drinks provided by
restaurants, cafes and like
|
|
11.1.2
|
Hrana i piće u kantinama
|
0,18
|
105,0
|
102,4
|
100,1
|
101,1
|
102,6
|
11.1.2
|
Canteens
|
|
11.2
|
Usluge smještaja
|
0,24
|
99,0
|
105,7
|
101,3
|
103,5
|
95,3
|
11.2
|
Accommodation services
|
|
|
|
|
|
|
|
|
|
|
|
|
12
|
Ostala dobra i usluge
|
7,20
|
105,5
|
101,6
|
100,1
|
100,5
|
102,4
|
12
|
Miscellaneous goods and services
|
|
12.1
|
Osobna njega
|
3,99
|
105,1
|
101,3
|
100,2
|
100,5
|
102,8
|
12.1
|
Personal care
|
|
12.1.1
|
Usluge u frizerskim salonima
i centrima za uljepšavanje
|
1,12
|
103,5
|
99,9
|
100,0
|
99,5
|
103,0
|
12.1.1
|
Services of hairdressing salons
and grooming establishments
|
|
12.1.2
|
Električni pribor za osobnu njegu
|
0,05
|
102,7
|
102,1
|
99,3
|
100,8
|
102,6
|
12.1.2
|
Electrical appliances for personal
care
|
|
12.1.3
|
Ostali neelektrični pribor
i proizvodi za osobnu njegu
|
2,82
|
105,8
|
101,8
|
100,3
|
100,8
|
102,7
|
12.1.3
|
Other non-electrical appliances
and products for personal care
|
|
12.3
|
Osobni predmeti, d. n.
|
0,27
|
110,2
|
102,3
|
100,3
|
101,8
|
103,5
|
12.3
|
Personal effects n. e. c.
|
|
12.3.1
|
Satovi i nakit
|
0,06
|
128,3
|
104,1
|
99,7
|
101,5
|
108,2
|
12.3.1
|
Clocks, watches and jewellery
|
|
12.3.2
|
Ostali osobni predmeti
|
0,21
|
102,6
|
101,8
|
100,4
|
101,9
|
101,6
|
12.3.2
|
Other personal items
|
|
12.4
|
Socijalna zaštita
|
0,14
|
104,7
|
100,5
|
100,3
|
100,3
|
100,1
|
12.4
|
Social protection
|
|
12.5
|
Osiguranje
|
1,74
|
100,8
|
100,1
|
99,9
|
100,0
|
100,0
|
12.5
|
Insurance
|
|
12.5.2
|
Osiguranje vezano za stanovanje
|
0,08
|
100,1
|
100,0
|
100,0
|
100,0
|
100,0
|
12.5.2
|
Insurance connected with the
dwelling
|
|
12.5.3
|
Osiguranje vezano za zdravstvo
|
0,55
|
100,9
|
100,3
|
99,8
|
100,1
|
100,2
|
12.5.3
|
Insurance connected with health
|
|
12.5.4
|
Osiguranje vezano za transport
|
1,11
|
100,8
|
100,0
|
100,0
|
100,0
|
100,0
|
12.5.4
|
Insurance connected with transport
|
|
12.6
|
Financijske usluge, d. n.
|
0,23
|
125,8
|
102,0
|
100,0
|
101,5
|
102,0
|
12.6
|
Financial services n. e. c.
|
|
12.7
|
Ostale usluge, d. n.
|
0,83
|
106,6
|
105,8
|
100,0
|
100,6
|
104,9
|
12.7
|
Other services n. e. c.
|
2. INDEKSI POTROŠAČKIH CIJENA PO POSEBNIM
SKUPINAMA U SVIBNJU 2013.
CONSUMER
PRICE INDICES, BY SELECTED GROUPS, MAY 2013
|
|
Struktura
Structure
(%)
|
V. 2013.
Ø 2010.
|
V. 2013.
V. 2012.
|
V. 2013.
IV. 2013.
|
V. 2013.
XII. 2012.
|
VI. 2012. − V. 2013.
VI. 2011. −
V. 2012.
|
|
|
|
|
|
|
|
|
|
|
|
Dobra1)
|
76,97
|
110,9
|
101,9
|
100,1
|
101,3
|
104,8
|
Goods1)
|
|
Usluge1)
|
23,03
|
100,8
|
100,5
|
99,6
|
100,5
|
101,5
|
Services1)
|
|
Ukupno bez energije
|
80,74
|
106,7
|
102,5
|
100,4
|
101,8
|
102,7
|
Total, without energy
|
|
Ukupno bez energije i
prehrane
|
53,87
|
103,0
|
100,6
|
99,9
|
100,9
|
101,4
|
Total, without energy and food
|
|
Ukupno bez energije,
prehrane, pića i duhana
|
46,66
|
101,2
|
99,9
|
99,9
|
100,6
|
100,9
|
Total, without energy, food, beverages and
tobacco
|
|
Ukupno
bez energije i neprerađenih prehrambenih proizvoda
|
67,58
|
105,1
|
101,6
|
100,2
|
101,3
|
101,6
|
Total, without energy and unprocessed food
|
|
Dobra bez električne
energije1)
|
71,19
|
109,9
|
102,0
|
100,1
|
101,4
|
103,8
|
Goods without electricity1)
|
|
Dobra bez električne
energije i vode
|
68,57
|
109,7
|
101,8
|
100,1
|
101,3
|
103,7
|
Goods without electricity and water supply
|
|
Industrijski
neprehrambeni proizvodi bez energije
|
23,63
|
101,4
|
99,4
|
100,2
|
100,6
|
100,3
|
Non-food industrial goods without energy
|
|
Energija
|
19,26
|
119,0
|
97,5
|
98,2
|
98,2
|
110,5
|
Energy
|
|
Prehrana, piće i duhan
|
34,08
|
114,4
|
106,2
|
101,0
|
103,5
|
105,1
|
Food, beverages and tobacco
|
|
Dobra bez prehrane, pića
i duhana1)
|
42,89
|
108,0
|
98,5
|
99,3
|
99,5
|
104,6
|
Goods without food, beverages and tobacco1)
|
|
Neprerađeni prehrambeni
proizvodi
|
13,15
|
115,3
|
107,7
|
101,1
|
104,5
|
108,1
|
Unprocessed food
|
|
Prerađeni prehrambeni
proizvodi
|
20,93
|
113,7
|
105,3
|
101,0
|
102,9
|
103,3
|
Processed
food
|
1) Vidi
Metodološka objašnjenja.
1) See Notes on Methodology.
3. GODIŠNJI INDEKSI POTROŠAČKIH
CIJENA
ANNUAL CONSUMER PRICE INDICES
|
|
2010. = 100
|
Prethodna
godina = 100
Previous year = 100
|
|
|
indeks
potrošačkih cijena – ukupno
Consumer price index – total
|
dobra
Goods
|
usluge
Services
|
indeks
potrošačkih cijena – ukupno
Consumer price index – total
|
|
|
|
|
|
|
|
1998.
|
69,7
|
72,3
|
60,3
|
-
|
|
1999.
|
72,5
|
74,4
|
65,2
|
104,0
|
|
2000.
|
75,8
|
77,7
|
68,6
|
104,6
|
|
2001.
|
78,7
|
80,3
|
72,2
|
103,8
|
|
2002.
|
80,0
|
80,6
|
77,5
|
101,7
|
|
2003.
|
81,4
|
81,8
|
79,5
|
101,8
|
|
2004.
|
83,1
|
83,2
|
82,1
|
102,1
|
|
2005.
|
85,8
|
86,1
|
84,5
|
103,3
|
|
2006.
|
88,6
|
88,6
|
88,4
|
103,2
|
|
2007.
|
91,1
|
91,2
|
91,0
|
102,9
|
|
2008.
|
96,7
|
97,2
|
94,5
|
106,1
|
|
2009.
|
99,0
|
99,1
|
98,6
|
102,4
|
|
2010.
|
100,0
|
100,0
|
100,0
|
101,1
|
|
2011.
|
102,3
|
103,0
|
99,6
|
102,3
|
|
2012.
|
105,8
|
107,3
|
100,1
|
103,4
|
4. MJESEČNI
INDEKSI POTROŠAČKIH CIJENA
MONTHLY CONSUMER PRICE INDICES
|
|
Ø 2010. = 100
|
|
|
I.
|
II.
|
III.
|
IV.
|
V.
|
VI.
|
VII.
|
VIII.
|
IX.
|
X.
|
XI.
|
XII.
|
|
|
|
Ukupno
Total
index
|
|
|
|
|
|
|
|
|
|
|
|
|
|
|
|
1998.
|
68,4
|
68,7
|
69,0
|
69,4
|
70,1
|
70,1
|
69,8
|
69,7
|
70,0
|
70,0
|
70,3
|
70,5
|
|
1999.
|
71,2
|
71,5
|
71,7
|
72,0
|
72,7
|
72,7
|
73,0
|
72,8
|
72,9
|
73,1
|
72,8
|
73,2
|
|
2000.
|
73,9
|
74,2
|
74,6
|
75,0
|
75,3
|
76,1
|
76,5
|
76,4
|
76,7
|
76,8
|
77,0
|
77,2
|
|
2001.
|
77,4
|
77,8
|
77,7
|
78,8
|
79,5
|
79,3
|
78,5
|
79,0
|
79,2
|
78,9
|
78,8
|
79,1
|
|
2002.
|
79,9
|
79,8
|
79,8
|
80,0
|
80,4
|
80,0
|
79,7
|
79,6
|
79,9
|
80,1
|
80,2
|
80,5
|
|
2003.
|
80,9
|
81,1
|
81,5
|
81,3
|
81,5
|
81,2
|
81,3
|
81,3
|
81,5
|
81,5
|
81,7
|
81,9
|
|
2004.
|
82,7
|
82,6
|
82,7
|
82,8
|
83,4
|
83,2
|
82,9
|
82,9
|
82,8
|
83,1
|
83,5
|
84,1
|
|
2005.
|
84,4
|
85,3
|
85,9
|
85,7
|
85,7
|
85,6
|
85,4
|
85,5
|
85,9
|
86,5
|
86,7
|
87,2
|
|
2006.
|
87,7
|
88,4
|
88,5
|
88,7
|
89,2
|
89,1
|
88,3
|
88,4
|
88,4
|
88,3
|
88,9
|
89,0
|
|
2007.
|
89,2
|
89,5
|
90,1
|
90,7
|
91,1
|
90,8
|
90,2
|
90,7
|
91,8
|
92,1
|
93,0
|
94,1
|
|
2008.
|
94,8
|
94,7
|
95,2
|
95,9
|
96,9
|
97,7
|
97,8
|
97,5
|
97,7
|
97,5
|
97,4
|
96,8
|
|
2009.
|
98,0
|
98,7
|
98,8
|
99,6
|
99,6
|
99,7
|
99,0
|
98,9
|
98,7
|
98,8
|
99,2
|
98,7
|
|
2010.
|
99,1
|
99,3
|
99,8
|
100,2
|
100,4
|
100,3
|
99,9
|
99,8
|
100,1
|
100,2
|
100,4
|
100,5
|
|
2011.
|
101,0
|
101,5
|
102,3
|
102,6
|
102,9
|
102,4
|
101,9
|
101,8
|
102,2
|
102,8
|
103,0
|
102,6
|
|
2012.
|
102,2
|
102,8
|
104,4
|
105,2
|
106,9
|
106,3
|
105,3
|
105,9
|
107,3
|
107,8
|
107,5
|
107,4
|
|
2013.
|
107,6
|
107,9
|
108,2
|
108,6
|
108,6
|
|
|
|
|
|
|
|
|
|
|
|
|
|
|
|
|
|
|
|
|
|
|
|
|
|
|
|
|
|
|
|
|
|
|
|
|
Dobra
Goods
|
|
|
|
|
|
|
|
|
|
|
|
|
|
|
|
1998.
|
71,9
|
72,1
|
72,2
|
72,5
|
72,8
|
72,5
|
72,1
|
71,8
|
72,3
|
72,2
|
72,4
|
72,8
|
|
1999.
|
73,4
|
73,8
|
74,1
|
74,4
|
74,6
|
74,3
|
74,7
|
74,4
|
74,6
|
74,7
|
74,4
|
75,0
|
|
2000.
|
75,7
|
76,1
|
76,6
|
77,0
|
77,1
|
78,1
|
78,4
|
78,2
|
78,6
|
78,8
|
78,8
|
79,1
|
|
2001.
|
79,3
|
79,8
|
79,8
|
80,8
|
81,7
|
81,5
|
80,4
|
80,2
|
80,5
|
79,9
|
79,9
|
80,2
|
|
2002.
|
80,8
|
80,7
|
80,5
|
80,8
|
81,1
|
80,3
|
79,9
|
79,9
|
80,3
|
80,5
|
80,6
|
81,1
|
|
2003.
|
81,6
|
81,8
|
82,2
|
81,8
|
82,0
|
81,5
|
81,2
|
81,2
|
81,9
|
82,0
|
82,2
|
82,3
|
|
2004.
|
83,3
|
83,1
|
83,1
|
83,3
|
83,7
|
83,2
|
82,5
|
82,5
|
82,5
|
83,1
|
83,6
|
84,4
|
|
2005.
|
84,6
|
85,8
|
86,6
|
86,2
|
86,1
|
85,8
|
85,3
|
85,3
|
86,2
|
86,7
|
86,8
|
87,3
|
|
2006.
|
87,9
|
88,5
|
88,7
|
89,0
|
89,5
|
89,2
|
88,0
|
88,0
|
88,2
|
88,3
|
89,0
|
89,0
|
|
2007.
|
89,1
|
89,3
|
90,0
|
90,9
|
91,3
|
90,7
|
89,7
|
90,2
|
91,9
|
92,4
|
93,5
|
94,9
|
|
2008.
|
95,5
|
95,2
|
95,8
|
96,6
|
97,8
|
98,4
|
98,2
|
97,7
|
98,3
|
98,3
|
98,0
|
97,3
|
|
2009.
|
98,2
|
98,9
|
99,2
|
100,2
|
100,1
|
99,9
|
98,7
|
98,5
|
98,6
|
98,8
|
99,3
|
98,6
|
|
2010.
|
99,1
|
99,3
|
99,8
|
100,5
|
100,7
|
100,3
|
99,4
|
99,1
|
100,1
|
100,3
|
100,7
|
100,8
|
|
2011.
|
101,5
|
102,0
|
103,0
|
103,3
|
103,8
|
102,9
|
102,1
|
102,0
|
103,1
|
103,9
|
104,2
|
103,8
|
|
2012.
|
103,3
|
104,0
|
105,7
|
106,7
|
108,8
|
107,8
|
106,4
|
107,1
|
109,2
|
109,7
|
109,5
|
109,4
|
|
2013.
|
109,4
|
109,8
|
110,3
|
110,8
|
110,9
|
|
|
|
|
|
|
|
|
|
|
|
|
|
|
|
|
|
|
|
|
|
|
|
|
|
|
|
|
|
|
|
|
|
|
|
|
Usluge
Services
|
|
|
|
|
|
|
|
|
|
|
|
|
|
|
|
1998.
|
56,4
|
57,0
|
58,0
|
58,5
|
60,8
|
61,6
|
61,7
|
61,7
|
61,8
|
62,0
|
62,2
|
62,2
|
|
1999.
|
63,0
|
63,0
|
63,1
|
63,1
|
65,7
|
66,2
|
66,5
|
66,5
|
66,4
|
66,6
|
66,3
|
66,3
|
|
2000.
|
66,8
|
67,0
|
67,0
|
67,5
|
68,2
|
68,3
|
69,4
|
69,6
|
69,5
|
69,5
|
69,9
|
70,0
|
|
2001.
|
70,1
|
70,3
|
69,7
|
70,9
|
70,9
|
71,2
|
71,4
|
74,3
|
74,3
|
74,4
|
74,4
|
74,7
|
|
2002.
|
75,9
|
76,2
|
76,4
|
76,7
|
77,3
|
78,1
|
78,4
|
77,9
|
78,1
|
78,1
|
78,5
|
78,2
|
|
2003.
|
78,3
|
78,5
|
78,7
|
78,8
|
79,1
|
79,6
|
81,1
|
81,1
|
79,6
|
79,5
|
79,5
|
79,9
|
|
2004.
|
80,2
|
80,5
|
80,8
|
80,8
|
82,0
|
82,5
|
83,5
|
83,6
|
83,1
|
82,6
|
82,6
|
82,8
|
|
2005.
|
82,9
|
83,2
|
83,3
|
83,6
|
83,9
|
84,4
|
85,3
|
85,4
|
84,5
|
85,1
|
85,7
|
86,2
|
|
2006.
|
86,9
|
87,6
|
87,7
|
87,5
|
88,0
|
88,5
|
89,3
|
89,7
|
89,1
|
88,7
|
88,9
|
89,0
|
|
2007.
|
89,6
|
90,0
|
90,2
|
90,2
|
90,5
|
91,1
|
92,1
|
92,7
|
91,6
|
91,1
|
91,3
|
91,5
|
|
2008.
|
92,2
|
92,7
|
93,0
|
93,3
|
93,8
|
95,1
|
96,2
|
96,6
|
95,4
|
94,9
|
95,1
|
95,3
|
|
2009.
|
97,4
|
97,7
|
97,6
|
97,4
|
97,7
|
98,7
|
100,0
|
100,4
|
99,1
|
98,7
|
98,9
|
99,0
|
|
2010.
|
99,4
|
99,6
|
99,4
|
99,0
|
99,5
|
100,6
|
101,9
|
102,1
|
100,1
|
99,6
|
99,5
|
99,3
|
|
2011.
|
99,5
|
99,7
|
99,6
|
99,8
|
99,6
|
100,3
|
101,1
|
100,8
|
99,1
|
98,8
|
98,7
|
98,3
|
|
2012.
|
98,2
|
98,3
|
99,5
|
99,7
|
100,2
|
100,8
|
101,2
|
101,3
|
100,7
|
101,0
|
100,6
|
100,2
|
|
2013.
|
100,9
|
101,0
|
101,0
|
101,2
|
100,8
|
|
|
|
|
|
|
|
5. MJESEČNI
INDEKSI POTROŠAČKIH CIJENA, UKUPNO
MONTHLY CONSUMER PRICE INDICES,
TOTAL
|
|
I.
|
II.
|
III.
|
IV.
|
V.
|
VI.
|
VII.
|
VIII.
|
IX.
|
X.
|
XI.
|
XII.
|
|
|
|
|
|
|
|
|
|
|
|
|
|
|
|
Prethodni
mjesec = 100
Previous
month = 100
|
|
|
|
|
|
|
|
|
|
|
|
|
|
|
|
2000.
|
100,9
|
100,5
|
100,5
|
100,5
|
100,4
|
101,0
|
100,6
|
99,8
|
100,4
|
100,2
|
100,2
|
100,4
|
|
2001.
|
100,2
|
100,5
|
99,8
|
101,4
|
100,9
|
99,8
|
99,0
|
100,7
|
100,2
|
99,5
|
99,9
|
100,4
|
|
2002.
|
101,0
|
99,9
|
100,0
|
100,3
|
100,5
|
99,4
|
99,7
|
99,9
|
100,4
|
100,2
|
100,2
|
100,4
|
|
2003.
|
100,5
|
100,2
|
100,5
|
99,7
|
100,3
|
99,6
|
100,1
|
100,1
|
100,2
|
100,0
|
100,2
|
100,3
|
|
2004.
|
101,0
|
99,9
|
100,1
|
100,2
|
100,7
|
99,7
|
99,6
|
100,1
|
99,8
|
100,4
|
100,5
|
100,7
|
|
2005.
|
100,3
|
101,1
|
100,7
|
99,8
|
100,0
|
99,9
|
99,8
|
100,1
|
100,5
|
100,7
|
100,2
|
100,5
|
|
2006.
|
100,6
|
100,8
|
100,1
|
100,2
|
100,5
|
99,9
|
99,2
|
100,1
|
100,0
|
100,0
|
100,6
|
100,0
|
|
2007.
|
100,3
|
100,3
|
100,6
|
100,7
|
100,5
|
99,6
|
99,4
|
100,6
|
101,2
|
100,3
|
101,0
|
101,2
|
|
2008.
|
100,7
|
99,9
|
100,6
|
100,7
|
101,1
|
100,7
|
100,1
|
99,7
|
100,2
|
99,9
|
99,9
|
99,4
|
|
2009.
|
101,2
|
100,6
|
100,2
|
100,8
|
100,0
|
100,1
|
99,3
|
99,9
|
99,8
|
100,1
|
100,4
|
99,4
|
|
2010.
|
100,5
|
100,2
|
100,4
|
100,4
|
100,2
|
99,9
|
99,6
|
99,8
|
100,3
|
100,1
|
100,3
|
100,0
|
|
2011.
|
100,6
|
100,5
|
100,8
|
100,2
|
100,3
|
99,5
|
99,5
|
99,9
|
100,4
|
100,6
|
100,2
|
99,6
|
|
2012.
|
99,6
|
100,6
|
101,5
|
100,8
|
101,7
|
99,4
|
99,0
|
100,5
|
101,4
|
100,4
|
99,8
|
99,9
|
|
2013.
|
100,1
|
100,3
|
100,3
|
100,4
|
100,0
|
|
|
|
|
|
|
|
|
|
|
|
|
Isti
mjesec prethodne godine = 100
Same
month of previous year = 100
|
|
|
|
|
|
|
|
|
|
|
|
|
|
|
|
2000.
|
103,7
|
103,8
|
104,0
|
104,3
|
103,5
|
104,7
|
104,8
|
104,9
|
105,2
|
105,2
|
105,8
|
105,5
|
|
2001.
|
104,8
|
104,8
|
104,1
|
105,0
|
105,5
|
104,3
|
102,6
|
103,5
|
103,3
|
102,6
|
102,3
|
102,4
|
|
2002.
|
103,2
|
102,5
|
102,7
|
101,6
|
101,2
|
100,8
|
101,5
|
100,7
|
100,9
|
101,6
|
101,8
|
101,8
|
|
2003.
|
101,4
|
101,7
|
102,2
|
101,6
|
101,4
|
101,5
|
102,0
|
102,2
|
101,9
|
101,8
|
101,8
|
101,7
|
|
2004.
|
102,1
|
101,8
|
101,4
|
101,9
|
102,4
|
102,5
|
101,9
|
102,0
|
101,6
|
102,0
|
102,3
|
102,7
|
|
2005.
|
102,0
|
103,3
|
103,9
|
103,5
|
102,8
|
102,9
|
103,1
|
103,1
|
103,8
|
104,1
|
103,8
|
103,6
|
|
2006.
|
103,9
|
103,6
|
103,0
|
103,5
|
104,0
|
104,0
|
103,4
|
103,4
|
102,8
|
102,1
|
102,5
|
102,0
|
|
2007.
|
101,8
|
101,2
|
101,8
|
102,3
|
102,2
|
101,9
|
102,1
|
102,6
|
103,9
|
104,3
|
104,6
|
105,8
|
|
2008.
|
106,2
|
105,8
|
105,7
|
105,7
|
106,4
|
107,6
|
108,4
|
107,4
|
106,4
|
105,9
|
104,7
|
102,9
|
|
2009.
|
103,4
|
104,2
|
103,8
|
103,9
|
102,7
|
102,1
|
101,2
|
101,5
|
101,0
|
101,3
|
101,8
|
101,9
|
|
2010.
|
101,1
|
100,7
|
100,9
|
100,6
|
100,8
|
100,7
|
101,0
|
100,9
|
101,4
|
101,4
|
101,2
|
101,8
|
|
2011.
|
101,9
|
102,2
|
102,6
|
102,4
|
102,5
|
102,0
|
101,9
|
102,0
|
102,2
|
102,6
|
102,6
|
102,1
|
|
2012.
|
101,2
|
101,3
|
102,0
|
102,6
|
103,9
|
103,8
|
103,4
|
104,0
|
105,0
|
104,8
|
104,4
|
104,7
|
|
2013.
|
105,2
|
104,9
|
103,7
|
103,3
|
101,6
|
|
|
|
|
|
|
|
|
|
|
|
|
Dvanaestomjesečni
prosjek
Twelve-month
average
|
|
|
|
|
|
|
|
|
|
|
|
|
|
|
|
2000.
|
104,0
|
104,0
|
104,0
|
104,0
|
104,0
|
104,1
|
104,1
|
104,2
|
104,2
|
104,3
|
104,5
|
104,6
|
|
2001.
|
104,7
|
104,8
|
104,8
|
104,9
|
105,0
|
105,0
|
104,8
|
104,7
|
104,5
|
104,3
|
104,0
|
103,8
|
|
2002.
|
103,6
|
103,4
|
103,3
|
103,0
|
102,7
|
102,4
|
102,3
|
102,1
|
101,9
|
101,8
|
101,7
|
101,7
|
|
2003.
|
101,5
|
101,5
|
101,4
|
101,4
|
101,4
|
101,5
|
101,6
|
101,7
|
101,8
|
101,8
|
101,8
|
101,8
|
|
2004.
|
101,8
|
101,8
|
101,8
|
101,8
|
101,9
|
102,0
|
102,0
|
101,9
|
101,9
|
101,9
|
102,0
|
102,1
|
|
2005.
|
102,0
|
102,2
|
102,4
|
102,5
|
102,5
|
102,6
|
102,7
|
102,8
|
102,9
|
103,1
|
103,2
|
103,3
|
|
2006.
|
103,5
|
103,5
|
103,4
|
103,4
|
103,5
|
103,6
|
103,7
|
103,7
|
103,6
|
103,4
|
103,3
|
103,2
|
|
2007.
|
103,0
|
102,8
|
102,7
|
102,6
|
102,5
|
102,3
|
102,2
|
102,1
|
102,2
|
102,4
|
102,6
|
102,9
|
|
2008.
|
103,3
|
103,6
|
104,0
|
104,3
|
104,6
|
105,1
|
105,6
|
106,0
|
106,2
|
106,3
|
106,3
|
106,1
|
|
2009.
|
105,8
|
105,7
|
105,5
|
105,4
|
105,1
|
104,6
|
104,0
|
103,5
|
103,1
|
102,7
|
102,5
|
102,4
|
|
2010.
|
102,2
|
101,9
|
101,7
|
101,4
|
101,2
|
101,1
|
101,1
|
101,1
|
101,1
|
101,1
|
101,1
|
101,1
|
|
2011.
|
101,1
|
101,2
|
101,4
|
101,5
|
101,7
|
101,8
|
101,9
|
102,0
|
102,0
|
102,1
|
102,2
|
102,3
|
|
2012.
|
102,2
|
102,1
|
102,1
|
102,1
|
102,2
|
102,4
|
102,5
|
102,6
|
102,9
|
103,1
|
103,2
|
103,4
|
|
2013.
|
103,8
|
104,1
|
104,2
|
104,3
|
104,0
|
|
|
|
|
|
|
|
6. HARMONIZIRANI
INDEKS POTROŠAČKIH CIJENA U EU U TRAVNJU 2013.1)
HARMONISED
CONSUMER PRICE INDEX IN EU, APRIL 20131)
|
|
|
|
|
(nastavak)
(continued)
|
|
|
|
|
IV. 2013.
IV. 2012.
|
|
|
|
IV. 2013.
IV. 2012.
|
|
|
|
|
|
|
|
|
|
|
Područje eura2)
|
1,23)
|
Euro
area (MUICP)2)
|
|
EU
(EICP)4)
|
1,43)
|
EU
(EICP)4)
|
|
Belgija
|
1,1
|
Belgium
(BE)
|
|
Bugarska
|
0,9
|
Bulgaria
(BG)
|
|
Njemačka
|
1,1
|
Germany
(DE)
|
|
Češka
|
1,7
|
Czech
Republic (CZ)
|
|
Estonija
|
3,4
|
Estonia
(EE)
|
|
Danska
|
0,4
|
Denmark
(DK)
|
|
Irska
|
0,5
|
Ireland
(IE)
|
|
Letonija
|
-0,4
|
Latvia
(LV)
|
|
Grčka
|
-0,6
|
Greece
(EL)
|
|
Litva
|
1,4
|
Lithuania
(LT)
|
|
Španjolska
|
1,5
|
Spain
(ES)
|
|
Mađarska
|
1,8
|
Hungary
(HU)
|
|
Francuska
|
0,8
|
France
(FR)
|
|
Poljska
|
0,8
|
Poland
(PL)
|
|
Italija
|
1,3
|
Italy
(IT)
|
|
Rumunjska
|
4,4
|
Romania
(RO)
|
|
Cipar
|
0,1
|
Cyprus
(CY)
|
|
Švedska
|
0,0
|
Sweden
(SE)
|
|
Luksemburg
|
1,7
|
Luxembourg
(LU)
|
|
Ujedinjena
Kraljevina
|
…
|
United
Kingdom (UK)
|
|
Malta
|
0,9
|
Malta
(MT)
|
|
HRVATSKA5)
|
3,1
|
CROATIA5)
|
|
Nizozemska
|
2,8
|
Netherlands
(NL)
|
|
|
|
|
|
Austrija
|
2,13)
|
Austria
(AT)
|
|
|
|
|
|
Portugal
|
0,4
|
Portugal
(PT)
|
|
|
|
|
|
Slovenija
|
1,6
|
Slovenia
(SI)
|
|
|
|
|
|
Slovačka
|
1,7
|
Slovakia
(SK)
|
|
|
|
|
|
Finska
|
2,4
|
Finland
(FI)
|
|
|
|
|
1) Izvor:
Eurostat, europokazatelji, priopćenje
za travanj 2013., br. 75/2013., 16. svibnja 2013.
2) Indeks
potrošačkih
cijena Monetarne unije (MUICP) – samo zemalja članica
EU-a
3) Privremeni
podatak
4) Indeks
potrošačkih cijena (EICP) zemalja područja eura i ostalih članica EU-a
5) Radi
usporedivosti sa zemljama Europske unije, daje se i podatak usklađenog
indeksa potrošačkih cijena za Hrvatsku (HICP).
1) Source:
Eurostat, Euro-indicators, news release for April 2013, No. 75/2013 of 16 May
2013
2) Monetary
Union Index of Consumer Prices (MUICP) –
only EU Member States
3) Provisional
data
4) European
Index of Consumer Prices (EICP) for the euro-area
countries and other EU Member States
5) In
order to achieve comparability with the EU countries, data on the Croatian
Harmonised Index of Consumer Prices (HICP) have also been given.
|
METODOLOŠKA OBJAŠNJENJA
|
|
NOTES ON METHODOLOGY
|
|
|
|
|
|
Definicija indeksa potrošačkih
cijena
|
|
Definition of the consumer price
index (CPI)
|
|
|
|
|
|
Indeks
potrošačkih cijena odražava promjene u razini cijena dobara i usluga koje u
tijeku vremena nabavlja, koristi se njima ili plaća referentno stanovništvo
(privatna kućanstva) radi potrošnje.
|
|
The
consumer price index (CPI) measures changes in prices of goods and services
acquired, used or paid over time by a reference population (private
households) for consumption purposes.
|
|
|
|
|
|
|
|
|
Namjena
|
|
Purpose
|
|
|
|
|
|
Indeks potrošačkih cijena može imati različite
namjene i služiti za mjerenje inflacije, očuvanje vrijednosti kod ugovora s
indeksnim klauzulama (npr. za indeksiranje plaća u kolektivnim ugovorima,
indeksiranje mirovina i slično), omogućuje usporedbu kretanja stope
inflacije s drugim zemljama, usporedbu kretanja cijena unutar zemlje između
određenih gospodarskih sektora, može služiti kao osnova za deflacioniranje
pojedinih kategorija nacionalnih računa i drugih statističkih serija te se
primjenjuje za analitičke svrhe.
|
|
The CPI
can be used for various purposes. It can be used as a measure of inflation,
it can serve to guarantee the value of recurrent payments in escalator
clauses for contractual relationships (for example, the CPI can serve for
indexing wages and salaries in collective agreements, for indexing pensions
etc.), it enables a comparison of inflation in the country with inflation
in other countries as well as a comparison of price movements within a
particular country between different economy sectors, it can serve as a
basis for deflating national accounts data and other statistical series and
can be used for analytical purposes.
|
|
|
|
|
|
|
Indeks
potrošačkih cijena u Republici Hrvatskoj
|
|
The CPI
in the Republic of Croatia
|
|
|
|
|
|
Indeks potrošačkih cijena u Republici Hrvatskoj
izračunava se na temelju reprezentativne košarice koju čini oko 794 proizvoda. Svakog mjeseca prikuplja se oko 36 110 cijena na unaprijed definiranu uzorku
prodajnih mjesta na devet geografskih lokacija.
|
|
The CPI
in the Republic of Croatia is calculated on the basis of a representative
basket consisting of about 794 different
items. About 36 110 prices are
collected each month in a fixed panel of outlets in nine geographical
locations.
|
|
|
|
|
|
|
Obuhvat
indeksa
|
|
Scope
of the index
|
|
|
|
|
|
Obuhvat
stanovništva. Obuhvaćena su ukupna privatna kućanstva na domaćem
teritoriju bez obzira na rezidentnost, tip naselja u kojem se nalaze,
njihovu poziciju u raspodjeli dohotka te njihova etnička i demografska
obilježja.
|
|
Population
coverage. All private households in the country,
regardless of residency, type of settlements, position in income
distribution or their ethnic and demographic characteristics, are covered.
|
|
|
|
|
|
Geografski
obuhvat. Ponderi obuhvaćaju cijeli teritorij Republike
Hrvatske. Cijene se prikupljaju na devet lokacija (gradova) u zemlji
(Zagreb, Slavonski Brod, Osijek, Sisak, Rijeka, Pula, Split, Dubrovnik i
Varaždin) odabranih prema kriteriju broja stanovnika i reprezentativnosti
za pojedinu statističku regiju.
|
|
Geographic
coverage. Weight structure covers the whole
territory of the Republic of Croatia. Pricing takes place in nine locations
(cities and towns) throughout the country (Zagreb, Slavonski Brod, Osijek,
Sisak, Rijeka, Pula, Split, Dubrovnik and Varaždin), sampled on the basis
of the size of population and the representativeness for the specific
statistical region.
|
|
|
|
|
Obuhvat
proizvoda. Obuhvaćena su sva dobra i usluge koje kupuje
referentno stanovništvo radi finalne potrošnje. Nisu obuhvaćeni: imputirana
stambena renta, izdaci za kupnju stambenih objekata i zemljišta te ostale
investicije, izdaci za igre na sreću i usluge životnog osiguranja. Obuhvat
dobara i usluga redovito se revidira kako bi se očuvala reprezentativnost
košarice proizvoda s obzirom na ukuse potrošača i njihove navike u pogledu
kupnje. Proizvodi se obvezatno uključuju u izračunavanje indeksa
potrošačkih cijena ako je njihov udio u ukupnim izdacima referentnog
stanovništva veći od 1/1000.
|
|
Product
coverage. All goods and services bought by the
reference population for the purpose of final consumption are included in
the index. Imputed rents, expenditures on dwelling or land and other gross
fixed capital formation, expenditures on lotteries and gambling and life
insurance are not included. The coverage of goods and services is reviewed
regularly in order to ensure the representativeness of the basket with
respect to the consumer tastes and purchasing practices. Products have to
be included in the calculation of index once its expenditure share exceeds
1/1000 of the total expenditures of the reference population.
|
|
|
|
|
|
|
Snimanje
cijena
|
|
Price
collection
|
|
|
|
|
|
Većina cijena snima se lokalno, a centralno se
prikupljaju cijene državnih monopola i nacionalno homogene cijene. Za
proizvode čije se cijene snimaju lokalno, snimatelji od Državnog zavoda za
statistiku dobivaju labave specifikacije i u početku samostalno izabiru
konkretan proizvod čiju će cijenu snimiti na prodajnome mjestu. Kako bi se
osiguralo da snimatelji iz mjeseca u mjesec snimaju cijene istih proizvoda
te kako bi se moglo pratiti koje proizvode izabiru na terenu, snimatelji
bilježe i unaprijed definiran skup dodatnih obilježja proizvoda. Takav
način snimanja omogućuje praćenje promjene kretanja cijena između dvaju
razdoblja, ali ne i usporedbu prosječnih cijena između različitih
geografskih lokacija.
|
|
Most
prices are collected locally, and central price collection is applied in
cases of state monopolies and nationally homogeneous prices. For products
for which prices are collected locally, the Croatian Bureau of Statistics
supplies loose specifications to price collectors and collectors are free
to initially select particular product for pricing in a particular outlet.
In order to make sure that the same products are then re-priced each month,
as well as to monitor which products are selected for pricing, the price collectors
also record a pre-defined set of additional product characteristics. Such a
method of price collection enables the monitoring of price change between
two periods, but not the comparison of average prices between different
geographic locations.
|
|
|
|
|
|
Za
potrebe indeksa potrošačkih cijena cijene se snimaju sljedećih dana u
mjesecu:
|
|
For the purposes of the consumer price index, prices
are recorded on the following days of the month:
|
|
|
|
-
|
za
poljoprivredne proizvode koji se prodaju na tržnicama trećeg petka u
mjesecu
|
|
-
|
for
agricultural products sold in market places, on the third Friday in a month
|
|
|
|
|
|
-
|
za prehrambene
proizvode u razdoblju od 18. do 23. u mjesecu
|
|
-
|
for
food products, from 18th to 23rd in a month
|
|
|
|
|
|
-
|
za industrijske
neprehrambene proizvode u razdoblju od 13. do 20. u mjesecu
|
|
-
|
for
industrial non-food products, from 13th to 20th in a
month
|
-
|
za usluge u
razdoblju od 16. do 18. u mjesecu
|
|
-
|
for
services, from 16th to 18th in a month
|
|
|
|
|
|
-
|
za goriva za
osobne automobile u razdoblju od 24. prethodnog mjeseca do 25. tekućeg
mjeseca.
|
|
-
|
for
fuel for passenger cars, from 24th of a previous month to 25th
of a current month.
|
|
|
|
|
|
|
Ponder
|
|
Weights
|
|
|
|
|
|
Ponderi
koji se primjenjuju za izračunavanje indeksa potrošačkih cijena odražavaju
relativnu važnost odabranih dobara i usluga u ukupnoj potrošnji rezidentnih
kućanstava na domaćem teritoriju.
|
|
Weights used for calculating the CPI reflect relative importance
of the sampled goods or services in the total consumption of resident households
within the domestic territory.
|
|
|
|
|
|
Osnovni
izvor podataka za izradu pondera za obračun indeksa potrošačkih cijena jest
Anketa o potrošnji kućanstava, koju Državni zavod za statistiku redovito
provodi od 1998. Taj izvor podataka nadopunjen je podacima o trgovini na
malo te podacima iz godišnjih statističkih izvješća Financijske agencije.
Za izračunavanje indeksa potrošačkih cijena od siječnja 2013. primjenjuju
se ponderi koji se temelje na godišnjem prosjeku potrošnje kućanstava iz
Ankete o potrošnji kućanstava od 2011., preračunani na cijene u prosincu
2012.
|
|
The most important data sources for calculating the weights used
in the consumer price indices are the Household Budget Survey, conducted on
a regular basis by the Croatian Bureau of Statistics since 1998. Data
collected by these surveys are supplemented with retail sales data and
annual statistical and financial reports, gathered and published by the
Financial Agency. Since January 2013, the compilation of the CPIs has been
based on the weights derived from annual average household expenditures
from the 2011 Household Budget Survey, recalculated into prices in December
2012.
|
|
|
|
|
|
|
Klasifikacija
|
|
Classification
|
|
|
|
|
|
Za klasificiranje proizvoda iz indeksa potrošačkih
cijena upotrebljava se Klasifikacija osobne potrošnje prema namjeni (Classification
of Individual Consumption by Purpose, COICOP). Ta klasifikacija dijeli
izdatke na dvanaest osnovnih odjeljaka dobara i usluga.
|
|
The
classification of products used in the CPI is based on the Classification
of Individual Consumption by Purpose (COICOP). The COICOP breaks consumer
expenditure into 12 different divisions of consumer goods and services.
|
|
|
|
|
|
|
Agregiranje
|
|
Aggregation
|
|
|
|
|
|
Izračunavanje
indeksa potrošačkih cijena počinje izračunavanjem indeksa elementarnih
agregata.
|
|
The calculation of the CPI begins with the
computation of elementary aggregate indices.
|
|
|
|
|
|
Indeks elementarnog agregata izračunava se kao
odnos srednjih vrijednosti cijena tekućeg i referentnog razdoblja za
cijene, pri čemu se kao mjera srednje vrijednosti primjenjuje geometrijska
sredina.
|
|
Elementary aggregate indices are calculated as a
ratio of geometric means of the current and the price reference period of
all prices of products within an elementary aggregate.
|
|
|
|
|
|
Indeks potrošačkih cijena izračunava se korištenjem
formule za vaganu aritmetičku sredinu indeksa na nižoj razini agregacije.
|
|
Consumer price indices are then compiled by using
the formula for the weighted arithmetic mean of the indices at the lower
aggregation levels.
|
|
|
|
|
|
|
|
|
|
Sezonski proizvodi
|
|
Treatment of seasonal products
|
|
|
|
|
|
Pri
izračunavanju indeksa za sezonske proizvode primjenjuje se Uredba Komisije
br. 330/2009. od 22. travnja 2009. (minimalni standardi za sezonske
proizvode).
|
|
In
calculating the index for seasonal products, the Commission Regulation (EC)
No 330/2009 of 22 April 2009 (minimum standards for the seasonal products)
is applied.
|
|
|
|
|
Ostale
definicije
|
|
Other
important definitions
|
|
|
|
|
|
Harmonizirani indeks potrošačkih cijena (HICP) jest ekonomski pokazatelj koji mjeri
promjenu cijena dobara i usluga koje tijekom vremena nabavljaju, koriste
ili plaćaju kućanstva te kao takav predstavlja skupinu europskih indeksa
potrošačkih cijena izračunanih prema harmoniziranom pristupu i posebnom
setu definicija koji omogućuje usporedivu mjeru inflacije u eurozoni,
Europskoj uniji, Europskome ekonomskom području te za zemlje kandidate.
Razlika u odnosu na indeks potrošačkih cijena je u obuhvatu stanovništva i
izvorima za ponderacijsku strukturu.
|
|
Harmonised
Consumer Price Index (HICP) is an economic indicator that
measures the change in prices of goods and services acquired, used or paid
by households over time. As such, it represents a group of European
consumer price indices calculated according to the harmonised approach and
a separate set of definitions that provides for a comparable measure of
inflation in the euro area, the European Union, the European Economic Area
and the candidate countries. It differs from the Consumer Price Index in
the population coverage and resources of the weighting structure.
|
|
|
|
|
|
Elementarni agregati jesu proizvodi na najnižoj razini agregacije,
odnosno proizvodi u svim prodajnim mjestima na jednoj geografskoj lokaciji.
Proizvodima iz elementarnog agregata ne može se dodijeliti ponder jer za to
ne postoje odgovarajući podaci.
|
|
Elementary
aggregates are products at the lowest
aggregation level, that is, products in all outlets on one geographical
location. Data required for the estimation of weights are typically not
available within an elementary aggregate.
|
|
|
|
|
|
Proizvod je bilo koje dobro ili usluga za potrošnju koja
se može kupiti; skupni naziv za dobra i usluge.
|
|
Products
areall consumer goods or services that can be
purchased; the term covers both goods and services.
|
|
|
|
|
|
Dobra su svi proizvodi osim usluga.
|
|
Goods are products excluding services.
|
|
|
|
|
|
Iz usluga je, prema Eurostatovim preporukama,
isključena voda za kućanstvo i uključena u dobra. Stoga su indeksi za dobra
i usluge preračunani od siječnja 2005. do prosinca 2008. (tablice 3. i 4.).
|
|
Following
Eurostat’s recommendations, water supply has been excluded from Services
category and included into Goods category. As a consequence, indices for
goods and services have been recalculated for the period from January 2005
to December 2008 (tables 3. and 4.).
|
|
|
|
|
|
Usluge čine popravak i čišćenje odjeće i obuće, usluge
za redovito održavanje i popravke u stanu, popravak kućanskih aparata,
održavanje i popravci osobnih vozila, ostale usluge vezane za prometna
sredstva, prometne usluge, popravak opreme za rekreaciju i kulturu i usluge
rekreacije i kulture, ugostiteljske usluge, usluge osobne njege, osiguranje
vezano za stanovanje i transport te ostale usluge, d. n.
|
|
Services
includecleaning and repairs of clothing and
footwear, maintenance and repair of the dwelling, repair and making of furniture, repair of
household appliances, operation of personal transport equipment and other
services, transport services, repair of the recreational equipment and
recreational and cultural services, catering services, services for
personal care, insurance of the transport and housing, other services
n.e.c.
|
|
|
|
|
|
Energiju čine električna energija, plin, tekuća i kruta
goriva, zagrijavanje stana, goriva i maziva.
|
|
Energy includes electricity, gas, liquid and solid fuels, heat energy,
fuels and lubricants.
|
|
|
|
|
|
Zbog posebnih potreba korisnika tablica 2.
proširena je za tri dodatne skupine indeksa: indeks ukupno bez energije,
prehrane, pića i duhana, indeks ukupno bez energije i neprerađenih prehrambenih
proizvoda i indeks dobara bez električne energije i vode.
|
|
In order
to meet specific consumers’ needs, table 2. has been extended with
additional groups of indices: the index of Total without energy, food,
beverages and tobacco, the index of Total without energy and unprocessed
food and the index of Goods without electricity and water supply.
|
|
|
|
|
|
|
|
|
|
Kratice
|
|
Abbreviations
|
|
|
|
|
|
COICOP
|
Klasifikacija osobne potrošnje prema namjeni
|
|
COICOP
|
Classification
of Individual Consumption by Purpose
|
|
d. n.
|
drugdje nespomenuto
|
|
etc.
|
and so on
(from Latin: et cetera)
|
|
EU
|
Europska unija
|
|
EU
|
European
Union
|
|
Eurostat
|
Statistički ured Europske unije
|
|
Eurostat
|
Statistical
Office of the European Communities
|
|
npr.
|
na primjer
|
|
n. e. c.
|
not elsewhere
classified
|
|
tj.
|
to jest
|
|
|
|
|
|
|
|
|
Znakovi
|
|
Symbols
|
|
|
|
|
|
-
|
nema pojave
|
|
-
|
no occurrence
|
|
…
|
ne raspolaže se podatkom
|
|
…
|
no data available
|
|
|
|
|
|
|
|
|
|
|
|
|
|
|
|
Izdaje i
tiska Državni zavod za statistiku Republike Hrvatske, Zagreb, Ilica 3, p. p.
80.
Published and printed by the Croatian Bureau of Statistics, Zagreb,
Ilica 3, P. O. B. 80
Telefon/ Phone:
+385 (0) 1 4806-111, telefaks/ Fax: +385 (0) 1 4817-666
Odgovara
ravnatelj Marko Krištof.
Person
responsible: Marko Krištof, Director General
Priredile:
Sanja Jurleka, Jasminka Stančić, Snježana Strukar i Stanka Radoš-Kordić
Prepared
by: Sanja Jurleka, Jasminka Stančić, Snježana Strukar and Stanka Radoš-Kordić
|
|
MOLIMO
KORISNIKE DA PRI KORIŠTENJU PODATAKA NAVEDU IZVOR.
USERS
ARE KINDLY REQUESTED TO STATE THE SOURCE
|
|
Naklada:
20 primjeraka
20 copies
printed
Podaci iz
ovog priopćenja objavljuju se i na internetu.
First Release data are also published on the
Internet.
|