|

GODINA/ YEAR: LI.
ZAGREB, 10. LIPNJA 2014./ 10 JUNE, 2014
BROJ/ NUMBER: 12.1.4.
GODIŠNJI
BRUTO DOMAĆI PROIZVOD ZA 2012.
ANNUAL GROSS DOMESTIC PRODUCT FOR 2012
|
U ovom priopćenju objavljuje se vremenska serija
podataka o bruto domaćem proizvodu (BDP) i temeljnim agregatima nacionalnih
računa prema Nacionalnoj klasifikaciji djelatnosti 2007. (NKD 2007.) i
prema kategorijama izdataka.
|
|
This release presents the time series of data on
gross domestic product (GDP) and main aggregates of national accounts
according to the National Classification of Activities, 2007 version (NKD
2007.), and by major categories of expenditure.
|
|
|
|
|
|
U priopćenju su prikazani podaci za 2012. U
tablicama priloženima u Excel-formatu nalazi se serija podataka od 1995. do
2012. Podaci su dostupni u tekućim cijenama, stalnim cijenama prethodne
godine te u stalnim cijenama referentne godine (2005. = 100).
|
|
The release presents the data for 2012. Attached
excel tables present data series for the period from 1995 to 2012. The data
are presented at current prices, constant prices of a previous year and
constant prices of a reference year (2005 = 100).
|
|
|
|
|
|
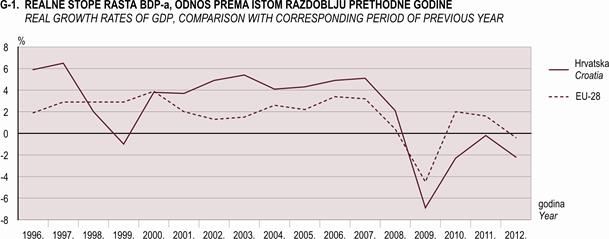
Bruto domaći proizvod realno je manji za 2,2% u
2012. u odnosu na 2011.
|
|
The gross domestic product decreased in 2012 by
2.2% in real terms, as compared to 2011.
|
|
|
|
|
|
Na realni pad bruto domaćeg proizvoda najviše je
utjecao pad bruto dodane vrijednosti u djelatnostima Poljoprivrede,
šumarstva i ribarstva (za 14,7%) i Građevinarstva (za 11,6%) dok je
pozitivan doprinos stopi rasta najviše dala Djelatnost pružanja smještaja
te priprema i usluživanja hrane (2,9%).
|
|
The decrease of the gross domestic product in real
terms was mainly due to the decrease in the gross value added in
Agriculture, forestry and fishing (14.7%) and Construction (11.6%), while
the largest positive contribution to the growth rate was given mainly by
the Accommodation
and food service activities (2.9%).
|
|
|
|
|
|
Podatke iz ovog priopćenja možete
preuzeti na www.dzs.hr.
|
|
Data from this
release can be downloaded at www.dzs.hr
|
|
Ovdje možete preuzeti tablice iz ovog
priopćenja u Excel- formatu.
Ovdje možete preuzeti Metodološka
objašnjenja iz ovog priopćenja.
|
|
Excel tables from this release can be
downloaded here.
Notes on methodology from
this release can be downloaded here.
|
|
|
|
|
|
|
|
|
|
Izdaci za potrošnju kućanstava pali su za 3,0%.
Izdaci za potrošnju neprofitnih ustanova koje služe kućanstvima (NPUSK)
pali su za 4,2%. Izdaci za potrošnju države pali su za 0,8%. Pad bruto
investicija u fiksni kapital iznosio je 3,1%. Izvoz roba i usluga porastao
je za 0,3%, dok je uvoz roba i usluga pao za 2,4%.
|
|
The final consumption expenditure of households
decreased by 3.0%. The final consumption expenditure of non-profit
institutions serving households (NPISH) decreased by 4.2%. The final
consumption expenditure of general government decreased by 0.8%. The
decrease of the gross fixed capital formation was 3.1%. The exports of
goods and services increased by 0.3%, while the imports of goods and
services decreased by 2.4%.
|
|
|
|
|
|
Doprinos domaće potražnje ostvarenoj stopi realnog
pada BDP-a bio je negativan (3,3 indeksna boda). Doprinos neto inozemne
potražnje bio je pozitivan (1,1 indeksna boda).
|
|
The contribution of the domestic demand to GDP
growth rate was negative (3.3 basic points). The contribution of the net
foreign demand was positive (1.1 basic points).
|
|
|
|
|
|
Najveći pozitivan doprinos promjeni obujma bruto
domaćeg proizvoda u 2012. ostvaren je manjim uvozom roba i usluga, dok je
najveći doprinos smanjenju obujma ostvaren smanjenjem izdataka za konačnu
potrošnju kućanstava.
|
|
The largest positive contribution to the gross
domestic product volume changes for 2012 was realised by the imports of
goods and services, while the largest contribution to the decrease in the
volume was realised by the households final consumption expenditure.
|
|
|
|
|
|
Bruto nacionalni dohodak (BND) u cijelom je
razdoblju od 1995. do 2012. (osim u 1997.) manji od BDP-a, što pokazuje
veći odljev primarnih dohodaka iz Republike Hrvatske nego njihovih priljeva
u Republiku Hrvatsku.
|
|
The gross national income (GNI) was lower than GDP
in the whole period from 1995 to 2012 (except for 1997), indicating a
higher outflow of primary incomes from the Republic of Croatia than their
inflow into the Republic of Croatia.
|
|
|
|
|
|
Serija revidiranoga tromjesečnog BDP-a za
razdoblje od prvog tromjesečja 2012. do četvrtog tromjesečja 2013. objavit
će se 10. lipnja 2014. u redovitom priopćenju (Priopćenje br. 12.1.1/1.)
zajedno s procjenom obračuna BDP-a za prvo tromjesečje 2014.
|
|
The revised quarterly GDP series for the period
from the first quarter of 2012 to the fourth quarter of 2013 will be
published on 10 June 2014 in the regular release (first release No.
12.1.1/1.) together with the quarterly GDP estimate for the first quarter
of 2014.
|
1.1.
BRUTO DOMAĆI PROIZVOD GODIŠNJI OBRAČUN, 2005. – 2012.
GROSS DOMESTIC
PRODUCT, ANNUAL CALCULATION, 2005 – 2012
|
|
2005.
|
2006.
|
2007.
|
2008.
|
2009.
|
2010.
|
2011.
|
2012.
|
|
|
|
|
|
|
|
|
|
|
|
|
|
Bruto
domaći proizvod,
tržišne cijene (tekuće),
mil. kuna
|
266 652
|
291 044
|
318 308
|
343 412
|
328 672
|
323 807
|
328 737
|
327 021
|
Gross
domestic product, market prices (current),
mln kuna
|
|
Bruto
domaći proizvod,
tržišne cijene (tekuće),
mil. USD
|
44 816
|
49 843
|
59 319
|
69 595
|
62 244
|
58 874
|
61 521
|
55 893
|
Gross
domestic product, market prices (current),
mln US $
|
|
Bruto
domaći proizvod,
tržišne cijene (tekuće),
mil. EUR
|
36 034
|
39 745
|
43 390
|
47 543
|
44 781
|
44 441
|
44 220
|
43 502
|
Gross
domestic product, market prices (current),
mln EUR
|
|
Stanovništvo,
godišnji
prosjek broja stanovnika,
tis.1)
|
4 312
|
4 313
|
4 313
|
4 311
|
4 306
|
4 296
|
4 283
|
4 269
|
Population,
the annual
average of the total
population, '0001)
|
|
Bruto
domaći proizvod
po stanovniku, kune
|
61 844
|
67 481
|
73 806
|
79 662
|
76 323
|
75 368
|
76 755
|
76 602
|
Gross
domestic product
per capita, kuna
|
|
Bruto
domaći proizvod po stanovniku, USD
|
10 394
|
11 557
|
13 754
|
16 144
|
14 454
|
13 703
|
14 364
|
13 093
|
Gross
domestic product
per capita, US $
|
|
Bruto
domaći proizvod po stanovniku, EUR
|
8 357
|
9 215
|
10 061
|
11 029
|
10 399
|
10 344
|
10 325
|
10 190
|
Gross
domestic product
per capita, EUR
|
|
Prosječni
godišnji tečaj HRK/USD2)
|
5,949959
|
5,839170
|
5,365993
|
4,934417
|
5,280370
|
5,500015
|
5,343508
|
5,850861
|
Average
annual exchange rate HRK/US $2)
|
|
Prosječni
godišnji tečaj HRK/EUR2)
|
7,400047
|
7,322849
|
7,336019
|
7,223178
|
7,339554
|
7,286230
|
7,434204
|
7,517340
|
Average
annual exchange rate HRK/EUR2)
|
|
Realne
stope rasta (%)
|
4,3
|
4,9
|
5,1
|
2,1
|
-6,9
|
-2,3
|
-0,2
|
-2,2
|
Real
growth rate (%)
|
|
Implicitni
deflatori BDP-a
|
103,3
|
104,0
|
104,1
|
105,7
|
102,9
|
100,8
|
101,8
|
101,7
|
Implicite
GDP deflator
|
1) Vidi Metodološka objašnjenja.
2) Izvor: HNB,
Bilten, Statistički pregled, broj 203 – svibanj 2014., tablica H9: Godišnji i
mjesečni prosjeci srednjih deviznih tečajeva Hrvatske narodne banke
1)
See Notes on Methodology
2)
Source: CNB, Bulletin, Statistical Survey, No.
203 – May 2014, Table H9: Midpoint Exchange Rates of the Croatian National
Bank (period average)
1.2. BRUTO
DODANA VRIJEDNOST PO DJELATNOSTIMA I BRUTO DOMAĆI PROIZVOD, TEKUĆE CIJENE, U
2012.
GROSS VALUE
ADDED, BY ACTIVITIES AND GROSS DOMESTIC PRODUCT, CURRENT PRICES, 2012
|
|
|
Vrijednost,
mil. kuna
Value, mln kuna
|
Struktura
BDP-a, %
GDP structure, %
|
Nominalni indeksi,
prethodna godina = 100
Nominal indices,
previous year = 100
|
|
|
|
|
|
|
|
|
|
|
|
A
|
Poljoprivreda,
šumarstvo i ribarstvo
|
12 518
|
3,8
|
93,9
|
A
|
Agriculture,
forestry and fishing
|
|
B
|
Rudarstvo
i vađenje
|
2 313
|
0,7
|
102,4
|
B
|
Mining and
quarrying
|
|
C
|
Prerađivačka
industrija
|
46 617
|
14,3
|
100,2
|
C
|
Manufacturing
|
|
D
|
Opskrba
električnom energijom, plinom,
parom i klimatizacija
|
6 369
|
1,9
|
107,5
|
D
|
Electricity,
gas, steam and air conditioning supply
|
|
E
|
Opskrba
vodom; uklanjanje otpadnih
voda, gospodarenje otpadom te djelatnosti
sanacije okoliša
|
3 775
|
1,2
|
104,7
|
E
|
Water
supply; sewerage, waste management and remediation activities
|
|
F
|
Građevinarstvo
|
15 186
|
4,6
|
88,4
|
F
|
Construction
|
|
G
|
Trgovina
na veliko i na malo; popravak motornih vozila i motocikla
|
30 552
|
9,3
|
97,4
|
G
|
Wholesale
and retail trade; repair of motor
vehicles and motorcycles
|
|
H
|
Prijevoz i
skladištenje
|
12 273
|
3,8
|
93,9
|
H
|
Transportation
and storage
|
|
I
|
Djelatnosti
pružanja smještaja te pripreme
i usluživanja hrane
|
12 699
|
3,9
|
104,4
|
I
|
Accommodation
and food service activities
|
|
J
|
Informacije
i komunikacije
|
13 228
|
4,0
|
97,6
|
J
|
Information
and communication
|
|
K
|
Financijske
djelatnosti i djelatnosti
osiguranja
|
18 851
|
5,8
|
93,0
|
K
|
Financial
and insurance activities
|
|
L
|
Poslovanje
nekretninama
|
30 820
|
9,4
|
100,5
|
L
|
Real
estate activities
|
|
M
|
Stručne,
znanstvene i tehničke djelatnosti
|
14 418
|
4,4
|
98,7
|
M
|
Professional,
scientific and technical activities
|
|
N
|
Administrativne
i pomoćne uslužne
djelatnosti
|
5 922
|
1,8
|
105,8
|
N
|
Administrative
and support service activities
|
|
O
|
Javna
uprava i obrana; obvezno socijalno
osiguranje
|
17 448
|
5,3
|
98,5
|
O
|
Public
administration and defence;
compulsory social security
|
|
P
|
Obrazovanje
|
12 962
|
4,0
|
99,7
|
P
|
Education
|
|
Q
|
Djelatnosti
zdravstvene zaštite i socijalne skrbi
|
13 514
|
4,1
|
100,4
|
Q
|
Human
health and social work activities
|
|
R
|
Umjetnost,
zabava i rekreacija
|
4 254
|
1,3
|
101,9
|
R
|
Arts,
entertainment and recreation
|
|
S
|
Ostale
uslužne djelatnosti
|
2 956
|
0,9
|
104,4
|
S
|
Other
service activities
|
|
T
|
Djelatnosti
kućanstava kao poslodavaca;
djelatnosti kućanstava koja proizvode
različitu robu i pružaju različite usluge za vlastite potrebe
|
350
|
0,1
|
85,6
|
T
|
Activities
of households as employers;
undifferentiated goods – and services – producing activities of households
for own use
|
|
U
|
Djelatnosti
izvanteritorijalnih organizacija i tijela
|
-
|
-
|
-
|
U
|
Activities
of extraterritorial organisations
and bodies
|
|
|
|
|
|
|
|
|
|
Bruto dodana vrijednost (bazične cijene)
|
277 024
|
84,7
|
98,3
|
Gross
value added (basic prices)
|
|
|
|
|
|
|
|
|
|
Porezi na proizvode minus subvencije na proizvode
|
49 997
|
15,3
|
106,4
|
Taxes on
products less subsidies on products
|
|
|
|
|
|
|
|
|
|
Bruto domaći proizvod (tržišne cijene)
|
327 021
|
100,0
|
99,5
|
Gross
domestic product (market prices)
|
1.3. BRUTO
DODANA VRIJEDNOST PO DJELATNOSTIMA I BRUTO DOMAĆI PROIZVOD, STALNE CIJENE U
CIJENAMA
PRETHODNE GODINE, U 2012.
GROSS VALUE ADDED, BY
ACTIVITIES AND GROSS DOMESTIC PRODUCT, CONSTANT PRICES OF PREVIOUS YEAR, 2012
|
|
|
Vrijednost, mil. kuna
Value, mln kuna
|
Realne stope rasta, %
Volume changes, %
|
|
|
|
|
|
|
|
|
|
|
A
|
Poljoprivreda,
šumarstvo i ribarstvo
|
11 365
|
-14,7
|
A
|
Agriculture,
forestry and fishing
|
|
B
|
Rudarstvo
i vađenje
|
1 919
|
-15,0
|
B
|
Mining and
quarrying
|
|
C
|
Prerađivačka
industrija
|
44 636
|
-4,1
|
C
|
Manufacturing
|
|
D
|
Opskrba
električnom energijom, plinom,
parom i klimatizacija
|
5 596
|
-5,6
|
D
|
Electricity,
gas, steam and air conditioning supply
|
|
E
|
Opskrba
vodom; uklanjanje otpadnih
voda, gospodarenje otpadom te djelatnosti
sanacije okoliša
|
3 522
|
-2,3
|
E
|
Water
supply; sewerage, waste management
and remediation activities
|
|
F
|
Građevinarstvo
|
15 183
|
-11,6
|
F
|
Construction
|
|
G
|
Trgovina
na veliko i na malo; popravak motornih
vozila i motocikla
|
29 728
|
-5,2
|
G
|
Wholesale
and retail trade; repair of motor vehicles
and motorcycles
|
|
H
|
Prijevoz i
skladištenje
|
12 337
|
-5,6
|
H
|
Transportation
and storage
|
|
I
|
Djelatnosti
pružanja smještaja te pripreme
i usluživanja hrane
|
12 522
|
2,9
|
I
|
Accommodation
and food service activities
|
|
J
|
Informacije
i komunikacije
|
13 420
|
-1,0
|
J
|
Information
and communication
|
|
K
|
Financijske
djelatnosti i djelatnosti osiguranja
|
19 786
|
-2,4
|
K
|
Financial
and insurance activities
|
|
L
|
Poslovanje
nekretninama
|
30 820
|
0,5
|
L
|
Real
estate activities
|
|
M
|
Stručne,
znanstvene i tehničke djelatnosti
|
14 456
|
-1,0
|
M
|
Professional,
scientific and technical activities
|
|
N
|
Administrativne
i pomoćne uslužne djelatnosti
|
5 855
|
4,6
|
N
|
Administrative
and support service activities
|
|
O
|
Javna
uprava i obrana; obvezno socijalno osiguranje
|
17 875
|
0,9
|
O
|
Public
administration and defence; compulsory social security
|
|
P
|
Obrazovanje
|
13 122
|
0,9
|
P
|
Education
|
|
Q
|
Djelatnosti
zdravstvene zaštite i socijalne
skrbi
|
13 532
|
0,5
|
Q
|
Human
health and social work activities
|
|
R
|
Umjetnost,
zabava i rekreacija
|
4 208
|
0,8
|
R
|
Arts,
entertainment and recreation
|
|
S
|
Ostale
uslužne djelatnosti
|
2 858
|
0,8
|
S
|
Other
service activities
|
|
T
|
Djelatnosti
kućanstava kao poslodavaca;
djelatnosti kućanstava koje proizvode
različitu robu i pružaju različite usluge
za vlastite potrebe
|
352
|
-13,9
|
T
|
Activities
of households as employers;
undifferentiated goods – and services – producing
activities of households for own use
|
|
U
|
Djelatnosti
izvanteritorijalnih organizacija i tijela
|
-
|
-
|
U
|
Activities
of extraterritorial organisations
and bodies
|
|
|
|
|
|
|
|
|
Bruto dodana vrijednost (bazične cijene)
|
273 086
|
-3,1
|
Gross
value added (basic prices)
|
|
|
|
|
|
|
|
|
Porezi na proizvode minus subvencije na proizvode
|
48 447
|
3,1
|
Taxes on
products less subsidies on products
|
|
|
|
|
|
|
|
|
Bruto domaći proizvod (tržišne cijene)
|
321 533
|
-2,2
|
Gross
domestic product (market prices)
|
2.1. BRUTO
DOMAĆI PROIZVOD I PRIMARNI DOHOCI, TEKUĆE CIJENE, U 2012.
GROSS DOMESTIC
PRODUCT AND PRIMARY INCOMES, CURRENT PRICES, 2012
|
|
Vrijednost, mil. kuna
Value, mln kuna
|
Struktura, %
Structure, %
|
|
|
|
|
|
|
|
Sredstva zaposlenih
|
157 913
|
48,3
|
Compensation of employees
|
|
Porezi na proizvodnju
i uvoz
|
59 945
|
18,3
|
Taxes on production and imports
|
|
Porezi na proizvode
|
57 174
|
17,5
|
Taxes on products
|
|
Ostali porezi na proizvodnju
|
2 771
|
0,8
|
Other taxes on production
|
|
Minus: subvencije na
proizvodnju i uvoz
|
7 177
|
2,2
|
Less: subsidies on production and imports
|
|
Bruto poslovni višak
i mješoviti dohodak
|
116 339
|
35,6
|
Gross operating surplus and mixed income
|
|
Bruto domaći proizvod
|
327 021
|
100,0
|
Gross domestic product
|
3.1.
BRUTO DOMAĆI PROIZVOD PREMA RASHODNOJ METODI, TEKUĆE CIJENE, U 2012.
GROSS DOMESTIC PRODUCT, BY EXPENDITURE APPROACH, CURRENT PRICES, 2012
|
|
Vrijednost, mil. kuna
Value, mln kuna
|
Struktura BDP-a, %
GDP structure, %
|
|
|
|
|
|
|
|
Konačna potrošnja
|
263 222
|
80,5
|
Final consumption
|
|
Individualna potrošnja
|
233 564
|
71,4
|
Individual consumption
|
|
Kućanstva
|
194 741
|
59,6
|
Households
|
|
NPUSK
|
3 179
|
1,0
|
NPISH
|
|
Država
|
65 301
|
20,0
|
General Government consumption
|
|
Individualna potrošnja države
|
35 643
|
10,9
|
Individual government
consumption
|
|
Kolektivna potrošnja države
|
29 658
|
9,1
|
Collective government
consumption
|
|
Bruto investicije
|
62 358
|
19,1
|
Gross capital formation
|
|
Bruto investicije u fiksni kapital
|
61 931
|
18,9
|
Gross fixed capital formation
|
|
Promjena zaliha
|
427
|
0,1
|
Changes in inventories
|
|
Izvoz roba i usluga
|
142 885
|
43,7
|
Exports of goods and services
|
|
Robe (fob)
|
73 707
|
22,5
|
Goods (FOB)
|
|
Usluge
|
69 179
|
21,2
|
Services
|
|
Minus: uvoz roba i usluga
|
141 445
|
43,3
|
Less: imports of goods and services
|
|
Robe (fob)
|
119 201
|
36,5
|
Goods (FOB)
|
|
Usluge
|
22 244
|
6,8
|
Services
|
|
|
|
|
|
|
Bruto domaći proizvod
|
327 021
|
100,0
|
Gross domestic product
|
3.2.
BRUTO DOMAĆI PROIZVOD PREMA RASHODNOJ METODI, STALNE CIJENE U CIJENAMA
PRETHODNE GODINE, U 2012.
GROSS DOMESTIC PRODUCT, BY EXPENDITURE APPROACH, CONSTANT PRICES OF PREVIOUS
YEAR, 2012
|
|
Vrijednost, mil. kuna
Value, mln kuna
|
Realne stope rasta, %
Volume changes (%)
|
|
|
|
|
|
|
|
Konačna
potrošnja
|
256 456
|
-2,5
|
Final consumption
|
|
Individualna potrošnja
|
227 027
|
-2,7
|
Individual consumption
|
|
Kućanstava
|
188 591
|
-3,0
|
Households
|
|
NPUSK
|
3 148
|
-4,2
|
NPISH
|
|
Država
|
64 717
|
-0,8
|
General Government consumption
|
|
Individualna potrošnja države
|
35 288
|
-0,9
|
Individual government consumption
|
|
Kolektivna potrošnja države
|
29 429
|
-0,6
|
Collective government consumption
|
|
Bruto
investicije
|
62 877
|
-6,6
|
Gross capital formation
|
|
Bruto investicije u fiksni kapital
|
62 469
|
-3,1
|
Gross fixed capital formation
|
|
Promjena zaliha
|
408
|
-0,71)
|
Changes in inventories
|
|
Izvoz roba
i usluga
|
139 557
|
0,3
|
Exports of goods and services
|
|
Robe (fob)
|
71 937
|
-1,0
|
Goods (FOB)
|
|
Usluge
|
67 621
|
1,7
|
Services
|
|
Minus:
Uvoz roba i usluga
|
137 357
|
-2,4
|
Less: imports of goods and services
|
|
Robe (fob)
|
115 865
|
-2,1
|
Goods (FOB)
|
|
Usluge
|
21 492
|
-4,0
|
Services
|
|
|
|
|
|
|
Bruto
domaći proizvod
|
321 533
|
-2,2
|
Gross domestic product
|
1) Iskazano kao
doprinos stopi realnog rasta
1) Presented as
contribution to real growth rate.
4.1.
TEMELJNI AGREGATI NACIONALNIH RAČUNA, TEKUĆE CIJENE, U 2012.
MAIN AGGREGATES
OF NATIONAL ACCOUNTS, CURRENT PRICES, 2012
|
|
Vrijednost, mil. kuna
Value, mln kuna
|
Struktura, %
Structure, %
|
|
|
|
|
|
|
|
Bruto domaći proizvod
|
327 021
|
100,0
|
Gross
domestic product
|
|
Plus: neto primarni
dohodak iz inozemstva
|
-9 881
|
-3,0
|
Plus: net
primary incomes from the
rest of the world
|
|
Primarni
dohodak primljen
iz inozemstva
|
8 338
|
2,5
|
Primary
incomes receivable from the
rest of the world
|
|
Naknada
zaposlenih
|
6 638
|
2,0
|
Compensation
of employees
|
|
Dohodak od
imovine i primljena kamata
|
321
|
0,1
|
Property
income and interest, receivable
|
|
Ostali
dohoci
|
1 379
|
0,4
|
Other
property income
|
|
|
|
|
|
|
Primarni
dohoci plaćeni inozemstvu
|
18 218
|
5,6
|
Primary
incomes payable to the
rest of the world
|
|
Naknada
zaposlenih
|
294
|
0,1
|
Compensation
of employees
|
|
Dohodak od
imovine i plaćena kamata
|
10 417
|
3,2
|
Property
income and interest, payable
|
|
Ostali
dohoci
|
7 508
|
2,3
|
Other
property income
|
|
Bruto nacionalni dohodak
|
317 140
|
97,0
|
Gross
national income
|
|
Plus: neto tekući transferi iz inozemstva
|
8 774
|
2,7
|
Plus: net
current transfers from the rest of the world
|
|
Tekući
transferi primljeni iz inozemstva
|
12 956
|
4,0
|
Current
transfers receivable
from the rest of the world
|
|
Tekući
transferi plaćeni inozemstvu
|
4 182
|
1,3
|
Current
transfers payable to the
rest of the world
|
|
Bruto nacionalni raspoloživi dohodak
|
325 914
|
99,7
|
Gross
national disposable income
|
|
Minus: finalna potrošnja
|
263 222
|
80,5
|
Less:
final consumption expenditure
|
|
Bruto štednja
|
62 693
|
19,2
|
Gross
saving
|
|
Minus: potrošnja fiksnoga kapitala
|
51 540
|
15,8
|
Less:
Consumption of fixed capital
|
|
Neto štednja
|
11 153
|
3,4
|
Net saving
|
|
Minus: bruto investicije
|
62 358
|
19,1
|
Less:
gross capital formation
|
|
Višak na tekućem računu transakcija s
inozemstvom
|
334
|
0,1
|
Surplus on
the current account with the rest of the world
|
5.1.
IMPLICITNI DEFLATORI BDP-a 2005. – 2012.
IMPLICIT GDP DEFLATORS, 2005 – 2012
|
|
2005.
|
2006.
|
2007.
|
2008.
|
2009.
|
2010.
|
2011.
|
2012.
|
|
|
|
|
|
|
|
|
|
|
|
|
|
Konačna
potrošnja
|
103,4
|
103,4
|
103,8
|
105,7
|
103,0
|
101,2
|
102,2
|
102,6
|
Final consumption
|
|
Kućanstava
|
103,3
|
103,3
|
103,0
|
105,6
|
103,2
|
101,6
|
102,4
|
103,3
|
Households
|
|
Država
|
103,9
|
103,3
|
106,5
|
105,9
|
102,3
|
100,1
|
101,7
|
100,9
|
General government
|
|
Bruto
investicije
|
102,5
|
103,5
|
102,9
|
103,7
|
99,7
|
98,5
|
99,4
|
99,2
|
Gross capital formation
|
|
Izvoz roba
i usluga
|
102,4
|
104,2
|
104,1
|
105,5
|
99,3
|
102,0
|
106,3
|
102,4
|
Exports of goods and services
|
|
Minus:
uvoz roba i usluga
|
102,3
|
102,8
|
103,0
|
104,3
|
98,1
|
101,5
|
106,0
|
103,0
|
Less: imports of goods and services
|
|
|
|
|
|
|
|
|
|
|
|
|
Bruto
domaći proizvod
|
103,3
|
104,0
|
104,1
|
105,7
|
102,9
|
100,8
|
101,8
|
101,7
|
Gross domestic product
|
|
Kratice
|
|
Abbreviations
|
|
|
|
|
|
|
BDP
|
bruto domaći proizvod
|
|
CNB
|
Croatian National Bank
|
|
BND
|
bruto nacionalni dohodak
|
|
EUR
|
euro
|
|
EUR
|
euro
|
|
EU-28
|
European Union
(28 Member States)
|
|
EU-28
|
Europska unija (28 zemalja članica)
|
|
FOB
|
free on board
|
|
fob
|
franko brod
|
|
GDP
|
gross domestic
product
|
|
HRK
|
hrvatska kuna
|
|
GNI
|
gross national
income
|
|
HNB
|
Hrvatska narodna banka
|
|
HRK
|
Croatian kuna
|
|
mil.
|
milijun
|
|
mln
|
million
|
|
NPUSK
|
neprofitne ustanove koje služe kućanstvima
|
|
NPISH
|
non-profit
institutions serving households
|
|
USD
|
američki dolar
|
|
NKD 2007.
|
National Classification of Activities, 2007 version
|
|
|
|
|
US $
|
US dollar
|
|
|
|
|
|
|
|
Znakovi
|
|
Symbols
|
|
|
|
|
|
|
|
-
|
nema pojave
|
|
-
|
no occurrence
|
|
|
|
|
|
|
|
|
|
|
|
|
|
|
|
|
|
|
|
Izdaje i tiska Državni zavod za statistiku Republike
Hrvatske, Zagreb, Ilica 3, p. p. 80.
Published
and printed by the Croatian Bureau of Statistics, Zagreb, Ilica 3, P. O. B.
80
Telefon/ Phone:
+385 (0) 1 4806-111, telefaks/ Fax: +385 (0) 1 4817-666
Odgovara ravnatelj Marko Krištof
Person responsible: Marko Krištof, Director General
Priredili: Jasna Kiš, Verica Roknić, Slavica Šolčić,
Anita Pavlović, Jelena Kelebuh Arambašić, Marija Gojević, Nataša Vucelić,
Goran Razumić, Sanja Šmigoc, Valentina Hudiluk
Prepared by: Jasna Kiš, Verica Roknić,Slavica
Šolčić, Anita Pavlović, Jelena Kelebuh Arambašić, Marija Gojević, Nataša
Vucelić,
Goran Razumić, Sanja Šmigoc, Valentina Hudiluk
|
|
MOLIMO KORISNIKE DA PRI KORIŠTENJU PODATAKA NAVEDU
IZVOR.
USERS ARE KINDLY REQUESTED TO STATE THE SOURCE
|
|
Naklada: 20 primjeraka
20 copies printed
Podaci iz ovog priopćenja objavljuju se i na
internetu.
First Release data are also published on the
Internet.
Služba za komunikaciju s korisnicima
User Communication Department
|