|

GODINA/ YEAR: LII. ZAGREB,
29. SVIBNJA 2015./ 29 MAY, 2015 BROJ/
NUMBER: 2.1.3/4.
CODEN
POPCEA ISSN 1330-0350
INDEKS OBUJMA INDUSTRIJSKE PROIZVODNJE TE INDEKSI
ZALIHA,
ZAPOSLENIH OSOBA I PROIZVODNOSTI RADA U INDUSTRIJI
U TRAVNJU 2015., PRVI REZULTATI
INDUSTRIAL PRODUCTION VOLUME INDEX AND INDICES OF
STOCKS,
PERSONS EMPLOYED AND LABOUR PRODUCTIVITY IN INDUSTRY,
APRIL 2015, FIRST RESULTS
|
Indeks
obujma industrijske proizvodnje – ukupno
|
|
Industrial
production volume index – total
|
|
|
|
|
|
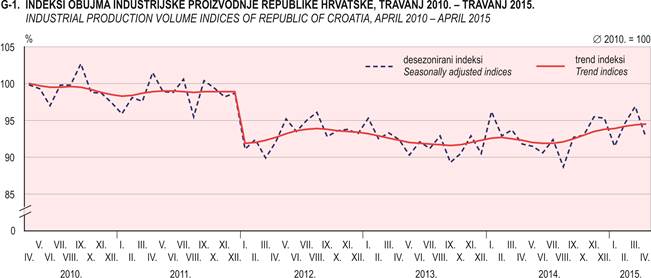
Ukupna desezonirana
industrijska proizvodnja u Republici
Hrvatskoj u travnju 2015. u usporedbi s ožujkom 2015. bilježi pad za 4,2%.
|
|
The total seasonally adjusted industrial production
in the Republic of Croatia in April 2015, as compared to March 2015,
decreased by 4.2%.
|
|
|
|
|
|
U travnju 2015. u usporedbi s travnjem 2014.
industrijska proizvodnja u Republici Hrvatskoj, kalendarski prilagođena,
bilježi rast za 1,2%.
|
|
In April 2015, as compared to April 2014, the
industrial production in the Republic of Croatia, working-day adjusted,
increased by 1.2%.
|
|
Indeks obujma
industrijske proizvodnje prema agregatima
GIG-a 2009.
|
|
Industrial production volume index, according
to the MIGs 2009. aggregates
|
|
|
|
|
|
|
|
|
|
Mjesečna usporedba1)
|
|
Monthly comparison1)
|
|
|
|
|
|
U travnju 2015. u odnosu na ožujak 2015. Kapitalni
proizvodi manji su za 4,5%, Netrajni proizvodi za široku potrošnju za 4,2%,
Energija za 3,3% i Intermedijarni proizvodi za 3,0%, dok su Trajni
proizvodi za široku potrošnju veći za 0,3%.
|
|
In April 2015, as compared to March 2015, Capital
goods were by 4.5%, Non-durable consumer goods by 4.2%, Energy by 3.3% and
Intermediate goods by 3.0% lower, while Durable consumer goods were by 0.3%
higher.
|
|
|
|
|
|
|
|
|
|
Godišnja usporedba2)
|
|
Annual comparison2)
|
|
|
|
|
|
U
travnju 2015. u odnosu na travanj 2014. Energija je veća za 5,5%,
Intermedijarni proizvodi za 2,0% i Trajni proizvodi za široku potrošnju za
1,7%, dok su Kapitalni proizvodi manji za 3,2% i Netrajni proizvodi za
široku potrošnju za 0,1%.
|
|
In April 2015, as compared to April 2014, Energy was
by 5.5%, Intermediate goods by 2.0% and Durable consumer goods by 1.7%
higher, while Capital goods were by 3.2% and Non-durable consumer goods by
0.1% lower.
|
|
|
|
|
|
|
|
|
|
1) Desezonirani indeksi. Vidi Metodološka objašnjenja.
|
|
1) Seasonally adjusted indices. See Notes on
Methodology.
|
|
2) Kalendarski prilagođeni indeksi. Vidi Metodološka
objašnjenja.
|
|
2) Working-day adjusted indices. See Notes on
Methodology.
|
|
Indeks obujma
industrijske proizvodnje prema područjima
NKD-a 2007. – prilagođeni indeksi
|
|
Industrial
production volume index, according
to the NKD 2007.
sections – adjusted indices
|
|
|
|
|
|
Mjesečna usporedba1)
|
|
Monthly comparison1)
|
|
|
|
|
|
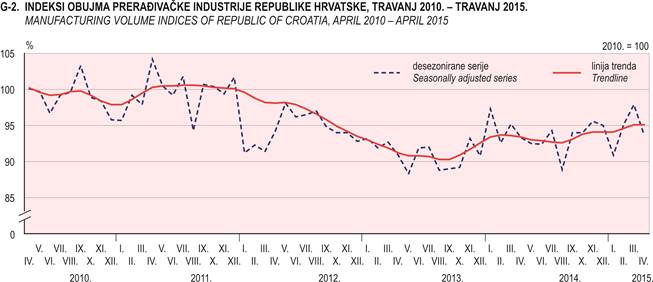
Prema
područjima NKD-a 2007., desezonirana industrijska proizvodnja u travnju
2015. u usporedbi s ožujkom 2015. u Opskrbi električnom energijom, plinom,
parom i klimatizaciji bilježi pad za 5,5%, u Prerađivačkoj industriji za
4,3% i u Rudarstvu i vađenju za 0,4%.
|
|
According to the NKD 2007. sections, seasonally
adjusted industrial production in April 2015, as compared to March 2015,
decreased in Electricity, gas, steam and air conditioning supply by 5.5%,
in Manufacturing by 4.3% and in Mining and quarrying by 0.4%.
|
|
|
|
|
|
Godišnja usporedba2)
|
|
Annual comparison2)
|
|
|
|
|
|
U
travnju 2015. u usporedbi s travnjem 2014. industrijska proizvodnja, kalendarski
prilagođena, bilježi rast u Rudarstvu i vađenju za 7,2%, u Opskrbi
električnom energijom, plinom, parom i klimatizaciji za 3,0% i u
Prerađivačkoj industriji za 0,3%.
|
|
In April 2015, as compared to April 2014, the
industrial production, working-day adjusted, increased in Mining and
quarrying by 7.2%, in Electricity, gas, steam and air conditioning supply
by 3.0% and in Manufacturing by 0.3%.
|
|
|
|
|
|
Indeks zaliha gotovih
industrijskih proizvoda pri
proizvođačima – izvorni indeksi
|
|
Producers’ stock
index of industrial final products –
gross indices
|
|
|
|
|
|
Ukupne
zalihe gotovih industrijskih proizvoda u Republici Hrvatskoj na kraju
travnja 2015. u usporedbi sa zalihama na kraju ožujka 2015. manje su za
1,2%, a u usporedbi sa zalihama na kraju travnja 2014. manje su za 7,2%.
|
|
At the end of April 2015, the total stocks of
industrial finished products in the Republic of Croatia were by 1.2% lower
than stocks at the end of March 2015 and by 7.2% lower than stocks at the
end of April 2014.
|
|
|
|
|
|
|
|
|
|
Usporedba prema
agregatima GIG-a 2009.
|
|
Comparison
according to the MIGs 2009. aggregates
|
|
|
|
|
|
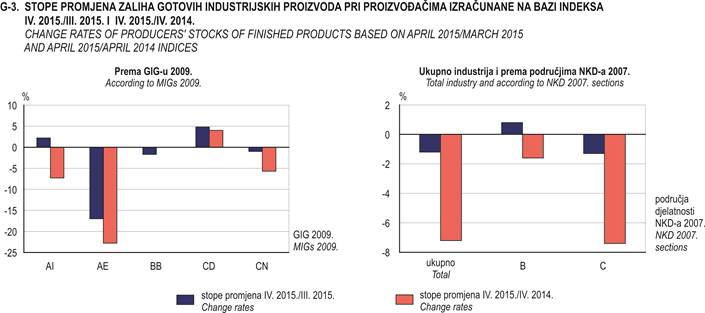
Zalihe
Energije na kraju travnja 2015. u usporedbi sa zalihama na kraju ožujka
2015. manje su za 17,0%, zalihe Kapitalnih proizvoda za
1,7% i zalihe Netrajnih proizvoda za široku potrošnju za 1,0%, dok su
zalihe Trajnih proizvoda za široku potrošnju veće za 4,8% i zalihe
Intermedijarnih proizvoda za 2,2%.
|
|
Stocks of Energy at the end of April 2015, as
compared to stocks at the end of March 2015, decreased by 17.0%, those of
Capital goods by 1.7% and those of Non-durable consumer goods by 1.0%,
while those of Durable consumer goods increased by 4.8% and those of
Intermediate goods by 2.2%.
|
|
|
|
|
|
Ako usporedimo zalihe na kraju travnja 2015. sa
zalihama na kraju travnja 2014., tada su zalihe Energije manje za 22,8%,
zalihe Intermedijarnih proizvoda za 7,3% i zalihe Netrajnih proizvoda za
široku potrošnju za 5,7%, dok su zalihe Trajnih proizvoda za široku
potrošnju veće su za 4,0%, a zalihe Kapitalnih proizvoda zadržale su istu
razinu.
|
|
The comparison of stocks at the end of April 2015
with stocks at the end of April 2014 shows that the stocks of Energy were
by 22.8%, of Intermediate goods by 7.3% and of Non-durable consumer goods
by 5.7% lower, while those of Durable consumer goods were by 4.0% lower and
those of Capital goods remained at the same level.
|
|
|
|
|
|
|
|
|
|
Usporedba prema
područjima NKD-a 2007.
|
|
Comparison
according to the NKD 2007. sections
|
|
|
|
|
|
Zalihe
gotovih industrijskih proizvoda na kraju travnja 2015. u usporedbi sa
zalihama na kraju ožujka 2015. u Prerađivačkoj industriji manje su za 1,3%,
dok su u Rudarstvu i vađenju veće za 0,8%.
|
|
Stocks of industrial finished products at the end of
April 2015, as compared to stocks at the end of March 2015, were in
Manufacturing by 1.3% lower, while in Mining and quarrying they were by
0.8% higher.
|
|
|
|
|
|
Ako
usporedimo zalihe gotovih industrijskih proizvoda na kraju travnja 2015. sa
zalihama na kraju travnja 2014., tada su u Prerađivačkoj industriji manje
za 7,4% i u Rudarstvu i vađenju manje za 1,6%.
|
|
The comparison of stocks at the end of April 2015
with stocks at the end of April 2014 shows that the stocks in Manufacturing
were by 7.4% and in Mining and quarrying by 1.6% lower.
|
|
|
|
|
|
|
|
|
|
Indeks zaposlenih
osoba u industriji – izvorni indeksi
|
|
Industrial persons
employed index – gross indices
|
|
|
|
|
|
Ukupan
broj zaposlenih osoba u industriji u travnju 2015. veći je za 0,1%, u
usporedbi s ožujkom 2015., a u usporedbi s travnjem 2014. manji je za 0,7%.
|
|
The total number of persons employed in industry in
April 2015 was by 0.1% higher than in March 2015 and by 0.7% lower than in
April 2014.
|
|
|
|
|
|
|
|
|
|
Usporedba prema
agregatima GIG-a 2009.
|
|
Comparison
according to the MIGs 2009. aggregates
|
|
|
|
|
|
U
travnju 2015. u usporedbi s ožujkom 2015. broj zaposlenih osoba u
proizvodnji Trajnih proizvoda za široku potrošnju veći je za 0,5%, u
Intermedijarnim proizvodima za 0,3% i u Netrajnim proizvodima za široku
potrošnju za 0,1%, dok je u Energiji manji za 0,2% i u Kapitalnim proizvodima
manji za 0,1%.
|
|
In April 2015, as compared to March 2015, the number
of persons employed in production of Durable consumer goods was by 0.5% of
Intermediate goods by 0.3% and in Non-durable consumer goods by 0.1%
higher, while in Energy it was by 0.2% and in Capital goods by 0.1% lower.
|
|
|
|
|
|
Ako
usporedimo broj zaposlenih osoba u travnju 2015. s travnjem 2014., tada je
u proizvodnji Trajnih proizvoda za široku potrošnju manji za 7,6%, u
Energiji za 1,7%, u Kapitalnim proizvodima za 0,5% i u Intermedijarnim proizvodima za 0,1%, dok je u Netrajnim proizvodima za široku potrošnju veći za 0,1%.
|
|
The comparison of the number of persons employed in
April 2015 with that in April 2014 shows that in production of Durable
consumer goods it was by 7.6%, in Energy by 1.7%, in Capital goods by 0.5%
and in Intermediate goods by 0.1% lower, while in Non-durable consumer
goods it was by 0.1% higher.
|
|
|
|
|
|
|
|
|
|
Usporedba prema
područjima NKD-a 2007.
|
|
Comparison
according to the NKD 2007. sections
|
|
|
|
|
|
U
travnju 2015. u usporedbi s ožujkom 2015. broj zaposlenih osoba u
Rudarstvu i vađenju veći je za 0,7%, dok je u Opskrbi električnom
energijom, plinom, parom i klimatizaciji manji za 0,2%, a u Prerađivačkoj
industriji zadržao je istu razinu kao i u prethodnom mjesecu.
|
|
In April 2015, as compared to March 2015, the number
of persons employed was by 0.7% higher in Mining and quarrying, while in
Electricity, gas, steam and air conditioning supply it was by 0.2% lower
and in Manufacturing it remained at the same level as in the previous
month.
|
|
|
|
|
|
Ako
usporedimo broj zaposlenih osoba u travnju 2015. s travnjem 2014., tada je
u Rudarstvu i vađenju manji za 4,9%, u Opskrbi električnom energijom,
plinom, parom i klimatizaciji za 1,1% i u Prerađivačkoj industriji za 0,5%.
|
|
The comparison of the number of persons employed in
April 2015 with that in April 2014 shows that in Mining and quarrying it
was by 4.9%, in Electricity, gas, steam and air conditioning supply by 1.1%
and in Manufacturing by 0.5% lower.
|
|
Indeks
proizvodnosti rada u industriji – izvorni indeksi
|
|
Labour
productivity index in industry – gross indices
|
|
|
|
|
|
Ukupna
proizvodnost rada u industriji u razdoblju od siječnja do travnja 2015. u
usporedbi s istim razdobljem 2014. veća je za 0,7%.
|
|
In the period from January to April 2015, as compared
to the same period last year, the total labour productivity in industry
increased by 0.7%.
|
|
|
|
|
|
|
|
|
|
Usporedba prema
agregatima GIG-a 2009.
|
|
Comparison
according to the MIGs 2009. aggregates
|
|
|
|
|
|
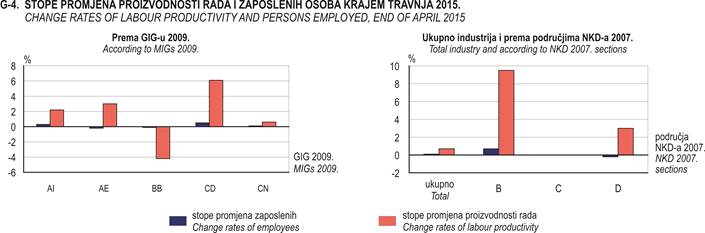
Proizvodnost
rada Trajnih proizvoda za široku potrošnju u razdoblju od siječnja do
travnja 2015. u usporedbi s istim razdobljem 2014. veća je za 6,1%, u
Energiji za 3,0%, u Intermedijarnim proizvodima za 2,2% i u Netrajnim
proizvodima za široku potrošnju za 0,6%, dok je u Kapitalnim proizvodima
manja za 4,2%.
|
|
The labour productivity was in the period from
January to April 2015, as compared to the same period of 2014, in Durable
consumer goods by 6.1%, in Energy by 3.0%, in Intermediate goods by 2.2%
and in Non-durable consumer goods by 0.6% higher, while in Capital goods it
was by 4.2% lower.
|
|
|
|
|
|
|
|
|
|
Usporedba prema
područjima NKD-a 2007.
|
|
Comparison
according to the NKD 2007. sections
|
|
|
|
|
|
U
Rudarstvu i vađenju proizvodnost rada u razdoblju od siječnja do travnja
2015. u usporedbi s istim razdobljem 2014. veća je za 9,5% i u Opskrbi
električnom energijom, plinom, parom i klimatizaciji za 3,0%, dok je u
Prerađivačkoj industriji zadržala istu razinu.
|
|
The labour productivity was in the period from
January to April 2015, as compared to the same period of 2014, in Mining
and quarrying by 9.5% and in Electricity, gas, steam and air conditioning
supply by 3.0% higher, while in Manufacturing it remained at the same
level.
|
I. DESEZONIRANI I KALENDARSKI PRILAGOĐENI
POKAZATELJI
SEASONALLY ADJUSTED AND WORKING-DAY
ADJUSTED INDICATORS
1. INDUSTRIJSKA PROIZVODNJA – MJESEČNE STOPE
PROMJENA IZRAČUNANE IZ DESEZONIRANIH INDEKSA U TRAVNJU 2015.
INDUSTRIAL
PRODUCTION – MONTH-ON-MONTH GROWTH RATES CALCULATED ON BASIS OF SEASONALLY
ADJUSTED INDICES,
APRIL 2015
%
|
|
|
XI. 2014.
X. 2014.
|
XII. 2014.
XI. 2014.
|
I. 2015.
XII. 2014.
|
II. 2015.
I. 2015.
|
III. 2015.
II. 2015.
|
IV. 2015.
III. 2015.
|
|
|
|
|
|
|
|
|
|
|
|
|
|
|
Ukupno industrija
|
2,7
|
-0,2
|
-4,0
|
3,4
|
2,4
|
-4,2
|
|
Total industry
|
|
|
|
|
|
|
|
|
|
|
|
|
|
Prema GIG-u 2009.
|
|
|
|
|
|
|
|
According to MIGs 2009.
|
|
AI
|
Intermedijarni proizvodi
|
0,2
|
9,0
|
-0,5
|
-1,3
|
0,4
|
-3,0
|
AI
|
Intermediate goods
|
|
AE
|
Energija
|
3,3
|
-2,0
|
-2,3
|
1,0
|
6,5
|
-3,3
|
AE
|
Energy
|
|
BB
|
Kapitalni proizvodi
|
-1,9
|
-6,4
|
-3,0
|
8,7
|
1,4
|
-4,5
|
BB
|
Capital goods
|
|
CD
|
Trajni proizvodi za široku
potrošnju
|
12,2
|
-13,0
|
-5,1
|
16,0
|
-2,0
|
0,3
|
CD
|
Consumer durables
|
|
CN
|
Netrajni proizvodi za široku
potrošnju
|
3,7
|
-0,9
|
-4,9
|
4,1
|
0,7
|
-4,2
|
CN
|
Consumer non-durables
|
|
|
|
|
|
|
|
|
|
|
|
|
|
Prema područjima i odjeljcima
NKD-a 2007.
|
|
|
|
|
|
|
|
According
to NKD 2007. sections and divisions
|
|
B
|
Rudarstvo i vađenje
|
1,3
|
5,2
|
2,1
|
-1,9
|
-2,0
|
-0,4
|
B
|
Mining and quarrying
|
|
06
|
Vađenje sirove nafte i prirodnog
plina
|
0,1
|
0,5
|
0,5
|
1,2
|
-1,2
|
-1,2
|
06
|
Extraction of crude petroleum and
natural gas
|
|
08
|
Ostalo rudarstvo i vađenje
|
12,9
|
7,2
|
6,5
|
-8,8
|
3,6
|
-4,3
|
08
|
Other mining and quarrying
|
|
09
|
Pomoćne uslužne djelatnosti u rudarstvu
|
-4,1
|
0,3
|
-0,7
|
-2,1
|
2,4
|
3,2
|
09
|
Mining support service activities
|
|
|
|
|
|
|
|
|
|
|
|
|
C
|
Prerađivačka industrija
|
1,7
|
-0,6
|
-4,3
|
4,6
|
2,9
|
-4,3
|
C
|
Manufacturing
|
|
10
|
Proizvodnja prehrambenih
proizvoda
|
3,9
|
4,6
|
-10,2
|
2,1
|
4,0
|
-8,3
|
10
|
Manufacture of food products
|
|
11
|
Proizvodnja pića
|
6,0
|
-0,6
|
-7,1
|
2,8
|
4,5
|
-4,2
|
11
|
Manufacture of beverages
|
|
12
|
Proizvodnja duhanskih proizvoda
|
-10,0
|
11,9
|
58,6
|
-30,7
|
-16,0
|
-3,1
|
12
|
Manufacture of tobacco products
|
|
13
|
Proizvodnja tekstila
|
-3,4
|
0,7
|
7,1
|
5,7
|
-8,2
|
1,8
|
13
|
Manufacture of textiles
|
|
14
|
Proizvodnja odjeće
|
1,2
|
-4,7
|
2,3
|
-0,9
|
0,8
|
-3,3
|
14
|
Manufacture of wearing apparel
|
|
15
|
Proizvodnja kože i srodnih
proizvoda
|
0,2
|
0,2
|
-3,1
|
8,7
|
3,7
|
2,8
|
15
|
Manufacture of leather and related
products
|
|
16
|
Prerada drva i proizvoda od drva i
pluta,
osim namještaja; proizvodnja proizvoda
od slame i pletarskih materijala
|
-5,2
|
7,4
|
8,8
|
-3,0
|
1,5
|
-6,0
|
16
|
Manufacture of wood and of
products of wood and cork, except furniture; manufacture of articles of
straw and plaiting materials
|
|
17
|
Proizvodnja papira i proizvoda od
papira
|
-0,1
|
5,0
|
3,1
|
0,6
|
-2,0
|
-3,5
|
17
|
Manufacture of paper and paper
products
|
|
18
|
Tiskanje i umnožavanje snimljenih
zapisa
|
-0,3
|
-6,4
|
20,5
|
-8,9
|
-4,7
|
-3,7
|
18
|
Printing and reproduction of
recorded media
|
|
19
|
Proizvodnja koksa i rafiniranih
naftnih
proizvoda
|
-32,3
|
-39,8
|
31,2
|
-4,7
|
80,5
|
20,4
|
19
|
Manufacture of coke and refined
petroleum products
|
|
20
|
Proizvodnja kemikalija i kemijskih
proizvoda
|
3,0
|
-0,9
|
0,9
|
3,1
|
-6,3
|
10,1
|
20
|
Manufacture of chemicals and
chemical products
|
|
21
|
Proizvodnja osnovnih farmaceutskih
proizvoda i farmaceutskih pripravaka
|
13,1
|
-9,3
|
-9,6
|
8,0
|
3,0
|
-1,3
|
21
|
Manufacture of basic pharmaceutical
products and pharmaceutical preparations
|
|
22
|
Proizvodnja proizvoda od gume i
plastike
|
5,3
|
36,2
|
-17,2
|
2,0
|
-12,5
|
-5,8
|
22
|
Manufacture of rubber and plastic
products
|
|
23
|
Proizvodnja ostalih nemetalnih
mineralnih proizvoda
|
8,7
|
-2,6
|
1,3
|
-1,6
|
-0,6
|
-1,5
|
23
|
Manufacture of other non-metallic
mineral products
|
|
24
|
Proizvodnja metala
|
-14,7
|
42,7
|
-12,1
|
8,6
|
4,8
|
-18,2
|
24
|
Manufacture of basic metals
|
|
25
|
Proizvodnja gotovih metalnih
proizvoda,
osim strojeva i opreme
|
-6,4
|
0,7
|
7,4
|
-0,3
|
5,8
|
-0,7
|
25
|
Manufacture of fabricated metal
products, except machinery and equipment
|
|
26
|
Proizvodnja računala te
elektroničkih
i optičkih proizvoda
|
10,5
|
-5,2
|
-22,2
|
21,6
|
-2,3
|
-23,9
|
26
|
Manufacture of computer,
electronic and optical products
|
|
27
|
Proizvodnja električne opreme
|
-7,1
|
27,1
|
1,6
|
-17,9
|
9,6
|
0,8
|
27
|
Manufacture of electrical
equipment
|
|
28
|
Proizvodnja strojeva i uređaja, d.
n.
|
25,9
|
-17,6
|
10,0
|
4,0
|
-5,5
|
-2,6
|
28
|
Manufacture of machinery and
equipment
n. e. c.
|
|
29
|
Proizvodnja motornih vozila,
prikolica
i poluprikolica
|
-10,5
|
-12,2
|
-16,0
|
1,8
|
-1,7
|
16,8
|
29
|
Manufacture of motor vehicles,
trailers and semi-trailers
|
|
30
|
Proizvodnja ostalih prijevoznih
sredstava
|
-6,3
|
5,3
|
7,8
|
-0,2
|
8,5
|
-27,6
|
30
|
Manufacture of other transport
equipment
|
|
31
|
Proizvodnja namještaja
|
13,5
|
-20,7
|
-5,0
|
17,6
|
2,7
|
3,1
|
31
|
Manufacture of furniture
|
|
32
|
Ostala prerađivačka industrija
|
-25,7
|
4,5
|
-12,9
|
31,5
|
2,8
|
-14,9
|
32
|
Other manufacturing
|
|
33
|
Popravak i instaliranje strojeva i
opreme
|
-2,5
|
8,0
|
-32,0
|
31,9
|
5,8
|
-0,8
|
33
|
Repair and installation of
machinery and equipment
|
|
|
|
|
|
|
|
|
|
|
|
|
D
|
Opskrba električnom energijom,
plinom, parom i klimatizacija
|
11,4
|
0,4
|
-5,1
|
2,0
|
2,4
|
-5,5
|
D
|
Electricity, gas, steam and air
conditioning supply
|
|
35
|
Opskrba električnom energijom,
plinom, parom i klimatizacija
|
11,4
|
0,4
|
-5,1
|
2,0
|
2,4
|
-5,5
|
35
|
Electricity, gas, steam and air
conditioning supply
|
2. INDUSTRIJSKA PROIZVODNJA – GODIŠNJE STOPE
PROMJENA IZRAČUNANE IZ KALENDARSKI PRILAGOĐENIH INDEKSA
U TRAVNJU 2015.
INDUSTRIAL
PRODUCTION – YEAR-ON-YEAR GROW RATES CALCULATED ON BASIS OF WORKING-DAY ADJUSTED
INDICES,
APRIL 2015
%
|
|
|
XI. 2014.
XI. 2013.
|
XII. 2014.
XII. 2013.
|
I. 2015.
I. 2014.
|
II. 2015.
II. 2014.
|
III. 2015.
III. 2014.
|
IV. 2015.
IV. 2014.
|
I.–IV. 2015.
I.–IV. 2014.
|
|
|
|
|
|
|
|
|
|
|
|
|
|
|
|
|
Ukupno industrija
|
2,8
|
5,3
|
-5,0
|
1,9
|
3,5
|
1,2
|
0,5
|
|
Total industry
|
|
|
|
|
|
|
|
|
|
|
|
|
|
|
Prema GIG-u 2009.
|
|
|
|
|
|
|
|
|
According to MIGs 2009.
|
|
AI
|
Intermedijarni proizvodi
|
1,3
|
11,9
|
-0,1
|
6,9
|
2,6
|
2,0
|
2,8
|
AI
|
Intermediate goods
|
|
AE
|
Energija
|
3,2
|
0,1
|
-3,0
|
-3,9
|
11,2
|
5,5
|
2,1
|
AE
|
Energy
|
|
BB
|
Kapitalni proizvodi
|
-6,7
|
-0,3
|
-13,6
|
-1,3
|
0,1
|
-3,2
|
-4,2
|
BB
|
Capital goods
|
|
CD
|
Trajni proizvodi za široku
potrošnju
|
13,7
|
-3,9
|
-7,4
|
2,6
|
2,3
|
1,7
|
0,2
|
CD
|
Consumer durables
|
|
CN
|
Netrajni proizvodi za široku
potrošnju
|
5,1
|
7,6
|
-2,9
|
4,9
|
2,5
|
-0,1
|
1,1
|
CN
|
Consumer non-durable
|
|
|
|
|
|
|
|
|
|
|
|
|
|
|
Prema područjima i odjeljcima
NKD-a 2007.
|
|
|
|
|
|
|
|
|
According to NKD 2007. sections
and divisions
|
|
B
|
Rudarstvo i vađenje
|
-1,4
|
-0,7
|
4,8
|
2,5
|
4,1
|
7,2
|
4,7
|
B
|
Mining and quarrying
|
|
06
|
Vađenje sirove nafte i prirodnog
plina
|
0,7
|
-0,1
|
2,4
|
5,6
|
5,9
|
6,2
|
5,0
|
06
|
Extraction of crude petroleum and
natural gas
|
|
08
|
Ostalo rudarstvo i vađenje
|
1,3
|
-9,3
|
28,6
|
9,5
|
2,0
|
12,3
|
10,9
|
08
|
Other mining and quarrying
|
|
09
|
Pomoćne uslužne djelatnosti u
rudarstvu
|
-4,2
|
-5,0
|
-6,7
|
-9,7
|
-7,1
|
0,9
|
-5,6
|
09
|
Mining support service activities
|
|
|
|
|
|
|
|
|
|
|
|
|
|
C
|
Prerađivačka industrija
|
2,7
|
4,6
|
-6,5
|
2,7
|
2,9
|
0,3
|
0,0
|
C
|
Manufacturing
|
|
10
|
Proizvodnja prehrambenih proizvoda
|
3,2
|
18,6
|
-0,6
|
3,8
|
7,2
|
-7,0
|
0,7
|
10
|
Manufacture of food products
|
|
11
|
Proizvodnja pića
|
-12,6
|
-4,7
|
-5,4
|
-0,3
|
1,9
|
-2,5
|
-1,5
|
11
|
Manufacture of beverages
|
|
12
|
Proizvodnja duhanskih proizvoda
|
-20,2
|
-16,2
|
40,9
|
34,7
|
-13,4
|
-8,9
|
9,2
|
12
|
Manufacture of tobacco products
|
|
13
|
Proizvodnja tekstila
|
-15,3
|
-24,4
|
5,6
|
40,5
|
-2,8
|
-13,7
|
4,1
|
13
|
Manufacture of textiles
|
|
14
|
Proizvodnja odjeće
|
14,9
|
1,8
|
-0,3
|
7,9
|
6,2
|
-6,9
|
1,7
|
14
|
Manufacture of wearing apparel
|
|
15
|
Proizvodnja kože i srodnih
proizvoda
|
15,0
|
29,7
|
-2,5
|
16,3
|
23,6
|
39,0
|
18,7
|
15
|
Manufacture of leather and related
products
|
|
16
|
Prerada drva i proizvoda od drva i
pluta,
osim namještaja; proizvodnja proizvoda
od slame i pletarskih materijala
|
-6,1
|
5,2
|
8,5
|
4,4
|
4,2
|
2,0
|
4,6
|
16
|
Manufacture of wood and of
products of wood and cork, except furniture; manufacture of articles of
straw and plaiting materials
|
|
17
|
Proizvodnja papira i proizvoda od
papira
|
-4,2
|
3,9
|
-5,2
|
2,2
|
-4,7
|
0,3
|
-2,0
|
17
|
Manufacture of paper and paper
products
|
|
18
|
Tiskanje i umnožavanje snimljenih
zapisa
|
5,7
|
-2,9
|
10,3
|
-2,0
|
-14,0
|
-11,1
|
-5,0
|
18
|
Printing and reproduction of
recorded media
|
|
19
|
Proizvodnja koksa i rafiniranih
naftnih
proizvoda
|
0,5
|
-69,7
|
-52,9
|
-55,2
|
73,9
|
15,3
|
-12,6
|
19
|
Manufacture of coke and refined
petroleum products
|
|
20
|
Proizvodnja kemikalija i kemijskih
proizvoda
|
5,0
|
-12,5
|
-30,9
|
2,7
|
-3,5
|
8,4
|
-5,0
|
20
|
Manufacture of chemicals and
chemical products
|
|
21
|
Proizvodnja osnovnih farmaceutskih
proizvoda i farmaceutskih pripravaka
|
47,3
|
15,3
|
-16,2
|
5,4
|
-3,1
|
25,9
|
1,4
|
21
|
Manufacture of basic
pharmaceutical products and pharmaceutical preparations
|
|
22
|
Proizvodnja proizvoda od gume i
plastike
|
30,9
|
80,7
|
43,2
|
59,8
|
16,1
|
6,3
|
28,0
|
22
|
Manufacture of rubber and plastic
products
|
|
23
|
Proizvodnja ostalih nemetalnih
mineralnih proizvoda
|
10,6
|
-4,6
|
-8,4
|
-1,6
|
-5,4
|
3,2
|
-2,8
|
23
|
Manufacture of other non-metallic
mineral products
|
|
24
|
Proizvodnja metala
|
-30,0
|
1,4
|
-27,4
|
-14,4
|
-1,4
|
-18,9
|
-15,4
|
24
|
Manufacture of basic metals
|
|
25
|
Proizvodnja gotovih metalnih
proizvoda,
osim strojeva i opreme
|
-21,7
|
-8,0
|
-13,8
|
-9,2
|
0,9
|
2,6
|
-4,6
|
25
|
Manufacture of fabricated metal
products, except machinery and equipment
|
|
26
|
Proizvodnja računala te
elektroničkih
i optičkih proizvoda
|
-19,8
|
17,5
|
-4,3
|
21,5
|
11,1
|
-19,1
|
1,8
|
26
|
Manufacture of computer,
electronic and optical products
|
|
27
|
Proizvodnja električne opreme
|
10,3
|
51,0
|
29,3
|
21,1
|
1,6
|
6,4
|
12,2
|
27
|
Manufacture of electrical equipment
|
|
28
|
Proizvodnja strojeva i uređaja, d.
n.
|
21,7
|
10,7
|
-8,9
|
-1,3
|
-19,8
|
-15,7
|
-12,1
|
28
|
Manufacture of machinery and
equipment
n. e. c.
|
|
29
|
Proizvodnja motornih vozila,
prikolica
i poluprikolica
|
19,5
|
1,1
|
-14,2
|
-15,9
|
-8,0
|
6,6
|
-7,9
|
29
|
Manufacture of motor vehicles,
trailers and semi-trailers
|
|
30
|
Proizvodnja ostalih prijevoznih
sredstava
|
22,7
|
0,6
|
14,0
|
41,0
|
57,4
|
24,0
|
34,2
|
30
|
Manufacture of other transport
equipment
|
|
31
|
Proizvodnja namještaja
|
20,3
|
-2,8
|
-13,9
|
-1,9
|
2,1
|
4,1
|
-1,9
|
31
|
Manufacture of furniture
|
|
32
|
Ostala prerađivačka industrija
|
-37,2
|
-28,5
|
-38,4
|
-7,1
|
-1,5
|
-19,8
|
-16,7
|
32
|
Other manufacturing
|
|
33
|
Popravak i instaliranje strojeva i
opreme
|
-14,9
|
5,0
|
-21,3
|
-8,1
|
1,8
|
-3,4
|
-7,2
|
33
|
Repair and installation of
machinery and equipment
|
|
|
|
|
|
|
|
|
|
|
|
|
|
D
|
Opskrba električnom energijom,
plinom,
parom i klimatizacija
|
5,3
|
13,5
|
1,2
|
-0,9
|
7,7
|
3,0
|
2,6
|
D
|
Electricity, gas, steam and air
conditioning supply
|
|
35
|
Opskrba električnom energijom,
plinom,
parom i klimatizacija
|
5,3
|
13,5
|
1,2
|
-0,9
|
7,7
|
3,0
|
2,6
|
35
|
Electricity, gas, steam and air
conditioning supply
|
II. IZVORNI INDEKSI
GROSS INDICES
1. INDUSTRIJSKA PROIZVODNJA – IZVORNI INDEKSI
VOLUMENA, UKUPNO, PREMA GIG-u 2009. TE PODRUČJIMA I ODJELJCIMA
NKD-a 2007. U TRAVNJU 2015.
INDUSTRIAL
PRODUCTION – GROSS VOLUME INDICES, TOTAL, ACCORDING TO MIGs 2009. AND NKD
2007. SECTIONS
AND DIVISIONS, APRIL 2015
|
|
|
Struktura
Structure
|
IV. 2015.
Æ 2014.
|
IV. 2015.
IV. 2014.
|
I. – IV. 2015.
I. – IV. 2014.
|
|
|
|
|
|
|
|
|
|
|
|
|
|
Ukupno industrija
|
100,00
|
103,2
|
101,2
|
100,2
|
|
Total industry
|
|
|
|
|
|
|
|
|
|
|
|
Prema GIG-u 2009.
|
|
|
|
|
|
According to MIGs 2009.
|
|
AI
|
Intermedijarni proizvodi
|
29,56
|
108,4
|
102,0
|
102,4
|
AI
|
Intermediate goods
|
|
AE
|
Energija
|
18,57
|
102,2
|
105,5
|
102,0
|
AE
|
Energy
|
|
BB
|
Kapitalni proizvodi
|
15,69
|
103,1
|
96,9
|
95,4
|
BB
|
Capital goods
|
|
CD
|
Trajni proizvodi za široku
potrošnju
|
2,97
|
106,3
|
101,4
|
98,7
|
CD
|
Consumer durables
|
|
CN
|
Netrajni proizvodi za široku
potrošnju
|
33,21
|
98,9
|
99,9
|
100,5
|
CN
|
Consumer non-durables
|
|
|
|
|
|
|
|
|
|
|
|
Prema područjima i odjeljcima
NKD-a 2007.
|
|
|
|
|
|
According to NKD 2007. sections
and divisions
|
|
B
|
Rudarstvo i vađenje
|
6,35
|
106,0
|
107,3
|
104,7
|
B
|
Mining and quarrying
|
|
06
|
Vađenje sirove nafte i prirodnog
plina
|
4,85
|
103,9
|
107,2
|
106,0
|
06
|
Extraction of crude petroleum and
natural gas
|
|
08
|
Ostalo rudarstvo i vađenje
|
0,82
|
122,8
|
112,3
|
110,6
|
08
|
Other mining and quarrying
|
|
09
|
Pomoćne uslužne djelatnosti u
rudarstvu
|
0,68
|
100,4
|
100,9
|
94,4
|
09
|
Mining support service activities
|
|
|
|
|
|
|
|
|
|
|
C
|
Prerađivačka industrija
|
81,77
|
103,9
|
100,2
|
99,6
|
C
|
Manufacturing
|
|
10
|
Proizvodnja prehrambenih proizvoda
|
16,11
|
94,9
|
93,0
|
100,2
|
10
|
Manufacture of food products
|
|
11
|
Proizvodnja pića
|
4,91
|
101,4
|
97,5
|
98,2
|
11
|
Manufacture of beverages
|
|
12
|
Proizvodnja duhanskih proizvoda
|
0,98
|
101,6
|
91,1
|
108,1
|
12
|
Manufacture of tobacco products
|
|
13
|
Proizvodnja tekstila
|
0,93
|
105,8
|
86,4
|
103,5
|
13
|
Manufacture of textiles
|
|
14
|
Proizvodnja odjeće
|
2,55
|
95,4
|
95,5
|
100,9
|
14
|
Manufacture of wearing apparel
|
|
15
|
Proizvodnja kože i srodnih
proizvoda
|
1,78
|
131,5
|
142,9
|
117,9
|
15
|
Manufacture of leather and related
products
|
|
16
|
Prerada drva i proizvoda od drva i
pluta,
osim namještaja; proizvodnja proizvoda
od slame i pletarskih materijala
|
3,26
|
113,9
|
101,9
|
104,2
|
16
|
Manufacture of wood and of
products of wood and cork, except furniture; manufacture of articles of
straw and plaiting materials
|
|
17
|
Proizvodnja papira i proizvoda od
papira
|
2,41
|
101,5
|
100,3
|
97,6
|
17
|
Manufacture of paper and paper
products
|
|
18
|
Tiskanje i umnožavanje snimljenih
zapisa
|
2,31
|
90,7
|
89,0
|
94,8
|
18
|
Printing and reproduction of
recorded media
|
|
19
|
Proizvodnja koksa i rafiniranih
naftnih
proizvoda
|
1,84
|
130,3
|
115,1
|
86,4
|
19
|
Manufacture of coke and refined
petroleum products
|
|
20
|
Proizvodnja kemikalija i kemijskih
proizvoda
|
2,81
|
115,4
|
108,3
|
94,6
|
20
|
Manufacture of chemicals and
chemical products
|
|
21
|
Proizvodnja osnovnih farmaceutskih
proizvoda i farmaceutskih pripravaka
|
5,02
|
103,9
|
125,2
|
100,4
|
21
|
Manufacture of basic
pharmaceutical products and pharmaceutical preparations
|
|
22
|
Proizvodnja proizvoda od gume i
plastike
|
2,71
|
105,9
|
108,2
|
127,6
|
22
|
Manufacture of rubber and plastic
products
|
|
23
|
Proizvodnja ostalih nemetalnih
mineralnih proizvoda
|
5,51
|
108,9
|
103,3
|
96,8
|
23
|
Manufacture of other non-metallic
mineral products
|
|
24
|
Proizvodnja metala
|
2,04
|
91,6
|
81,3
|
83,8
|
24
|
Manufacture of basic metals
|
|
25
|
Proizvodnja gotovih metalnih
proizvoda,
osim strojeva i opreme
|
6,36
|
109,7
|
102,6
|
95,0
|
25
|
Manufacture of fabricated metal
products, except machinery and equipment
|
|
26
|
Proizvodnja računala te
elektroničkih
i optičkih proizvoda
|
1,55
|
84,7
|
80,9
|
100,2
|
26
|
Manufacture of computer,
electronic and optical products
|
|
27
|
Proizvodnja električne opreme
|
4,59
|
109,5
|
106,3
|
111,7
|
27
|
Manufacture of electrical
equipment
|
|
28
|
Proizvodnja strojeva i uređaja, d.
n.
|
4,03
|
102,1
|
84,3
|
87,5
|
28
|
Manufacture of machinery and
equipment n. e. c.
|
|
29
|
Proizvodnja motornih vozila,
prikolica
i poluprikolica
|
0,31
|
86,5
|
105,8
|
91,9
|
29
|
Manufacture of motor vehicles,
trailers and semi-trailers
|
|
30
|
Proizvodnja ostalih prijevoznih
sredstava
|
1,62
|
112,4
|
123,3
|
134,4
|
30
|
Manufacture of other transport
equipment
|
|
31
|
Proizvodnja namještaja
|
2,75
|
106,7
|
104,1
|
98,1
|
31
|
Manufacture of furniture
|
|
32
|
Ostala prerađivačka industrija
|
0,62
|
84,7
|
80,2
|
82,7
|
32
|
Other manufacturing
|
|
33
|
Popravak i instaliranje strojeva i
opreme
|
4,77
|
106,4
|
96,6
|
92,8
|
33
|
Repair and installation of
machinery and equipment
|
|
|
|
|
|
|
|
|
|
|
D
|
Opskrba električnom energijom,
plinom, parom
i klimatizacija
|
11,88
|
97,2
|
103,1
|
102,5
|
D
|
Electricity, gas, steam and air
conditioning supply
|
|
35
|
Opskrba električnom energijom,
plinom, parom
i klimatizacija
|
11,88
|
97,2
|
103,1
|
102,5
|
35
|
Electricity, gas, steam and air
conditioning supply
|
2. ZALIHE GOTOVIH PROIZVODA PRI PROIZVOĐAČIMA
– IZVORNI INDEKSI VOLUMENA, UKUPNO, PREMA GIG-u 2009.
TE PODRUČJIMA I ODJELJCIMA NKD-a 2007. U TRAVNJU 2015.
PRODUCERS’
STOCK OF FINISHED PRODUCTS – GROSS VOLUME INDICES, TOTAL, ACCORDING TO MIGs
2009.
AND TO NKD 2007. SECTIONS AND DIVISIONS, APRIL 2015
|
|
|
Struktura
Structure
|
IV. 2015.
Æ 2014.
|
IV. 2015.
III. 2015.
|
IV. 2015.
IV. 2014.
|
|
|
|
|
|
|
|
|
|
|
|
|
|
Ukupno industrija
|
100,00
|
96,6
|
98,8
|
92,8
|
|
Total industry
|
|
|
|
|
|
|
|
|
|
|
|
Prema GIG-u 2009.
|
|
|
|
|
|
According to main industrial
groupings − MIGs 2009.
|
|
AI
|
Intermedijarni proizvodi
|
36,64
|
92,8
|
102,2
|
92,7
|
AI
|
Intermediate goods
|
|
AE
|
Energija
|
9,21
|
80,2
|
83,0
|
77,2
|
AE
|
Energy
|
|
BB
|
Kapitalni proizvodi
|
4,39
|
117,2
|
98,3
|
100,0
|
BB
|
Capital goods
|
|
CD
|
Trajni proizvodi za široku
potrošnju
|
3,15
|
102,5
|
104,8
|
104,0
|
CD
|
Durable consumer goods
|
|
CN
|
Netrajni proizvodi za široku
potrošnju
|
46,61
|
100,5
|
99,0
|
94,3
|
CN
|
Non-durable consumer goods
|
|
|
|
|
|
|
|
|
|
|
|
Prema područjima i odjeljcima
NKD-a 2007.
|
|
|
|
|
|
According
to NKD 2007. sections and divisions
|
|
|
|
|
|
|
|
|
|
|
B
|
Rudarstvo i vađenje
|
5,55
|
96,1
|
100,8
|
98,4
|
B
|
Mining and quarrying
|
|
06
|
Vađenje sirove nafte i prirodnog
plina
|
2,54
|
102,4
|
106,4
|
110,3
|
06
|
Extraction of crude petroleum and
natural gas
|
|
08
|
Ostalo rudarstvo i vađenje
|
3,01
|
87,6
|
93,1
|
84,2
|
08
|
Other mining and quarrying
|
|
|
|
|
|
|
|
|
|
|
C
|
Prerađivačka industrija
|
94,45
|
96,7
|
98,7
|
92,6
|
C
|
Manufacturing
|
|
10
|
Proizvodnja prehrambenih proizvoda
|
20,74
|
102,6
|
97,5
|
92,2
|
10
|
Manufacture of food products
|
|
11
|
Proizvodnja pića
|
9,87
|
103,6
|
98,0
|
92,9
|
11
|
Manufacture of beverages
|
|
12
|
Proizvodnja duhanskih proizvoda
|
2,78
|
114,3
|
104,2
|
114,2
|
12
|
Manufacture of tobacco products
|
|
13
|
Proizvodnja tekstila
|
2,51
|
82,8
|
96,2
|
86,3
|
13
|
Manufacture of textiles
|
|
14
|
Proizvodnja odjeće
|
1,67
|
81,3
|
96,8
|
85,1
|
14
|
Manufacture of wearing apparel
|
|
15
|
Proizvodnja kože i srodnih
proizvoda
|
0,38
|
67,4
|
84,7
|
70,9
|
15
|
Manufacture of leather and related
products
|
|
16
|
Prerada drva i proizvoda od drva i
pluta, osim namještaja; proizvodnja proizvoda od slame i pletarskih
materijala
|
3,79
|
105,8
|
95,8
|
105,3
|
16
|
Manufacture of wood and of
products of wood and cork, except furniture; manufacture of articles of
straw and plaiting materials
|
|
17
|
Proizvodnja papira i proizvoda od
papira
|
1,69
|
101,0
|
99,7
|
94,3
|
17
|
Manufacture of paper and paper
products
|
|
19
|
Proizvodnja koksa i rafiniranih
naftnih proizvoda
|
6,67
|
71,7
|
74,1
|
66,5
|
19
|
Manufacture of coke and refined
petroleum products
|
|
20
|
Proizvodnja kemikalija i kemijskih
proizvoda
|
8,59
|
96,4
|
114,6
|
95,2
|
20
|
Manufacture of chemicals and
chemical products
|
|
21
|
Proizvodnja osnovnih farmaceutskih
proizvoda
i farmaceutskih pripravaka
|
9,95
|
90,3
|
102,3
|
93,0
|
21
|
Manufacture of basic
pharmaceutical products and pharmaceutical preparations
|
|
22
|
Proizvodnja proizvoda od gume i
plastike
|
1,58
|
87,7
|
89,7
|
110,1
|
22
|
Manufacture of rubber and plastic
products
|
|
23
|
Proizvodnja ostalih nemetalnih
mineralnih
proizvoda
|
11,53
|
86,3
|
100,3
|
83,9
|
23
|
Manufacture of other non-metallic
mineral products
|
|
24
|
Proizvodnja metala
|
1,19
|
73,9
|
86,7
|
80,2
|
24
|
Manufacture of basic metals
|
|
25
|
Proizvodnja gotovih metalnih
proizvoda,
osim strojeva i opreme
|
2,66
|
114,1
|
101,7
|
119,2
|
25
|
Manufacture of fabricated metal
products,
except machinery and equipment
|
|
26
|
Proizvodnja računala te
elektroničkih i optičkih
proizvoda
|
0,16
|
95,0
|
85,3
|
102,2
|
26
|
Manufacture of computer,
electronic and optical
products
|
|
27
|
Proizvodnja električne opreme
|
2,73
|
121,0
|
111,9
|
126,2
|
27
|
Manufacture of electrical
equipment
|
|
28
|
Proizvodnja strojeva i uređaja, d.
n.
|
2,31
|
129,8
|
97,2
|
92,1
|
28
|
Manufacture of machinery and
equipment n. e. c.
|
|
29
|
Proizvodnja motornih vozila,
prikolica i poluprikolica
|
0,58
|
95,8
|
100,3
|
99,7
|
29
|
Manufacture of motor vehicles,
trailers and semi-trailers
|
|
30
|
Proizvodnja ostalih prijevoznih
sredstava
|
0,06
|
56,9
|
106,0
|
96,8
|
30
|
Manufacture of other transport
equipment
|
|
31
|
Proizvodnja namještaja
|
2,45
|
99,7
|
103,9
|
104,6
|
31
|
Manufacture of furniture
|
|
32
|
Ostala prerađivačka industrija
|
0,46
|
94,6
|
111,6
|
124,0
|
32
|
Other manufacturing
|
3. ZAPOSLENE OSOBE I PROIZVODNOST RADA U
INDUSTRIJI – IZVORNI INDEKSI VOLUMENA, UKUPNO, PREMA GIG-u 2009.
TE PODRUČJIMA I ODJELJCIMA NKD-a 2007.
KRAJEM TRAVNJA 2015.
INDUSTRIAL
PERSONS EMPLOYED AND LABOUR PRODUCTIVITY – GROSS VOLUME INDICES, TOTAL,
ACCORDING TO MIGs 2009.
AND TO NKD 2007. SECTIONS AND DIVISIONS, END OF APRIL 2015
|
|
|
Struktura
Structure
|
Zaposlene osobe
Persons employed
|
Proizvodnost rada
Labour productivity
|
|
|
|
|
|
IV. 2015.
Æ 2014.
|
IV. 2015.
III. 2015.
|
IV. 2015.
IV. 2014.
|
I.–IV. 2015.
I.–IV. 2014.
|
|
|
|
|
|
|
|
|
|
|
|
|
|
|
|
Ukupno
industrija
|
100,00
|
99,3
|
100,1
|
99,3
|
99,5
|
100,7
|
|
Industry –
total
|
|
|
Prema GIG-u
2009.
|
|
|
|
|
|
|
|
According
to MIGs 2009.
|
|
AI
|
Intermedijarni
proizvodi
|
30,73
|
100,3
|
100,3
|
99,9
|
100,2
|
102,2
|
AI
|
Intermediate
goods
|
|
AE
|
Energija
|
8,28
|
98,4
|
99,8
|
98,3
|
99,0
|
103,0
|
AE
|
Energy
|
|
BB
|
Kapitalni
proizvodi
|
20,38
|
99,3
|
99,9
|
99,5
|
99,6
|
95,8
|
BB
|
Capital
goods
|
|
CD
|
Trajni
proizvodi za široku potrošnju
|
4,74
|
94,3
|
100,5
|
92,4
|
93,0
|
106,1
|
CD
|
Durable
consumer goods
|
|
CN
|
Netrajni
proizvodi za široku potrošnju
|
35,87
|
99,4
|
100,1
|
100,1
|
99,9
|
100,6
|
CN
|
Non-durable
consumer goods
|
|
|
|
|
|
|
|
|
|
|
|
|
|
Prema
područjima i odjeljcima NKD-a 2007.
|
|
|
|
|
|
|
|
According
to NKD 2007. sections and divisions
|
|
B
|
Rudarstvo i
vađenje
|
2,56
|
95,9
|
100,7
|
95,1
|
95,6
|
109,5
|
B
|
Mining and
quarrying
|
|
06
|
Vađenje
sirove nafte i prirodnog plina
|
0,82
|
94,3
|
99,7
|
94,8
|
95,2
|
111,3
|
06
|
Extraction
of crude petroleum and natural gas
|
|
08
|
Ostalo
rudarstvo i vađenje
|
0,99
|
96,3
|
99,2
|
95,3
|
97,1
|
113,9
|
08
|
Other
mining and quarrying
|
|
09
|
Pomoćne
uslužne djelatnosti u rudarstvu
|
0,75
|
97,1
|
103,8
|
95,3
|
94,1
|
100,3
|
09
|
Mining
support service activities
|
|
C
|
Prerađivačka
industrija
|
90,82
|
99,4
|
100,0
|
99,5
|
99,6
|
100,0
|
C
|
Manufacturing
|
|
10
|
Proizvodnja
prehrambenih proizvoda
|
15,49
|
98,3
|
100,1
|
99,4
|
98,2
|
102,0
|
10
|
Manufacture
of food products
|
|
11
|
Proizvodnja
pića
|
2,75
|
97,3
|
100,3
|
98,2
|
97,6
|
100,6
|
11
|
Manufacture
of beverages
|
|
12
|
Proizvodnja
duhanskih proizvoda
|
0,38
|
92,0
|
98,5
|
93,7
|
101,5
|
106,5
|
12
|
Manufacture
of tobacco products
|
|
13
|
Proizvodnja
tekstila
|
1,70
|
102,4
|
100,1
|
99,7
|
103,3
|
100,2
|
13
|
Manufacture
of textiles
|
|
14
|
Proizvodnja
odjeće
|
7,46
|
97,5
|
99,7
|
96,5
|
98,6
|
102,3
|
14
|
Manufacture
of wearing apparel
|
|
15
|
Proizvodnja
kože i srodnih proizvoda
|
4,26
|
106,1
|
100,1
|
109,8
|
109,0
|
108,2
|
15
|
Manufacture
of leather and related products
|
|
16
|
Prerada
drva i proizvoda od drva i pluta, osim namještaja; proizvodnja proizvoda od
slame i pletarskih materijala
|
5,76
|
102,5
|
100,8
|
101,0
|
100,6
|
103,6
|
16
|
Manufacture
of wood and of products of wood and cork, except furniture; manufacture
of articles of straw and plaiting materials
|
|
17
|
Proizvodnja
papira i proizvoda od papira
|
2,25
|
99,4
|
101,0
|
99,9
|
99,5
|
98,1
|
17
|
Manufacture
of paper and paper products
|
|
18
|
Tiskanje i
umnožavanje snimljenih zapisa
|
2,34
|
100,7
|
100,0
|
100,7
|
100,1
|
94,7
|
18
|
Printing
and reproduction of recorded media
|
|
19
|
Proizvodnja
koksa i rafiniranih naftnih proizvoda
|
0,84
|
97,5
|
99,3
|
98,0
|
98,3
|
87,9
|
19
|
Manufacture
of coke and refined petroleum products
|
|
20
|
Proizvodnja
kemikalija i kemijskih proizvoda
|
6,68
|
90,7
|
98,6
|
87,1
|
88,0
|
107,5
|
20
|
Manufacture
of chemicals and chemical products
|
|
21
|
Proizvodnja
osnovnih farmaceutskih proizvoda
i farmaceutskih pripravaka
|
2,05
|
103,7
|
100,9
|
103,8
|
102,7
|
97,8
|
21
|
Manufacture
of basic pharmaceutical products and pharmaceutical preparations
|
|
22
|
Proizvodnja
proizvoda od gume i plastike
|
3,00
|
111,0
|
101,4
|
114,2
|
113,4
|
112,5
|
22
|
Manufacture
of rubber and plastic products
|
|
23
|
Proizvodnja
ostalih nemetalnih mineralnih proizvoda
|
3,78
|
96,5
|
100,5
|
95,8
|
96,0
|
100,8
|
23
|
Manufacture
of other non-metallic mineral products
|
|
24
|
Proizvodnja
metala
|
2,19
|
99,8
|
100,1
|
97,6
|
97,4
|
86,0
|
24
|
Manufacture
of basic metals
|
|
25
|
Proizvodnja
gotovih metalnih proizvoda,
osim strojeva i opreme
|
8,47
|
98,3
|
99,6
|
97,8
|
98,6
|
96,3
|
25
|
Manufacture
of fabricated metal products,
except machinery and equipment
|
|
26
|
Proizvodnja
računala te elektroničkih i optičkih proizvoda
|
2,12
|
99,6
|
98,9
|
101,1
|
101,1
|
99,1
|
26
|
Manufacture
of computer, electronic and optical products
|
|
27
|
Proizvodnja
električne opreme
|
4,40
|
101,7
|
99,3
|
104,1
|
104,5
|
106,9
|
27
|
Manufacture
of electrical equipment
|
|
28
|
Proizvodnja
strojeva i uređaja, d. n.
|
4,92
|
100,4
|
98,7
|
100,5
|
102,7
|
85,2
|
28
|
Manufacture
of machinery and equipment n. e. c.
|
|
29
|
Proizvodnja
motornih vozila, prikolica i poluprikolica
|
0,60
|
105,4
|
100,4
|
105,2
|
109,5
|
83,9
|
29
|
Manufacture
of motor vehicles,
trailers and semi-trailers
|
|
30
|
Proizvodnja
ostalih prijevoznih sredstava
|
4,64
|
101,6
|
101,4
|
104,9
|
102,4
|
131,3
|
30
|
Manufacture
of other transport equipment
|
|
31
|
Proizvodnja
namještaja
|
4,49
|
94,7
|
100,7
|
92,5
|
93,1
|
105,4
|
31
|
Manufacture
of furniture
|
|
32
|
Ostala
prerađivačka industrija
|
0,76
|
90,2
|
99,3
|
91,9
|
89,7
|
92,2
|
32
|
Other
manufacturing
|
|
33
|
Popravak i
instaliranje strojeva i opreme
|
3,49
|
95,8
|
100,2
|
93,6
|
93,7
|
99,0
|
33
|
Repair and
installation of machinery and equipment
|
|
D
|
Opskrba
električnom energijom, plinom,
parom i klimatizacija
|
6,62
|
99,2
|
100,0
|
99,3
|
99,5
|
103,0
|
D
|
Electricity,
gas, steam and air conditioning
supply
|
|
35
|
Opskrba
električnom energijom, plinom,
parom i klimatizacija
|
6,62
|
99,2
|
100,0
|
99,3
|
99,5
|
103,0
|
35
|
Electricity,
gas, steam and air conditioning
supply
|
III. DODATAK – INDEKSI OBUJMA INDUSTRIJSKE
PROIZVODNJE – VREMENSKE SERIJE
ANNEX – INDUSTRIAL PRODUCTION VOLUME
INDICES – TIME SERIES
1. UKUPNO INDUSTRIJA I PREMA GIG-u 2009. –
IZVORNI INDEKSI I KALENDARSKI PRILAGOĐENI INDEKSI
TOTAL INDUSTRY AND ACCORDING TO MIGs 2009.
– GROSS AND WORKING-DAY ADJUSTED INDICES
Æ 2010. = 100
|
|
Izvorni indeksi
Gross indices
|
Kalendarski prilagođeni indeksi
Working-day adjusted indices
|
|
|
ukupno
Total
|
Intermedijarni proizvodi
Intermediate
goods
|
Energija
Energy
|
Kapitalni proizvodi
Capital
goods
|
Trajni proizvodi
za široku potrošnju
Durable
consumer goods
|
Netrajni proizvodi
za široku potrošnju
Non-durable
consumer goods
|
ukupno
Total
|
Intermedijarni proizvodi
Intermediate
goods
|
Energija
Energy
|
Kapitalni proizvodi
Capital
goods
|
Trajni proizvodi
za široku potrošnju
Durable
consumer goods
|
Netrajni proizvodi
za široku potrošnju
Non-durable
consumer goods
|
|
|
|
|
|
|
|
|
|
|
|
|
|
|
|
|
2013.
|
|
|
|
|
|
|
|
|
|
|
|
|
|
|
|
IV.
|
93,9
|
90,6
|
94,0
|
96,1
|
85,7
|
94,7
|
92,1
|
90,2
|
93,9
|
95,7
|
86,0
|
94,1
|
|
V.
|
95,5
|
96,1
|
92,2
|
89,3
|
88,9
|
99,9
|
94,7
|
95,3
|
92,1
|
88,5
|
86,4
|
98,6
|
|
VI.
|
91,3
|
89,2
|
84,4
|
85,1
|
88,4
|
99,9
|
93,8
|
91,6
|
84,5
|
87,6
|
90,6
|
103,5
|
|
VII.
|
97,6
|
94,8
|
85,3
|
91,6
|
93,1
|
110,6
|
95,2
|
92,6
|
85,1
|
89,4
|
92,0
|
107,0
|
|
VIII.
|
86,1
|
75,5
|
99,7
|
72,0
|
71,4
|
90,9
|
88,0
|
77,6
|
99,8
|
74,3
|
70,4
|
94,0
|
|
IX.
|
90,4
|
89,0
|
82,6
|
91,0
|
94,7
|
95,0
|
90,0
|
88,6
|
82,5
|
90,6
|
96,1
|
94,4
|
|
X.
|
95,1
|
93,5
|
84,9
|
95,8
|
100,5
|
101,7
|
94,2
|
92,6
|
84,8
|
95,0
|
100,0
|
100,4
|
|
XI.
|
95,2
|
84,1
|
87,3
|
106,8
|
90,6
|
104,7
|
96,2
|
85,2
|
87,3
|
107,7
|
91,8
|
106,1
|
|
XII.
|
89,0
|
74,6
|
96,8
|
86,4
|
81,2
|
96,0
|
91,0
|
76,8
|
96,8
|
88,5
|
83,1
|
99,1
|
|
|
|
|
|
|
|
|
|
|
|
|
|
|
|
|
|
|
|
|
|
|
|
|
|
|
|
|
|
|
2014.
|
|
|
|
|
|
|
|
|
|
|
|
|
|
|
|
I.
|
85,2
|
73,0
|
99,2
|
85,5
|
80,2
|
83,8
|
85,7
|
73,7
|
99,2
|
86,2
|
76,9
|
84,9
|
|
II.
|
86,7
|
74,9
|
94,6
|
93,8
|
92,6
|
84,8
|
86,7
|
75,2
|
95,2
|
93,5
|
93,4
|
84,1
|
|
III.
|
94,9
|
91,7
|
87,3
|
98,6
|
96,2
|
97,2
|
97,0
|
93,6
|
87,4
|
100,5
|
98,3
|
100,2
|
|
IV.
|
94,5
|
93,1
|
83,3
|
97,7
|
96,3
|
98,2
|
92,6
|
91,4
|
83,1
|
95,8
|
94,7
|
95,4
|
|
V.
|
95,3
|
96,6
|
82,9
|
94,4
|
96,6
|
99,2
|
95,9
|
97,1
|
82,9
|
95,0
|
96,2
|
100,0
|
|
VI.
|
89,8
|
88,0
|
74,9
|
86,4
|
91,4
|
100,3
|
92,2
|
90,3
|
75,1
|
88,9
|
94,3
|
103,9
|
|
VII.
|
98,9
|
97,2
|
81,7
|
91,3
|
100,8
|
113,3
|
96,5
|
95,0
|
81,5
|
89,1
|
98,4
|
109,7
|
|
VIII.
|
80,8
|
79,0
|
81,1
|
71,8
|
64,0
|
85,3
|
83,9
|
82,4
|
81,4
|
75,5
|
69,1
|
90,6
|
|
IX.
|
95,4
|
94,8
|
76,4
|
93,5
|
104,7
|
105,9
|
93,4
|
93,0
|
76,2
|
91,7
|
103,4
|
103,0
|
|
X.
|
97,7
|
93,1
|
83,3
|
100,9
|
98,6
|
106,5
|
96,8
|
92,2
|
83,3
|
100,0
|
96,0
|
105,1
|
|
XI.
|
97,8
|
85,3
|
90,0
|
99,6
|
104,2
|
110,2
|
98,9
|
86,3
|
90,1
|
100,5
|
104,4
|
111,5
|
|
XII.
|
95,2
|
85,3
|
96,9
|
87,6
|
77,2
|
105,8
|
95,8
|
85,9
|
96,9
|
88,3
|
79,9
|
106,5
|
|
|
|
|
|
|
|
|
|
|
|
|
|
|
|
|
|
|
|
|
|
|
|
|
|
|
|
|
|
|
2015.
|
|
|
|
|
|
|
|
|
|
|
|
|
|
|
|
I.
|
79,7
|
71,5
|
96,1
|
72,2
|
69,4
|
79,2
|
81,5
|
73,7
|
96,2
|
74,4
|
71,2
|
82,5
|
|
II.
|
87,0
|
78,7
|
90,8
|
91,2
|
93,5
|
86,8
|
88,3
|
80,4
|
91,5
|
92,3
|
95,8
|
88,2
|
|
III.
|
99,8
|
95,5
|
97,2
|
100,1
|
100,2
|
102,0
|
100,4
|
96,1
|
97,1
|
100,6
|
100,6
|
102,8
|
|
IV.
|
95,7
|
95,0
|
87,9
|
94,6
|
97,7
|
98,1
|
93,7
|
93,2
|
87,7
|
92,8
|
96,3
|
95,3
|
2. INDEKSI
OBUJMA INDUSTRIJSKE PROIZVODNJE, UKUPNO I PREMA GIG-u 2009. – DESEZONIRANI
INDEKSI I TREND
INDUSTRIAL PRODUCTION
VOLUME INDICES, TOTAL AND ACCORDING TO MIGs 2009. – SEASONALLY ADJUSTED
INDICES AND TREND
Æ 2010. = 100
|
|
Desezonirani indeksi
Seasonally adjusted indices
|
Trend
Trend
|
|
|
ukupno
Total
|
Intermedijarni proizvodi
Intermediate
goods
|
Energija
Energy
|
Kapitalni proizvodi
Capital
goods
|
Trajni proizvodi
za široku potrošnju
Durable
consumer goods
|
Netrajni proizvodi
za široku potrošnju
Non-durable
consumer goods
|
ukupno
Total
|
Intermedijarni proizvodi
Intermediate
goods
|
Energija
Energy
|
Kapitalni proizvodi
Capital
goods
|
Trajni proizvodi
za široku potrošnju
Durable
consumer goods
|
Netrajni proizvodi
za široku potrošnju
Non-durable
consumer goods
|
|
|
|
|
|
|
|
|
|
|
|
|
|
|
|
|
2013.
|
|
|
|
|
|
|
|
|
|
|
|
|
|
|
|
IV.
|
92,4
|
85,5
|
95,0
|
92,5
|
83,2
|
96,3
|
92,3
|
86,1
|
94,6
|
91,0
|
86,5
|
96,9
|
|
V.
|
90,3
|
85,3
|
95,9
|
82,5
|
81,5
|
94,4
|
92,0
|
85,9
|
94,5
|
89,2
|
86,8
|
96,8
|
|
VI.
|
92,1
|
86,9
|
92,7
|
86,6
|
88,6
|
98,6
|
91,9
|
85,7
|
92,0
|
88,8
|
87,7
|
96,7
|
|
VII.
|
91,2
|
85,5
|
87,7
|
92,3
|
90,2
|
95,4
|
91,8
|
85,4
|
89,4
|
89,4
|
88,6
|
96,6
|
|
VIII.
|
92,9
|
82,8
|
103,1
|
88,1
|
90,6
|
96,4
|
91,7
|
85,1
|
89,4
|
89,9
|
89,2
|
96,6
|
|
IX.
|
89,3
|
82,6
|
91,2
|
88,9
|
91,2
|
92,1
|
91,6
|
85,1
|
89,9
|
90,7
|
89,7
|
96,6
|
|
X.
|
90,5
|
85,0
|
88,0
|
90,7
|
92,5
|
95,6
|
91,7
|
85,3
|
88,5
|
92,1
|
89,8
|
96,9
|
|
XI.
|
92,9
|
83,6
|
86,7
|
101,2
|
86,8
|
99,2
|
92,0
|
85,6
|
87,4
|
93,2
|
89,8
|
97,2
|
|
XII.
|
90,5
|
84,0
|
87,5
|
87,8
|
89,6
|
95,9
|
92,3
|
86,2
|
87,6
|
93,4
|
89,9
|
97,5
|
|
|
|
|
|
|
|
|
|
|
|
|
|
|
|
|
|
|
|
|
|
|
|
|
|
|
|
|
|
|
2014.
|
|
|
|
|
|
|
|
|
|
|
|
|
|
|
|
I.
|
96,2
|
93,1
|
88,4
|
96,7
|
87,6
|
100,2
|
92,6
|
86,9
|
88,6
|
93,5
|
90,2
|
97,8
|
|
II.
|
92,9
|
86,2
|
90,1
|
93,8
|
92,8
|
98,2
|
92,7
|
87,1
|
87,8
|
93,4
|
90,7
|
98,1
|
|
III.
|
93,7
|
89,5
|
82,4
|
93,9
|
91,0
|
100,7
|
92,5
|
87,2
|
85,1
|
92,9
|
91,2
|
98,2
|
|
IV.
|
91,8
|
86,8
|
84,3
|
92,7
|
91,9
|
98,1
|
92,3
|
87,2
|
84,8
|
91,9
|
91,6
|
98,3
|
|
V.
|
91,5
|
87,2
|
86,6
|
89,2
|
91,4
|
96,3
|
92,0
|
87,2
|
85,5
|
90,9
|
91,9
|
98,4
|
|
VI.
|
90,6
|
85,8
|
83,4
|
88,2
|
92,3
|
98,9
|
91,9
|
87,3
|
84,8
|
90,5
|
92,3
|
98,5
|
|
VII.
|
92,4
|
88,0
|
84,3
|
91,9
|
96,6
|
98,3
|
91,9
|
87,5
|
84,6
|
90,6
|
92,6
|
98,7
|
|
VIII.
|
88,7
|
87,8
|
84,8
|
89,4
|
89,3
|
93,9
|
92,1
|
87,6
|
85,0
|
90,8
|
92,7
|
99,0
|
|
IX.
|
92,7
|
87,3
|
85,0
|
90,0
|
98,4
|
100,7
|
92,5
|
87,7
|
85,6
|
91,3
|
92,6
|
99,4
|
|
X.
|
93,0
|
85,1
|
86,5
|
95,6
|
88,6
|
100,3
|
93,0
|
87,9
|
87,0
|
91,7
|
92,4
|
99,9
|
|
XI.
|
95,5
|
85,2
|
89,3
|
93,8
|
99,4
|
104,0
|
93,5
|
88,5
|
88,3
|
91,3
|
91,9
|
100,3
|
|
XII.
|
95,3
|
92,9
|
87,6
|
87,7
|
86,4
|
103,1
|
93,8
|
89,3
|
87,7
|
90,2
|
91,2
|
100,5
|
|
|
|
|
|
|
|
|
|
|
|
|
|
|
|
|
|
|
|
|
|
|
|
|
|
|
|
|
|
|
2015.
|
|
|
|
|
|
|
|
|
|
|
|
|
|
|
|
I.
|
91,5
|
92,5
|
85,6
|
85,1
|
82,0
|
98,1
|
93,9
|
89,9
|
86,5
|
89,9
|
90,9
|
100,6
|
|
II.
|
94,6
|
91,2
|
86,4
|
92,5
|
95,1
|
102,1
|
94,2
|
90,1
|
87,8
|
90,5
|
91,4
|
100,8
|
|
III.
|
96,9
|
91,6
|
92,0
|
93,8
|
93,2
|
102,9
|
94,4
|
90,1
|
89,9
|
91,0
|
91,9
|
100,9
|
|
IV.
|
92,9
|
88,9
|
89,0
|
89,6
|
93,5
|
98,5
|
94,5
|
90,0
|
89,9
|
91,0
|
92,1
|
100,9
|
3. PODRUČJA I ODJELJCI NKD-a 2007. –
IZVORNI INDEKSI I KALENDARSKI PRILAGOĐENI INDEKSI
SECTIONS AND DIVISIONS OF NKD 2007. –
GROSS AND WORKING-DAY ADJUSTED INDICES
Æ 2010. = 100
|
Razine
NKD-a
2007.
|
Izvorni indeksi
Gross indices
|
Kalendarski prilagođeni indeksi
Working-day adjusted indices
|
NKD
2007.
levels
|
|
2014.
|
2015.
|
2014.
|
2015.
|
|
XI.
|
XII.
|
I.
|
II.
|
III.
|
IV.
|
XI.
|
XII.
|
I.
|
II.
|
III.
|
IV.
|
|
|
|
|
|
|
|
|
|
|
|
|
|
|
|
|
Područje B
|
75,5
|
77,1
|
75,9
|
69,2
|
78,0
|
77,7
|
75,3
|
77,0
|
75,7
|
69,8
|
77,8
|
77,8
|
Section B
|
|
06
|
73,3
|
78,4
|
78,2
|
70,0
|
74,8
|
72,9
|
73,3
|
77,9
|
77,0
|
70,0
|
76,7
|
72,2
|
06
|
|
08
|
94,5
|
72,1
|
53,1
|
55,4
|
93,8
|
100,6
|
95,7
|
73,1
|
54,9
|
57,3
|
94,7
|
100,2
|
08
|
|
09
|
69,2
|
69,9
|
70,1
|
65,0
|
70,1
|
74,2
|
70,0
|
69,5
|
70,2
|
64,9
|
70,2
|
73,8
|
09
|
|
|
|
|
|
|
|
|
|
|
|
|
|
|
|
|
Područje C
|
98,0
|
92,7
|
74,3
|
84,4
|
99,6
|
97,3
|
100,9
|
94,9
|
77,6
|
87,2
|
101,9
|
96,1
|
Section C
|
|
10
|
114,8
|
108,2
|
80,7
|
84,7
|
102,5
|
95,3
|
117,8
|
110,5
|
83,9
|
87,0
|
104,7
|
94,3
|
10
|
|
11
|
88,3
|
126,2
|
57,2
|
57,7
|
85,9
|
98,2
|
91,2
|
129,6
|
60,2
|
60,4
|
88,2
|
96,9
|
11
|
|
12
|
59,7
|
80,4
|
70,5
|
55,6
|
56,3
|
65,4
|
63,2
|
84,0
|
76,6
|
57,5
|
58,9
|
63,9
|
12
|
|
13
|
79,5
|
63,7
|
65,6
|
85,1
|
83,3
|
85,3
|
82,4
|
66,0
|
70,0
|
87,0
|
85,7
|
84,1
|
13
|
|
14
|
98,4
|
78,5
|
88,1
|
97,0
|
101,7
|
89,7
|
102,4
|
81,1
|
93,7
|
100,9
|
103,7
|
89,4
|
14
|
|
15
|
111,6
|
99,0
|
95,4
|
120,9
|
132,8
|
137,6
|
118,0
|
103,5
|
103,7
|
126,9
|
136,9
|
136,5
|
15
|
|
16
|
82,1
|
78,3
|
84,7
|
85,7
|
102,2
|
97,2
|
84,5
|
80,1
|
88,4
|
89,2
|
104,6
|
96,1
|
16
|
|
17
|
93,8
|
90,5
|
88,4
|
91,2
|
100,5
|
97,1
|
96,6
|
92,7
|
92,4
|
94,0
|
102,9
|
95,9
|
17
|
|
18
|
92,5
|
89,0
|
89,8
|
81,1
|
88,7
|
83,1
|
94,1
|
90,2
|
92,1
|
81,9
|
89,9
|
82,6
|
18
|
|
19
|
42,7
|
29,8
|
34,1
|
24,8
|
73,3
|
92,0
|
45,1
|
31,7
|
37,6
|
28,6
|
75,2
|
91,1
|
19
|
|
20
|
91,9
|
81,7
|
56,0
|
90,8
|
99,7
|
109,3
|
93,9
|
83,2
|
58,9
|
92,8
|
101,2
|
108,5
|
20
|
|
21
|
170,6
|
131,2
|
99,8
|
136,9
|
147,0
|
132,3
|
178,7
|
137,7
|
112,0
|
147,5
|
153,5
|
129,1
|
21
|
|
22
|
130,8
|
155,0
|
120,4
|
131,8
|
135,1
|
127,4
|
133,0
|
157,1
|
123,5
|
135,7
|
135,7
|
127,7
|
22
|
|
23
|
97,5
|
74,2
|
60,8
|
65,4
|
90,9
|
98,2
|
99,1
|
75,4
|
63,1
|
68,1
|
92,1
|
97,5
|
23
|
|
24
|
64,9
|
81,6
|
72,7
|
91,5
|
106,7
|
88,1
|
68,4
|
84,4
|
77,9
|
92,7
|
109,5
|
86,8
|
24
|
|
25
|
91,8
|
83,8
|
77,7
|
91,6
|
106,3
|
107,4
|
94,2
|
85,5
|
80,8
|
93,9
|
108,6
|
106,3
|
25
|
|
26
|
43,5
|
41,8
|
31,1
|
39,1
|
38,6
|
31,7
|
46,4
|
44,1
|
34,3
|
41,6
|
40,7
|
30,9
|
26
|
|
27
|
74,4
|
91,7
|
60,8
|
62,8
|
85,6
|
85,9
|
77,7
|
94,3
|
65,8
|
68,2
|
88,3
|
84,6
|
27
|
|
28
|
115,6
|
84,2
|
83,9
|
99,6
|
102,4
|
100,3
|
119,5
|
86,5
|
88,1
|
105,3
|
105,1
|
99,0
|
28
|
|
29
|
139,0
|
92,9
|
68,1
|
81,8
|
98,7
|
96,2
|
131,0
|
97,4
|
69,8
|
80,9
|
99,6
|
95,5
|
29
|
|
30
|
64,0
|
58,3
|
58,7
|
69,1
|
84,8
|
63,2
|
67,8
|
61,3
|
64,3
|
73,5
|
87,8
|
61,6
|
30
|
|
31
|
119,5
|
91,0
|
79,1
|
106,2
|
114,7
|
112,2
|
121,5
|
89,7
|
79,3
|
106,2
|
114,9
|
111,4
|
31
|
|
32
|
39,1
|
40,9
|
29,3
|
44,6
|
50,5
|
45,5
|
41,4
|
42,8
|
31,9
|
47,1
|
52,9
|
44,5
|
32
|
|
33
|
115,3
|
119,9
|
79,2
|
106,3
|
119,1
|
117,5
|
114,7
|
119,4
|
78,6
|
106,7
|
118,7
|
117,7
|
33
|
|
|
|
|
|
|
|
|
|
|
|
|
|
|
|
|
Područje D
|
106,9
|
118,6
|
116,3
|
113,7
|
111,7
|
92,8
|
106,7
|
118,4
|
116,0
|
114,4
|
111,6
|
92,9
|
Section D
|
|
35
|
106,9
|
118,6
|
116,3
|
113,7
|
111,7
|
92,8
|
106,7
|
118,4
|
116,0
|
114,4
|
111,6
|
92,9
|
35
|
|
|
|
|
|
|
|
|
|
|
|
|
|
|
|
|
4. PODRUČJA
I ODJELJCI NKD-a 2007. – DESEZONIRANI INDEKSI I TREND
SECTIONS
AND DIVISIONS OF NKD 2007. – SEASONALLY ADJUSTED INDICES AND TREND
Æ 2010. = 100
|
Razine
NKD-a
2007.
|
Desezonirani indeksi
Seasonally adjusted indices
|
Trend
Trend
|
NKD
2007.
levels
|
|
2014.
|
2015.
|
2014.
|
2015.
|
|
XI.
|
XII.
|
I.
|
II.
|
III.
|
IV.
|
XI.
|
XII.
|
I.
|
II.
|
III.
|
IV.
|
|
|
|
|
|
|
|
|
|
|
|
|
|
|
|
|
Područje B
|
74,6
|
78,5
|
80,2
|
78,6
|
77,0
|
76,7
|
75,1
|
76,1
|
76,8
|
76,9
|
76,7
|
76,5
|
Section B
|
|
06
|
72,6
|
73,0
|
73,4
|
74,3
|
73,4
|
72,5
|
72,3
|
72,8
|
73,2
|
73,3
|
73,1
|
72,8
|
06
|
|
08
|
88,3
|
94,7
|
100,9
|
92,0
|
95,3
|
91,2
|
87,0
|
91,7
|
94,1
|
94,1
|
93,5
|
92,9
|
08
|
|
09
|
71,0
|
71,3
|
70,8
|
69,3
|
71,0
|
73,2
|
72,1
|
71,5
|
71,1
|
71,0
|
71,2
|
71,5
|
09
|
|
|
|
|
|
|
|
|
|
|
|
|
|
|
|
|
Područje C
|
95,6
|
95,0
|
90,9
|
95,1
|
97,9
|
93,7
|
94,1
|
94,1
|
94,1
|
94,6
|
95,1
|
95,1
|
Section C
|
|
10
|
106,0
|
110,9
|
99,6
|
101,7
|
105,7
|
96,9
|
103,0
|
103,4
|
102,9
|
102,5
|
102,2
|
101,7
|
10
|
|
11
|
103,2
|
102,6
|
95,4
|
98,0
|
102,5
|
98,2
|
100,0
|
100,1
|
100,2
|
100,2
|
100,3
|
100,4
|
11
|
|
12
|
57,3
|
64,1
|
101,6
|
70,4
|
59,1
|
57,3
|
63,2
|
62,7
|
62,3
|
61,7
|
61,0
|
60,2
|
12
|
|
13
|
73,7
|
74,2
|
79,4
|
84,0
|
77,1
|
78,4
|
78,9
|
78,5
|
78,8
|
79,0
|
78,7
|
78,3
|
13
|
|
14
|
94,5
|
90,0
|
92,1
|
91,3
|
92,0
|
89,0
|
93,0
|
92,1
|
91,7
|
91,4
|
90,9
|
90,2
|
14
|
|
15
|
110,8
|
111,0
|
107,6
|
117,0
|
121,4
|
124,8
|
110,5
|
112,1
|
114,0
|
116,2
|
118,5
|
120,5
|
15
|
|
16
|
80,1
|
86,0
|
93,6
|
90,8
|
92,2
|
86,7
|
86,1
|
86,8
|
87,6
|
87,9
|
88,0
|
87,8
|
16
|
|
17
|
92,9
|
97,5
|
100,6
|
101,2
|
99,1
|
95,7
|
94,8
|
96,5
|
98,0
|
98,6
|
98,4
|
98,0
|
17
|
|
18
|
89,0
|
83,3
|
100,4
|
91,6
|
87,2
|
84,0
|
89,9
|
90,0
|
90,6
|
90,0
|
88,3
|
86,9
|
18
|
|
19
|
57,5
|
34,6
|
45,4
|
43,2
|
78,0
|
94,0
|
79,2
|
79,0
|
78,8
|
78,6
|
78,5
|
78,3
|
19
|
|
20
|
93,1
|
92,2
|
93,0
|
95,9
|
89,9
|
99,0
|
93,9
|
93,9
|
93,9
|
93,9
|
93,9
|
93,9
|
20
|
|
21
|
143,8
|
130,4
|
117,8
|
127,2
|
131,1
|
129,4
|
132,3
|
129,4
|
125,5
|
126,1
|
127,8
|
127,3
|
21
|
|
22
|
129,0
|
175,7
|
145,5
|
148,4
|
129,8
|
122,3
|
124,0
|
122,8
|
121,0
|
119,7
|
117,9
|
116,3
|
22
|
|
23
|
94,9
|
92,4
|
93,6
|
92,1
|
91,5
|
90,1
|
92,2
|
93,1
|
92,8
|
92,2
|
91,2
|
90,4
|
23
|
|
24
|
68,1
|
97,1
|
85,4
|
92,7
|
97,2
|
79,5
|
83,5
|
86,0
|
88,9
|
90,4
|
89,8
|
87,6
|
24
|
|
25
|
88,4
|
89,0
|
95,5
|
95,2
|
100,8
|
100,0
|
94,1
|
94,2
|
95,0
|
96,1
|
97,0
|
97,5
|
25
|
|
26
|
44,7
|
42,4
|
33,0
|
40,1
|
39,2
|
29,8
|
34,9
|
34,8
|
34,7
|
34,6
|
34,5
|
34,3
|
26
|
|
27
|
68,3
|
86,8
|
88,1
|
72,4
|
79,3
|
80,0
|
79,8
|
80,1
|
80,0
|
79,4
|
78,9
|
78,6
|
27
|
|
28
|
105,9
|
87,2
|
96,0
|
99,9
|
94,4
|
91,9
|
94,1
|
94,5
|
94,8
|
95,1
|
94,8
|
94,4
|
28
|
|
29
|
118,3
|
104,0
|
87,3
|
88,9
|
87,4
|
102,0
|
116,1
|
103,7
|
93,7
|
90,2
|
92,7
|
98,9
|
29
|
|
30
|
62,9
|
66,2
|
71,4
|
71,2
|
77,2
|
55,9
|
65,2
|
66,3
|
67,4
|
67,7
|
66,8
|
65,1
|
30
|
|
31
|
117,1
|
92,9
|
88,3
|
103,8
|
106,6
|
110,0
|
110,3
|
111,1
|
111,5
|
112,4
|
113,4
|
114,2
|
31
|
|
32
|
42,6
|
44,5
|
38,8
|
51,0
|
52,4
|
44,6
|
50,4
|
48,9
|
48,2
|
48,1
|
48,0
|
47,6
|
32
|
|
33
|
109,1
|
117,9
|
80,1
|
105,6
|
111,8
|
110,9
|
112,4
|
113,3
|
111,5
|
109,4
|
110,1
|
111,0
|
33
|
|
|
|
|
|
|
|
|
|
|
|
|
|
|
|
|
Područje D
|
101,9
|
102,3
|
97,1
|
99,1
|
101,5
|
95,9
|
99,3
|
100,9
|
98,9
|
99,2
|
99,5
|
97,7
|
Section D
|
|
35
|
101,9
|
102,3
|
97,1
|
99,1
|
101,5
|
95,9
|
99,3
|
100,9
|
98,9
|
99,2
|
99,5
|
97,7
|
35
|
|
METODOLOŠKA
OBJAŠNJENJA
|
|
NOTES
ON METHODOLOGY
|
|
|
|
|
|
|
|
|
|
U ovom
priopćenju indeksi obujma industrijske proizvodnje prikazani su na
međugodišnjoj lančanoj osnovi i na stalnoj baznoj godini
2010. = 100 u skladu s Uredbom Vijeća EU-a o kratkoročnim
statistikama (Short-Term Statistics) br. 1165/98. i njezinim izmjenama
i dopunama. Državni zavod za statistiku mjesečno dostavlja indekse
industrijske proizvodnje u Eurostat te također objavljuje indeks
industrijske proizvodnje za Republiku Hrvatsku na internetskim stranicama http://ec.europa.eu/eurostat/euroindicators
za Glavne europske ekonomske pokazatelje (tzv. GEEP) prikazane na stalnoj
baznoj godini 2010. = 100, čime se omogućuje neposredna usporedba
kretanja industrijske proizvodnje između država članica. Indeks obujma
industrijske proizvodnje Republike Hrvatske potpuno je usklađen s europskim
standardima.
|
|
In this
first release, industrial production volume indices are presented on the
interannual chain basis and on the fix base year 2010 = 100, in
line with the Council Regulation (EC) concerning Short-Term Statistics No.
1165/98 and its amendments. The Croatian Bureau of Statistics submits the
industrial production index for the Republic of Croatia to Eurostat on the
monthly basis and publishes it on the Eurostat’s web site
http://ec.europa.eu/eurostat/euroindicators for the principal European
economic indicators (the so-called PEEIs) presented on the fix base year
2010 = 100, which provides for a direct comparison of the
development of the industrial production between the Member States. The
industrial production volume index for the Republic of Croatia is fully
harmonised with the European standards.
|
|
|
|
|
|
Obavještavamo
korisnike da se ovo priopćenje industrije br. 2.1.3./2015. po pravilu
objavljuje 29. u mjesecu u 11 sati za indekse iz prethodnoga izvještajnog
mjeseca. Točni datumi navedeni su u Kalendaru objavljivanja statističkih
podataka 2015., koji se može naći, osim u tiskanom obliku, i na
internetskim stranicama Državnog zavoda za statistiku www.dzs.hr.
|
|
We
kindly inform the users that this first release No. 2.1.3./2015 is usually
published on the 29th day in a month at 11 o’clock for indices
from the previous reference month. Accurate dissemination dates are listed
in the Calendar of Statistical Data Issues for 2015, which is available,
besides in the printed form, on the web site of the Croatian Bureau of
Statistics: www.dzs.hr.
|
|
|
|
|
|
|
|
|
|
Pravna
i metodološka osnova
|
|
Legal
and methodological framework
|
|
|
|
|
|
Indeksi
prikazani u ovom priopćenju izračunani su na temelju podataka prikupljenih
Mjesečnim istraživanjem o industrijskoj proizvodnji i zaposlenim osobama
(obrazac IND-1/KPS/M) u 2015. koje neposredno provodi Državni zavod za
statistiku na temelju Zakona o službenoj statistici (NN, br. 103/03.,
75/09. i 59/12.).
|
|
Indices
presented in this first release were calculated on the basis of data
collected in the Monthly Survey on Industrial Production and Persons
Employed (IND-1/KPS/M form) in 2015, which is directly carried out by the
Croatian Bureau of Statistics on the basis of the Official Statistics Act
(NN, Nos 103/03, 75/09 and 59/12).
|
|
|
|
|
|
Koncepti
i definicije koji se primjenjuju u istraživanju IND-1/KPS/M navedeni su u
Statističkim standardima za Mjesečno istraživanje o industrijskoj
proizvodnji i zaposlenim osobama (obrazac IND-1/KPS/M), a objavljeni su u
Narodnim novinama br. 11/09. Usklađeni su s konceptima i definicijama EU-a,
a posebno s temeljnom Uredbom Vijeća (EZ-a) br. 1165/98 i Uredbom Komisije
(EZ-a) br. 1503/2006. o definicijama varijabla te rokovima kompilacije i
objave.
|
|
Concepts
and definitions used in this survey are specified in the Statistical
Standards for the Monthly Survey on Industrial Production and Persons
Employed (IND-1/KPS/M form) published in the Official Gazette of the
Republic of Croatia No. 11/09. Concepts and definitions are harmonised with
the EU concepts and definitions and especially with the Council Regulation
(EC) No. 1165/98 and the Commission Regulation (EC) No. 1503/2006 on
definitions of variables and frequency of data compilation.
|
|
|
|
|
|
|
|
|
|
Pokrivenost
i obuhvat
|
|
Scope
and coverage
|
|
|
|
|
|
Istraživanjem
IND-1/KPS/M obuhvaćena su sva poduzeća i njihovi dijelovi s 20 i više
zaposlenih osoba (tzv. odrezani uzorak) koji se bave jednom ili više
industrijskih djelatnosti koje su navedene u područjima NKD-a 2007. (NN,
br. 58/07. i 72/07.), i to: B Rudarstvo i vađenje, C Prerađivačka
industrija i D Opskrba električnom energijom, plinom, parom i
klimatizacija, tj. njihovim odjeljcima 05 – 35 (osim skupine 35.3). U
istraživanju IND-1/KPS/M za 2015. obuhvaćeno je 1 911 poduzeća
(pravnih osoba i obrtnika). U travnju 2015. stopa odgovora je 99,1%, a
stopa procijenjenih obrazaca je 0,9%.
|
|
The
IND-1/KPS/M Survey covers enterprises and parts thereof employing 20 or
more persons (the so-called ‘cut-off’ sample) and performing one or several
industrial activities listed in the NKD 2007. sections B Mining and
quarrying, C Manufacturing and D Electricity, gas, steam and air
conditioning supply, that is, their divisions 05 – 35 except group 35.3
(NN, Nos 58/07 and 72/07). The IND-1/KPS/M Survey for 2015 covered
1 911 enterprises (legal entities and tradesmen). In April 2015. the
respones rate was 99.1%, while the estimation of non respond form was 0.9%.
|
|
|
|
|
|
|
|
|
|
Izvještajno
razdoblje i metoda prikupljanja podataka
|
|
Reference period
and data collection method
|
|
|
|
|
|
Izvještajno
razdoblje jest mjesec dana i poklapa se s kalendarskim mjesecom. Metoda
prikupljanja podataka u 2015. jest internetska aplikacija (tzv. CAWI).
Izvještajne jedinice neposredno ispunjavaju podatke na e-obrascu
IND-1/KPS/M, koji se nalazi na internetskim stranicama Državnog zavoda za
statistiku www.dzs.hr. Rok prikupljanja podataka svakog mjeseca po pravilu
se kreće od 1. do 14. u mjesecu za podatke iz prethodnoga izvještajnog
mjeseca.
|
|
The
reference period for data collection is one month and is identical to a calendar
month. The data collection method used in 2015 is a web-based application
(the so-called CAWI). Reporting units enter data directly to the
IND-1/KPS/M e-form, which is available on the web site of the Croatian
Bureau of Statistics: www.dzs.hr. The time schedule for data collection
ranges each month, as a rule, between 1st and 14th
day in a month for the previous reference month data.
|
|
|
|
|
|
|
|
|
|
|
|
|
|
INDEKSI
INDUSTRIJSKE PROIZVODNJE
|
|
INDUSTRIAL
PRODUCTION INDICES
|
|
|
|
|
|
|
|
|
|
Definicija
pokazatelja
|
|
Definition of
indicator
|
|
|
|
|
|
Indeks
fizičkog obujma industrijske proizvodnje važan je kratkoročni pokazatelj
poslovnog ciklusa kojim se mjere mjesečni rezultati industrijskog sektora.
S obzirom na njegovu periodiku i brzinu u kojoj je raspoloživ, on je središnji
i ažuran pokazatelj razvoja industrijskog sektora, koji je jedna od
najnestabilnijih sastavnica gospodarstva.
|
|
The
industrial production volume index is an important short-term indicator of
a business cycle that measures monthly results of the industrial sector.
Taking into account its periodicity and its rapid availability, it is a
central and up-to-date indicator of the development of the industrial
sector, which is one of the most volatile components of economy.
|
|
|
|
|
|
|
|
|
|
Indeksi
fizičkog obujma industrijske proizvodnje jesu indeksi gotovih industrijskih
proizvoda definirani Nomenklaturom industrijskih proizvoda (NIPUM 2009.).
|
|
Industrial
production volume indices are indices of finished industrial products
defined by the Nomenclature of Industrial Products (NIPUM 2009.).
|
|
|
|
|
|
Pod
gotovim proizvodom podrazumijeva se svaki proizvod koji je u procesu
proizvodnje dostigao odgovarajući stupanj izrade, a naveden je pod posebnom
šifrom i nazivom u NIPUM-u 2009.
|
|
A
finished product is every product that reached a certain level in the
production process and listed in the NIPUM 2009. under separate code and
heading.
|
|
|
|
|
|
|
|
|
|
Metoda kalkulacije1)
|
|
Calculation method1)
|
|
|
|
|
|
Indeksi
fizičkog obujma industrijske proizvodnje za različite razine
NKD-a 2007. izračunavaju se u dva koraka prema Laspeyresovoj formuli. U
prvom koraku indeksi se izračunavaju iz podataka o količinama pojedinačnih
proizvoda iz NIPUM-a 2009. i odgovarajućega ponderacijskoga koeficijenta,
koji je aproksimacija dodane vrijednosti pojedinačnih proizvoda. U drugom
koraku svi indeksi skupina i više razine ponderiraju se udjelom u dodanoj
vrijednosti pojedinačnih djelatnosti industrije po razinama NKD-a 2007.
Tako je definirana relativna važnost pojedinačnih razina NKD-a 2007. i
istodobno su nivelirane različite razine pokrivenosti.
|
|
Industrial
production volume indices for various levels of the NKD 2007. are
calculated in two stages according to the Laspeyres formula. In the first
stage, indices are calculated from quantity data on production of individual
products according to the NIPUM 2009. and an adequate weighting
coefficient, which represents an estimated value added of individual
products. In the second stage, all indices of groups and higher levels are
weighted with shares of value added of individual activities of industrial
production by the NKD 2007. levels. In this way, the relative importance of
individual levels is defined and, at the same time, different levels of
coverage are levelled.
|
|
|
|
|
|
|
|
|
|
Agregati
GIG-a 2009.
|
|
MIGs
2009. aggregates
|
|
|
|
|
|
Indeksi
za agregate GIG-a 2009. izračunavaju se jednako prema pretežnoj uporabi
proizvoda unutar iste skupine NKD-a 2007. Za izračunavanje agregiranih
indeksa od siječnja 2009. primjenjuju se nove definicije za agregate
GIG-a radi usklađivanja sa statističkim standardima EU-a.2)
|
|
Indices
for MIGs 2009. aggregates are calculated in the same way according to a
predominant end-use of products within the same NKD 2007. activity group.
Since January 2009, new definitions have been applied for MIGs aggregations
in the calculation of aggregated indices in regard of the further
harmonisation with the EU statistical standards.2)
|
|
|
|
|
|
Grupiranje
na razini skupina ili odjeljaka NKD-a 2007. prema GIG-u 2009. s abecednim
oznakama kratica izvršeno je na sljedeći način:
|
|
The
grouping at the level of the NKD 2007. groups or divisions according to the
MIGs 2009., using alphabetic marks of abbreviations, was done as follows:
|
|
|
|
|
|
Al
|
Intermedijarni proizvodi: odjeljci i skupine
NKD-a 2007.: 07 – 09, 10.6, 10.9, 13.1 – 13.3, 16, 17, 20.1 – 20.3, 20.5,
20.6, 22 – 24, 25.5 – 25.7, 25.9, 26.1, 26.8, 27.1 – 27.4 i 27.9
|
|
AI
|
Intermediate
goods: the NKD 2007. divisions and groups: 07 – 09, 10.6, 10.9, 13.1 –
13.3, 16, 17, 20.1 – 20.3, 20.5, 20.6, 22 – 24, 25.5 – 25.7, 25.9, 26.1,
26.8, 27.1 – 27.4 and 27.9
|
|
|
|
|
|
AE
|
Energija: odjeljci NKD-a 2007.: 05, 06, 19
i 35 (isključujući 35.3)
|
|
AE
|
Energy:
the NKD 2007. divisions: 05, 06, 19 and 35 (exluding 35.3)
|
|
|
|
|
|
BB
|
Kapitalni proizvodi: odjeljci i skupine
NKD-a 2007.: 25.1 – 25.4, 26.2, 26.3, 26.5, 26.6, 28, 29, 30.1 – 30.4, 32.5
i 33
|
|
BB
|
Capital
goods: the NKD 2007. divisions and groups: 25.1 – 25.4, 26.2, 26.3, 26.5,
26.6, 28, 29, 30.1 – 30.4, 32.5 and 33
|
|
|
|
|
|
CD
|
Trajni
proizvodi za široku potrošnju: odjeljci i skupine NKD-a 2007.: 26.4, 26.7,
27.5, 30.9, 31, 32.1 i 32.2
|
|
CD
|
Consumer
durables: the NKD 2007. divisions and groups: 26.4, 26.7, 27.5, 30.9, 31,
32.1 and 32.2
|
|
|
|
|
|
CN
|
Netrajni proizvodi za široku potrošnju:
odjeljci i skupine NKD-a 2007.: 10.1 – 10.5, 10.7, 10.8, 11, 12, 13.9, 14,
15, 18, 20.4, 21, 32.3, 32.4 i 32.9.
|
|
CN
|
Consumer
non-durables: the NKD 2007. divisions and groups: 10.1 – 10.5, 10.7, 10.8,
11, 12, 13.9, 14, 15, 18, 20.4, 21, 32.3, 32.4 and 32.9.
|
|
|
|
|
|
|
|
|
|
Ponderacijski
sustav
|
|
Weighting
system
|
|
|
|
|
|
Ponderacijski
koeficijenti pojedinačnih proizvoda iz NIPUM-a 2009. koji se upotrebljavaju
za izračun indeksa industrijske proizvodnje dodana su vrijednost za
jediničnu proizvodnju određenog proizvoda. Izračunani su na temelju
jediničnih vrijednosti iz istraživanja PRODCOM o industrijskoj proizvodnji
za 2010., a revidiraju se svake pete godine.
|
|
Weighting
coefficients of individual products of the NIPUM 2009. used in the
calculation of industrial production index represent the value added to the
unit production of a respective product. They are calculated on the basis
of unit values of the PRODCOM survey on industrial production for 2010 and
are revised every five years.
|
|
|
|
|
|
Ponderacijski
koeficijenti koji su se upotrebljavali od 2009. do 2012. bili su izračunani
na temelju istraživanja PRODCOM o industrijskoj proizvodnji za 2005., a oni
koji su se upotrebljavali od 2002. do 2008. bili su izračunani na temelju
Godišnjeg izvještaja industrije 2000.
|
|
Weighting
coefficients used in the period from 2009 to 2012 were calculated on the
basis of the PRODCOM Survey on Industrial Production for 2005 while those
used in the period from 2002 to 2008 were calculated on the basis of the
2000 Annual Report on Industry.
|
|
|
|
|
|
Struktura
industrijskih djelatnosti (struktura odjeljaka) izračunana je na temelju
bruto dodane vrijednosti proizvodnih čimbenika prema načelu čistih
djelatnosti u 2013. u Republici Hrvatskoj. Izračunana je na temelju
godišnjih statističkih rezultata Strukturno-poslovnog istraživanja za 2013.
Državnog zavoda za statistiku obradom godišnjih administrativnih podataka
Fine – Godišnji računi industrijskih poduzeća za 2013. te je ispravljena
rezultatima PRODCOM-ovih istraživanja o industrijskoj proizvodnji za 2013.
i indeksima fizičkog obujma industrijske proizvodnje za 2014. Struktura
odjeljaka ažurira se na početku svake godine za obračunavanje indeksa
obujma industrijske proizvodnje tekuće godine.
|
|
In the
Republic of Croatia, the structure of industrial activities (division
structure) was calculated on the basis of the gross value added of factor
costs by the pure activity principle in 2013. It was calculated on the
basis of 2013 annual statistical results of the Structural Business Survey
carried out by the Croatian Bureau of Statistics by processing annual
results taken over from administrative data of Fina – the Annual Accounts
of Industrial Enterprises in 2013. It was further corrected by the results
of the PRODCOM Survey on Industrial Production for 2013 and then by
industrial production volume indices for 2014. The division structure is
updated at the beginning of every year for the calculation of industrial
production volume indices in a current year.
|
|
|
|
|
|
Prikazivanje i
tumačenje kretanja obujma industrijske proizvodnje
|
|
Presentation and interpretation of movment in volume
of industrial production
|
|
|
|
|
|
Prikazivanje
i tumačenje indeksa obujma industrijske proizvodnje usklađeno je sa
zahtjevima Eurostata za prikazivanje kratkoročnih poslovnih pokazatelja te
Uredbom Vijeća (EZ-a) br. 1165/98. i njezinim izmjenama i dopunama.
|
|
The
presentation and interpretation of the industrial production volume indices
are in line with the Eurostat’s
requirements for the presentation of short-term business indicators and
with the Council Regulation No. 1165/98 and its amendments.
|
|
|
|
|
|
Kretanje
obujma industrijske proizvodnje prikazuje se i tumači stopama promjena
izračunanih na temelju desezoniranih i kalendarski prilagođenih indeksa.
Desezonirani indeksi primjenjuju se za mjesečnu usporedbu kretanja obujma
industrijske proizvodnje, a kalendarski prilagođeni indeksi za godišnju
usporedbu.
|
|
The movements in the industrial production volume
are presented and interpreted in relation to growth
rates calculated on the basis of seasonally adjusted and working-day
adjusted indices. Seasonally adjusted indices are used for teh monthly
comparison of movements in the industrial production volume and working-day
adjusted indices for the annual comparison.
|
|
|
|
|
|
|
|
|
|
Metoda
desezoniranja i kalendarskog prilagođavanja
|
|
Seasonal
and working-day adjustment method
|
|
|
|
|
|
Desezoniranje
i kalendarsko prilagođavanje provedeno je metodom TRAMO-SEATS na mjesečnoj
seriji indeksa koja počinje indeksom za siječanj 1998. za industriju ukupno
(područja B, C i D, isključujući skupinu 35.3 NKD-a 2007.) te za GIG 2009.
U serijama desezoniranih indeksa isključen je utjecaj slučajne sastavnice.
|
|
Seasonal
and working-day adjustment has been done by using the TRAMO-SEATS
method on the monthly index series, which starts with the January 1998
index for the total industry (sections B, C and D, excluding group 35.3 of
the NKD 2007.) as well as for the MIGs 2009. Series of seasonally adjusted
indices are thus in which a random component has been excluded.
|
|
|
|
|
|
Produljivanje
serije indeksa dodavanjem novih mjesečnih opažanja za svaki idući mjesec
može zbog svojstava primijenjene metode desezoniranja prouzročiti naknadne
ispravke već objavljenih desezoniranih i kalendarski prilagođenih indeksa
te trenda za nekoliko mjeseci unatrag.
|
|
Due to
the character of the implemented seasonal adjustment method, the extension
of index series, by adding of new monthly observations for each new month,
could cause subsequent corrections of already published seasonally and
working-day adjusted indices, and trend for several months backwards.
|
|
|
|
|
|
|
|
|
|
Desezonirani
indeksi
|
|
Seasonally
adjusted indices
|
|
|
|
|
|
Pod
pojmom "desezonirani indeksi" podrazumijeva se da su izvorni
indeksi prilagođeni za sezonu i kalendarske dane, u skladu sa zahtjevima
Eurostata za kratkoročne poslovne pokazatelje, a podaci koji se uspoređuju
s podacima iz prethodnog mjeseca (tj. mjesečna usporedba) prikazuju se u
desezoniranom obliku indeksa industrijske proizvodnje ili iz njih
izračunanih stopa rasta.
|
|
The
term seasonally adjusted indices indicates that gross indices are adjusted
for both seasonal and working-day effects. In line with the Eurostat’s
requirements for short-term business indicators, data that are compared to
those of the previous month (that is, monthly comparison) are presented in
a seasonally adjusted form of industrial production indices or their growth
rates.
|
|
|
|
|
|
U
skladu s tim u ovom priopćenju u mjesečnoj usporedbi (tablica 1.) prikazane
su i tumače se mjesečne stope promjena obujma industrijske proizvodnje
izračunane iz desezoniranih indeksa (usporedba indeksa izvještajnog mjeseca
s indeksima prethodnoga izvještajnog mjeseca).
|
|
In line
with the above mentioned, this first release in the monthly comparison
(table 1.) presents and interprets month-on-month growth rates of the
volume of industrial production calculated on the basis of seasonally
adjusted indices (the comparison between indices of the current reporting
month with indices of the previous reporting month).
|
|
|
|
|
|
|
|
|
|
Kalendarski
prilagođeni indeksi
|
|
Working-day
adjusted indices
|
|
|
|
|
|
Pod
pojmom "kalendarski prilagođeni indeksi" podrazumijeva se da su
izvorni indeksi prilagođeni za kalendarske dane u skladu sa zahtjevima
Eurostata za kratkoročne poslovne pokazatelje, a podaci koji se uspoređuju
s podacima od istog mjeseca prethodne godine (tj. godišnja usporedba)
prikazuju se u kalendarski prilagođenom obliku indeksa industrijske
proizvodnje ili iz njih izračunanih stopa rasta.
|
|
The
term working-day adjusted indices indicates that gross indices are adjusted
only for working-day effects in line with the Eurostat’s requirements for
short-term business indicators, while data compared to those of the same
month of a previous year (that is, annual comparison) are presented in a
working-day adjusted form of industrial production indices or growth rates
derived from them.
|
|
|
|
|
|
Prema
tome, u ovom su priopćenju u godišnjoj usporedbi (tablica 2.) prikazane i
tumače se godišnje stope promjena obujma industrijske proizvodnje
izračunane iz kalendarski prilagođenih indeksa (usporedba indeksa
izvještajnog mjeseca s indeksima istoga izvještajnog mjeseca prethodne
godine).
|
|
In line
with above mentioned, in this first release in annual comparison, (table
2.) year-on-year growth rates of the volume of industrial production
calculated on basis of working-day adjusted indices are presented and
interpreted (comparison between indices of reporting month with the indices
of the same reporting month of the previous year).
|
|
|
|
|
|
|
|
|
|
Izvorni
indeksi
|
|
Gross
indices
|
|
|
|
|
|
Pod
pojmom "izvorni indeksi" podrazumijevaju se neprilagođeni indeksi
za utjecaj sezone i kalendarskih dana. Izvorni indeksi obujma industrijske
proizvodnje prema preporukama i zahtjevima Eurostata ne primjenjuju se za
tumačenje kretanja obujma industrijske proizvodnje. Eurostat ih ne
objavljuje, a ni većina država članica nema praksu njihove objave. Ovdje su
dani (tablica 3.) radi informacije o strukturi djelatnosti samo za potrebe
korisnika i radi kontinuiteta u objavljivanju indeksa obujma industrijske
proizvodnje u Republici Hrvatskoj.
|
|
The
term “gross indices” indicates that indices are unadjusted for seasonal and
working-day effects. In line with the Eurostat’s recommendations and
requirements for the industrial production volume index, they are not used
for the interpretation of the movement of the industrial production volume.
Eurostat does not publish them, neither is it the pratice in the most
Members States. They are presented here (table 3.) just for the information
on the activity structure for users’ needs and the continuity of publishing
of the industrial production volume indices in the Republic of Croatia.
|
|
|
|
|
|
|
|
|
|
INDEKSI ZALIHA
GOTOVIH PROIZVODA
PRI PROIZVOĐAČIMA
|
|
INDICES OF
PRODUCERS' STOCK OF FINISHED PRODUCTS
|
|
|
|
|
|
|
|
|
|
Definicija
pokazatelja
|
|
Definition
of indicator
|
|
|
|
|
|
Indeksi
zaliha gotovih industrijskih proizvoda pri proizvođačima jesu
lančani indeksi fizičkog obujma zaliha gotovih proizvoda iz Nomenklature
industrijskih proizvoda – NIPUM 2009.
|
|
Indices
of producers' stock of finished products are chain volume
indices of finished products as defined in the Nomenclature of Industrial
Products – NIPUM 2009.
|
|
|
|
|
|
Pod gotovim
proizvodom podrazumijeva se svaki proizvod koji je u procesu
proizvodnje dostigao odgovarajući stupanj izrade, a naveden je pod posebnom
šifrom i nazivom u NIPUM-u 2009.
|
|
A finished
product is every product that reached a certain level in the production
process and is listed under a separate code and heading in the NIPUM 2009.
|
|
|
|
|
|
|
|
Metoda
kalkulacije1)
|
|
Calculation
method1)
|
|
|
|
|
|
Indeksi
fizičkog obujma zaliha gotovih proizvoda u područjima B i C i njihovim
odjeljcima iz NKD-a 2007. te za industriju ukupno izračunani su na temelju
podataka o stanju zaliha posljednjeg dana izvještajnog mjeseca.
Izračunavaju se prema Laspeyresovoj formuli, kao i indeksi industrijske
proizvodnje. Indeksi o zalihama gotovih proizvoda izračunavaju se iz
podataka o stanju zaliha gotovih proizvoda iz NIPUM-a 2009. na kraju
izvještajnog mjeseca i odgovarajućega ponderacijskoga koeficijenta.
|
|
Volume
stock indices of finished products for B and C sections and divisions of
the NKD 2007. as well as for the total industry were calculated on the
basis of data on the state of stocks of finished products at the end of the
reporting month, using Laspeyres formula in the same way as for the
production indices. Stock indices of finished products are calculated on
the basis of data on the state of stocks of finished products according to
the NIPUM 2009. and an adequate weighting coefficient.
|
|
|
|
|
|
Indeksi
zaliha za agregate GIG-a 2009. izračunani su jednako prema pretežnoj
uporabi proizvoda unutar iste skupine NKD-a 2007. Usklađeni su sa
statističkim standardima EU-a.2)
|
|
Stock
indices for the MIGs 2009. aggregates are calculated in the same way by the
predominant end-use of products within the same NKD 2007. activity group.
They are harmonised with the EU statistical standards.2)
|
|
|
|
|
|
Ponderacijski
koeficijenti zaliha gotovih proizvoda iz NIPUM-a 2009. izračunani su na
temelju stalnih cijena, odnosno jediničnih vrijednosti iz istraživanja
PRODCOM o industrijskoj proizvodnji za 2010., a revidiraju se svake pete
godine. Ponderacijski koeficijenti koji su se upotrebljavali od 2002. do
2008. bili su izračunani na temelju Godišnjeg izvještaja industrije 2000.,
a oni koji su se upotrebljavali od 2009. do 2012. bili su izračunani na
temelju istraživanja PRODCOM o industrijskoj proizvodnji za 2005.
|
|
Weighting
coefficients of stocks of finished products, as defined in
the NIPUM 2009. were calculated on the basis of constant prices, that is,
unit values of the PRODCOM survey on industrial production for 2010,
providing that they are revised every five years. Weighting coefficients
used in the period from 2002 to 2008 were calculated on the basis of the
2000 Annual Report on Industry and those used in the period from
2009 to 2012 were calculated on the basis of the PRODCOM Survey on
Industrial Production for 2005.
|
|
|
|
|
|
Baza za
izračunavanje indeksa u 2015. jesu stanja zaliha ili prosječne godišnje
zalihe koje su izračunane na bazi 12 stanja zaliha gotovih industrijskih
proizvoda pri proizvođačima na kraju svakog mjeseca 2014.
|
|
The
basis for the calculation of volume indices of stocks in 2015 are the
states of stocks or average annual stocks, which were calculated on the
basis of 12 states of producers' stocks of industrial finished products at
the end of each month of 2014.
|
|
|
|
|
|
Indeksi
fizičkog obujma zaliha gotovih proizvoda pri proizvođačima prikazani u ovom
priopćenju nisu desezonirani niti su svedeni na isti broj radnih dana, što
treba uzeti u obzir pri interpretaciji rezultata.
|
|
Volume
indices of producers' stocks of industrial finished products presented in
this Release are not seasonally adjusted or working days adjusted, which
must be taken into account in the interpretation of the results.
|
|
|
|
|
|
|
|
|
|
|
|
|
|
INDEKSI
ZAPOSLENIH OSOBA I PRODUKTIVNOSTI RADA
|
|
INDICES OF
PERSONS EMPLOYED AND LABOUR PRODUCTIVITY
|
|
|
|
|
|
|
|
|
|
Definicije
pokazatelja
|
|
Definition
of indicators
|
|
|
|
|
|
|
|
|
|
Indeksi
zaposlenih osoba pokazuju dinamiku broja zaposlenih osoba
u industrijskim djelatnostima poduzeća isključujući zaposlene osobe koje u
istom poduzeću obavljaju neindustrijske djelatnosti.
|
|
Indices
of persons employed show the dynamics of the number of
persons employed in industrial activities of enterprises, excluding persons
employed in non-industrial activities of the same enterprise.
|
|
|
|
|
|
Zaposlene
osobe
jesu osobe koje rade za poslodavca u državnome ili privatnom sektoru i za
svoj rad primaju naknadu u novcu ili naturi. Obuhvaćaju se sve osobe koje
su zasnovale radni odnos s poslodavcem na određeno ili neodređeno vrijeme
neovisno o duljini radnog vremena i vlasništvu poslovnog subjekta te
vježbenici, osobe na rodiljnom dopustu, bolovanju i osobe koje su iz bilo
kojeg razloga odsutne s posla do prekida radnog odnosa.
|
|
Persons
employed are persons who work for an employer in
the state or private sector and are paid in cash or kind for their work.
This includes all persons who have signed a work contract with the employer
for a fixed or unspecified period of time, irrespective of type of
ownership and of whether they work full time or less than full time. This
also includes trainees, persons on maternity leave, sick leave or absent
from work for other reasons, until cessation of employment.
|
|
|
|
|
|
Zaposlene
osobe jesu i osobe koje trenutačno ili povremeno obavljaju posao na temelju
ugovora o djelu, autorskog ugovora i za plaćanje u gotovini ili naturi te
osobe koje su prema formalnom statusu umirovljenici, nezaposlene osobe ili
redoviti studenti. Zaposlenim osobama smatraju se i osobe koje rade u
vlastitome trgovačkom društvu, poduzeću ili obrtu.
|
|
Persons
employed are also persons who presently or occasionally work under the
contract or for payment in cash or kind as well as retired or unemployed
persons and regular students. Persons employed are also persons employed in
own trade company, enterprise, craft or free lances.
|
|
|
|
|
|
|
|
|
|
Metoda
kalkulacije1)
|
|
Calculation
method1)
|
|
|
|
|
|
Indeks
proizvodnosti rada izračunan je kao odnos indeksa fizičkog
obujma industrijske proizvodnje od početka godine do kraja izvještajnog mjeseca
i indeksa razine broja zaposlenih osoba u industriji, također od početka
godine do kraja izvještajnog mjeseca. Indeks razine označuje odnos tekućeg
razdoblja prema istom razdoblju prethodne godine.
|
|
The
labour productivity index was calculated as
a relation between the volume index of industrial production from the
beginning of a year until the end of a reference month and the level index
of the number of persons employed in industry, also from the beginning of a
year to the end of a reference month. The level index presents the
comparison of a current period with the same period of a previous year.
|
|
|
|
|
|
Jednako
su obračunani indeksi proizvodnosti rada za agregate GIG-a 2009. prema
pretežnoj djelatnosti na razini skupina NKD-a 2007., koji se objavljuju za
ovu vrstu pokazatelja radi usklađivanja sa statističkim standardima
EU-a.1)
|
|
Labour
productivity indices for MIGs 2009. aggregates are calculated in the same
way according to a prevailing activity at the NKD 2007. group level, which
are published for this type of indicators in order to harmonise them with
the EU statistical standards1).
|
|
|
|
|
|
Indeksi
zaposlenih osoba u industriji i indeksi proizvodnosti rada prikazani u ovom
priopćenju nisu desezonirani, što treba uzeti u obzir pri interpretaciji
rezultata.
|
|
Indices
of persons employed and labour productivity presented in this
release are not seasonally adjusted, which must be taken into account in
the interpretation of the results.
|
|
1)
|
Za
dodatne informacije treba se koristiti Studijama i analizama – Kratkoročni
pokazatelji industrije br. 85., Zagreb, 1999., DZS.
|
|
1)
|
Additional
information is available in the Studies and Analyses – Short-Term
Indicators on Industry, No. 85, Zagreb, 1999, CBS.
|
|
2)
|
Uredba
Komisije (EZ-a) br. 656/2007. od 14. lipnja 2007. o provedbi Uredbe Vijeća
(EZ-a) br. 1165/98. o kratkoročnim
statistikama u vezi s definicijama GIG-a
|
|
2)
|
The
Commission Regulation (EC) No. 656/2007 of 14 June 2007 on Implementing Council Regulation (EC) No.
1165/98 concerning short-term statistics as regards to the definitions of
Main Industrial Groupings (MIGs).
|
|
|
|
|
|
Kratice
|
|
Abbreviations
|
|
|
|
|
|
CAWI
|
razmjena
podataka internetom uz računalnu podršku
|
|
CAWI
|
computer-assisted
web interchange
|
|
d. n.
|
drugdje
nespomenuto
|
|
CBS
|
Croatian
Bureau of Statistics
|
|
DZS
|
Državni
zavod za statistiku
|
|
EC
|
European
Community
|
|
EU
|
Europska
unija
|
|
EU
|
European
Union
|
|
Eurostat
|
Statistički
ured Europske unije
|
|
Eurostat
|
Statistical
Office of the European Communities
|
|
EZ
|
Europska
zajednica
|
|
Fina
|
Financial
Agency
|
|
Fina
|
Financijska
agencija
|
|
MIGs
2009.
|
Main
Industrial Groupings, 2009 version
|
|
GIG
2009.
|
Glavne
industrijske grupacije, verzija 2009.
|
|
n. e.
c.
|
not
elsewhere classified
|
|
NKD
2007.
|
Nacionalna
klasifikacija djelatnosti, verzija 2007.
|
|
NIPUM
2009.
|
Nomenclature
of Industrial Products for Monthly
|
|
NN
|
Narodne
novine
|
|
|
survey
on Industrial Production, 2009 version
|
|
NIPUM
2009.
|
Nomenklatura
industrijskih proizvoda za Mjesečno
|
|
NKD
2007.
|
National
Classification of Activities, 2007 version
|
|
|
istraživanje
o industrijskoj proizvodnji, verzija 2009.
|
|
NN
|
Narodne novine,
official gazette
|
|
PRODCOM
|
Proizvodnja
u Zajednici
|
|
|
of the
Republic of Croatia
|
|
|
|
|
PRODCOM
|
PRODucts
of the European COMmunity
|
|
|
|
|
|
|
|
|
Objavljuje
i tiska Državni zavod za statistiku Republike Hrvatske, Zagreb, Ilica 3, p.
p. 80.
Published and printed by the Croatian
Bureau of Statistics, Zagreb, Ilica 3, P. O. B. 80
Telefon/ Phone:
+385 (0) 1 4806-111, telefaks/ Fax: +385 (0) 1 4817-666
Odgovara
ravnatelj Marko Krištof.
Person
responsible: Marko Krištof, Director General
Priredili: Jasna Pugar, Ivana Zoroja i
Mustafa Elezović
Prepared
by: Jasna Pugar, Ivana Zoroja and Mustafa Elezović
|
|
MOLIMO KORISNIKE DA PRI KORIŠTENJU
PODATAKA NAVEDU IZVOR.
USERS
ARE KINDLY REQUESTED TO STATE THE SOURCE
|
|
Naklada:
20 primjeraka
20 copies
printed
Podaci iz
ovog priopćenja objavljuju se i na internetu.
First
Release data are also published on the Internet.
Služba za
komunikaciju s korisnicima
User
Communication Department
|
· Informacije
i korisnički zahtjevi
Information
and user requests
|
· Pretplata
publikacija
Subscription
|
· Novinarski
upiti
Press corner
|
|
Telefon/ Phone:
+385 (0) 1 4806-138, 4806-154, 4811-212
Elektronička
pošta/ E-mail:
stat.info@dzs.hr
Telefaks/ Fax:
+385 (0) 1 4806-148, 4806-199
|
Telefon/ Phone:
+385 (0) 1 4814-791
Elektronička
pošta/ E-mail:
prodaja@dzs.hr
Telefaks/ Fax:
+385 (0) 1 4806-148, 4806-199
|
Telefon/ Phone:
+385 (0) 1 4806-121, 4806-196
Elektronička
pošta/ E-mail:
press@dzs.hr
Telefaks/ Fax:
+385 (0) 1 4806-148, 4806-199
|
|