|

GODINA/ YEAR: LII. ZAGREB,
8. TRAVNJA 2015. / 8 APRIL, 2015 BROJ/
NUMBER: 4.2.1/1.
ROBNA RAZMJENA REPUBLIKE HRVATSKE S INOZEMSTVOM
u siječnju 2015.1)
FOREIGN TRADE IN GOODS OF
THE REPUBLIC OF CROATIA
January 20151)
|
Ukupan
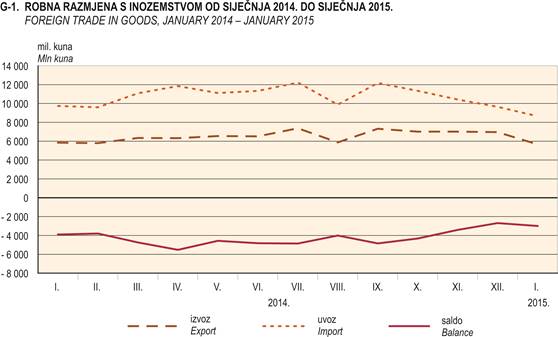
izvoz Republike Hrvatske u siječnju 2015., prema privremenim
podacima, iznosio je 5,7 milijardi kuna. Istodobno je uvoz iznosio 8,6
milijardi kuna. Vanjskotrgovinski deficit iznosio je 3,0 milijardi kuna.
|
|
According
to the provisional data, in January 2015, the total export of the Republic
of Croatia amounted to 5,7 billion kuna. At the same time, the import was
8,6 billion kuna. The foreign trade deficit amounted to 3,0 billion kuna.
|
|
|
|
|
|
Izvoz
je u siječnju 2015. iznosio 739,4
milijuna eura, a uvoz je iznosio 1,1 milijardu eura. Vanjskotrgovinski
deficit iznosio je 390,1 milijun eura.
|
|
In
January 2015, the export amounted to 739,4 million euros and the import to
1,1 billion euros, while the foreign trade deficit amounted to 390,1
million euros.
|
|
|
|
|
|
Izvoz
je u siječnju 2015. iznosio 899,7
milijuna američkih dolara, a uvoz je iznosio 1,4 milijarde američkih
dolara. Vanjskotrgovinski deficit iznosio je 474,0 milijuna američkih
dolara.
|
|
In
January 2015, the export amounted to 899,7 million American dollars, the import
to 1,4 billion American dollars and the foreign trade deficit to 474,0
million American dollars.
|
|
|
|
|
|
Pokrivenost
uvoza izvozom bila je 65,5%.
|
|
The
coverage of import by export was 65,5%.
|
1) Privremeni
podaci
1) Provisional data
1. ROBNA RAZMJENA REPUBLIKE HRVATSKE S
INOZEMSTVOM
FOREIGN
TRADE IN GOODS OF THE REPUBLIC OF CROATIA
|
|
Izvoz
Export
|
Uvoz
Import
|
Saldo robne razmjene
Balance
of foreign trade in goods
|
Pokrivenost
uvoza
izvozom, %
Coverage
of import by Export, %
|
|
|
tis. kuna
Thousand
kuna
|
tis. eura
Thousand
euros
|
tis. USD
Thousand
US
$
|
tis. kuna
Thousand
kuna
|
tis. eura
Thousand
euros
|
tis. USD
Thousand
US
$
|
tis. kuna
Thousand
kuna
|
tis. eura
Thousand
euros
|
tis. USD
Thousand
US
$
|
|
|
|
|
|
|
|
|
|
|
|
|
|
2014.
|
|
|
|
|
|
|
|
|
|
|
|
I.
|
5
848 117
|
766
684
|
1
054 837
|
9
739 597
|
1
276 871
|
1
756 850
|
-3
891 479
|
-510
187
|
-702
013
|
60,0
|
|
II.
|
5
796 367
|
758
113
|
1
026 165
|
9
595 588
|
1
254 662
|
1
698 059
|
-3
799 221
|
-496
548
|
-671
895
|
60,4
|
|
III.
|
6
344 593
|
828
614
|
1
141 559
|
11
088 913
|
1
448 414
|
1
996 366
|
-4
744 320
|
-619
799
|
-854
807
|
57,2
|
|
IV.
|
6
319 839
|
825
770
|
1
142 573
|
11
845 332
|
1
547 823
|
2
140 044
|
-5
525 492
|
-722
053
|
-997
471
|
53,4
|
|
V.
|
6
542 763
|
860
055
|
1
189 392
|
11
113 792
|
1
461 189
|
2
020 410
|
-4
571 029
|
-601
133
|
-831
018
|
58,9
|
|
VI.
|
6
514 299
|
857
471
|
1
170 058
|
11
341 594
|
1
493 281
|
2
036 714
|
-4
827 295
|
-635
810
|
-866
656
|
57,4
|
|
VII.
|
7
368 981
|
973
607
|
1
325 839
|
12
221 883
|
1
615 015
|
2
200 770
|
-4
852 902
|
-641
408
|
-874
930
|
60,3
|
|
VIII.
|
5
873 222
|
770
350
|
1
033 577
|
9
877 095
|
1
294 964
|
1
736 218
|
-4
003 873
|
-524
615
|
-702
641
|
59,5
|
|
IX.
|
7
323 356
|
961
212
|
1
270 878
|
12
168 787
|
1
596 583
|
2
108 281
|
-4
845 431
|
-635
370
|
-837
403
|
60,2
|
|
X.
|
7
017 362
|
920
501
|
1
170 799
|
11
343 661
|
1
487 791
|
1
885 664
|
-4
326 299
|
-567
289
|
-714
865
|
61,9
|
|
XI.
|
7
013 309
|
916
001
|
1
155 855
|
10
421 031
|
1
361 076
|
1
714 775
|
-3
407 723
|
-445
075
|
-558
920
|
67,3
|
|
XII.
|
6
959 080
|
907
145
|
1
132 285
|
9
647 400
|
1
257 474
|
1
567 347
|
-2
688 320
|
-350
329
|
-435
063
|
72,1
|
|
I – XII.
|
78
921 288
|
10
345 525
|
13
813 816
|
130
404 672
|
17
095 142
|
22
861 497
|
-51
483 385
|
-6
749 617
|
-9
047 681
|
60,5
|
|
|
|
|
|
|
|
|
|
|
|
|
|
2015.
|
|
|
|
|
|
|
|
|
|
|
|
I.
|
5
661 348
|
739
365
|
899
744
|
8
649 839
|
1
129 507
|
1
373 761
|
-2
988 491
|
-390
142
|
-474
017
|
65,5
|
I. ROBNA RAZMJENA REPUBLIKE HRVATSKE S
INOZEMSTVOM U KUNAMA
FOREIGN
TRADE IN GOODS OF THE REPUBLIC OF CROATIA, KUNA
1. IZVOZ I UVOZ PREMA NKD-u 2007.
EXPORT
AND IMPORT, ACCORDING TO NKD 2007.
tis.
kuna
Thousand
kuna
|
|
|
|
Izvoz
Export
|
Uvoz
Import
|
|
|
|
|
|
|
|
I. 2014.
|
I. 2015.
|
indeksi
Indices
I. 2015.
I. 2014.
|
I. 2014.
|
I. 2015.
|
indeksi
Indices
I. 2015.
I. 2014.
|
|
|
|
|
|
|
|
|
|
|
|
|
|
|
|
|
|
|
|
Ukupno
|
5
848 117
|
5
661 348
|
96,8
|
9
739 597
|
8
649 839
|
88,8
|
|
|
Total
|
|
|
|
|
|
|
|
|
|
|
|
|
|
|
A
|
|
Poljoprivreda,
šumarstvo i ribarstvo
|
444 104
|
559 436
|
126,0
|
309 202
|
279
417
|
90,4
|
A
|
|
Agriculture,
forestry and fishing
|
|
|
|
|
|
|
|
|
|
|
|
|
|
|
B
|
|
Rudarstvo i
vađenje
|
101 128
|
85 631
|
84,7
|
1
344 825
|
286
480
|
21,3
|
B
|
|
Mining and quarrying
|
|
|
|
|
|
|
|
|
|
|
|
|
|
|
C
|
|
Prerađivačka
industrija
|
4
846 478
|
4
571 383
|
94,3
|
7
644 974
|
7
673 326
|
100,4
|
C
|
|
Manufacturing
|
|
|
10
|
Proizvodnja
prehrambenih
proizvoda
|
380 982
|
433 177
|
113,7
|
818 112
|
782 044
|
95,6
|
|
10
|
Manufacture of food products
|
|
|
11
|
Proizvodnja
pića
|
49 429
|
46 516
|
94,1
|
66 873
|
67 243
|
100,6
|
|
11
|
Manufacture of beverages
|
|
|
12
|
Proizvodnja
duhanskih proizvoda
|
14 988
|
17 835
|
119,0
|
33 480
|
28 956
|
86,5
|
|
12
|
Manufacture of tobacco products
|
|
|
13
|
Proizvodnja
tekstila
|
69 799
|
70 819
|
101,5
|
203 206
|
206 630
|
101,7
|
|
13
|
Manufacture of textiles
|
|
|
14
|
Proizvodnja
odjeće
|
247
069
|
349
936
|
141,6
|
384 135
|
484 109
|
126,0
|
|
14
|
Manufacture of wearing apparel
|
|
|
15
|
Proizvodnja
kože i srodnih proizvoda
|
182
207
|
207
159
|
113,7
|
284 316
|
330 008
|
116,1
|
|
15
|
Manufacture of leather and related products
|
|
|
16
|
Prerada
drva i proizvoda od drva i pluta, osim namještaja; proizvodnja proizvoda od
slame i pletarskih materijala
|
300
708
|
317
008
|
105,4
|
92
001
|
102
482
|
111,4
|
|
16
|
Manufacture of wood and of products of wood and cork, except
furniture; manufacture of articles of straw and plaiting materials
|
|
|
17
|
Proizvodnja
papira i proizvoda od papira
|
111
276
|
104
192
|
93,6
|
240
081
|
260
845
|
108,6
|
|
17
|
Manufacture of paper and paper products
|
|
|
18
|
Tiskanje i
umnožavanje snimljenih zapisa
|
424
|
984
|
232,3
|
1 860
|
1 744
|
93,8
|
|
18
|
Printing and reproduction of recorded media
|
|
|
19
|
Proizvodnja
koksa i rafiniranih naftnih proizvoda
|
593
699
|
183
890
|
31,0
|
703
998
|
519
426
|
73,8
|
|
19
|
Manufacture of coke and refined petroleum products
|
|
|
20
|
Proizvodnja
kemikalija i kemijskih proizvoda
|
343
164
|
304
626
|
88,8
|
779
666
|
737
907
|
94,6
|
|
20
|
Manufacture of chemicals and chemical products
|
|
|
21
|
Proizvodnja
osnovnih farmaceutskih proizvoda i farmaceutskih pripravaka
|
198
679
|
161
497
|
81,3
|
385
733
|
458
855
|
119,0
|
|
21
|
Manufacture of basic pharmaceutical products and pharmaceutical
preparations
|
|
|
22
|
Proizvodnja
proizvoda od gume i plastike
|
139
864
|
150
585
|
107,7
|
336
553
|
344
929
|
102,5
|
|
22
|
Manufacture of rubber and plastic products
|
|
|
23
|
Proizvodnja
ostalih nemetalnih mineralnih proizvoda
|
178
522
|
188
372
|
105,5
|
132
942
|
147
243
|
110,8
|
|
23
|
Manufacture of other non-metallic mineral products
|
|
|
24
|
Proizvodnja
metala
|
262
275
|
152
633
|
58,2
|
544
971
|
462
015
|
84,8
|
|
24
|
Manufacture of basic metals
|
|
|
25
|
Proizvodnja
gotovih metalnih proizvoda, osim strojeva i opreme
|
337
962
|
417
628
|
123,6
|
291
196
|
298
526
|
102,5
|
|
25
|
Manufacture of fabricated metal products, except machinery and
equipment
|
|
|
26
|
Proizvodnja
računala te elektroničkih i optičkih proizvoda
|
160
215
|
189
392
|
118,2
|
570
430
|
622
428
|
109,1
|
|
26
|
Manufacture of computer, electronic and optical products
|
|
|
27
|
Proizvodnja
električne opreme
|
320
772
|
336
750
|
105,0
|
361
512
|
405
700
|
112,2
|
|
27
|
Manufacture of electrical equipment
|
|
|
28
|
Proizvodnja
strojeva i uređaja, d. n.
|
466
886
|
418
776
|
89,7
|
620
266
|
541
196
|
87,3
|
|
28
|
Manufacture of machinery and equipment n. e. c.
|
|
|
29
|
Proizvodnja
motornih vozila, prikolica i poluprikolica
|
91 835
|
205
488
|
223,8
|
467
452
|
474
297
|
101,5
|
|
29
|
Manufacture of motor vehicles, trailers and semi-trailers
|
|
|
30
|
Proizvodnja
ostalih prijevoznih sredstava
|
159
088
|
81 560
|
51,3
|
67 159
|
92 304
|
137,4
|
|
30
|
Manufacture of other transport equipment
|
|
|
31
|
Proizvodnja
namještaja
|
200
351
|
186
525
|
93,1
|
98 979
|
114
399
|
115,6
|
|
31
|
Manufacture of furniture
|
|
|
32
|
Ostala
prerađivačka industrija
|
36 285
|
46 034
|
126,9
|
160
052
|
190
040
|
118,7
|
|
32
|
Other manufacturing
|
|
|
|
|
|
|
|
|
|
|
|
|
|
|
D
|
|
Opskrba
električnom energijom, plinom, parom i klimatizacija
|
244
680
|
247
211
|
101,0
|
371
811
|
362 614
|
97,5
|
D
|
|
Electricity, gas, steam and air conditioning supply
|
|
|
|
|
|
|
|
|
|
|
|
|
|
|
E
|
|
Opskrba vodom;
uklanjanje otpadnih voda, gospodarenje otpadom te djelatnosti sanacije
okoliša
|
175
444
|
163
923
|
93,4
|
33
624
|
24
261
|
72,2
|
E
|
|
Water supply; sewerage, waste management and remediation activities
|
|
|
|
|
|
|
|
|
|
|
|
|
|
|
J
|
|
Informacije
i komunikacije
|
25
601
|
27
651
|
108,0
|
33
908
|
22
497
|
66,3
|
J
|
|
Information and communication
|
|
|
|
|
|
|
|
|
|
|
|
|
|
|
M
|
|
Stručne,
znanstvene i tehničke djelatnosti
|
779
|
339
|
43,5
|
11
|
40
|
380,2
|
M
|
|
Professional, scientific and technical activities
|
|
|
|
|
|
|
|
|
|
|
|
|
|
|
R
|
|
Umjetnost,
zabava i rekreacija
|
5
|
713
|
1)
|
113
|
60
|
53,1
|
R
|
|
Arts, entertainment and recreation
|
|
|
|
|
|
|
|
|
|
|
|
|
|
|
|
|
Neraspoređeno
|
9
898
|
5
061
|
51,1
|
1
130
|
1
142
|
101,1
|
|
|
Not classified
|
1) Indeks
je veći od 999.
1) The index exceeds 999.
2. IZVOZ I UVOZ PO SEKTORIMA SMTK
EXPORT
AND IMPORT, ACCORDING TO SITC SECTIONS
tis.
kuna
Thousand
kuna
|
|
|
Izvoz
Export
|
Uvoz
Import
|
|
|
|
|
|
I. 2014.
|
I. 2015.
|
indeksi
Indices
I. 2015.
I. 2014.
|
I. 2014.
|
I. 2015.
|
indeksi
Indices
I. 2015.
I. 2014.
|
|
|
|
|
|
|
|
|
|
|
|
|
|
|
|
Ukupno
|
5
848 117
|
5
661 348
|
96,8
|
9
739 597
|
8
649 839
|
88,8
|
|
Total
|
|
|
|
|
|
|
|
|
|
|
|
|
0
|
Hrana i žive životinje
|
689
638
|
813
561
|
118,0
|
996
173
|
963
533
|
96,7
|
0
|
Food and live animals
|
|
1
|
Pića i duhan
|
72
287
|
63
586
|
88,0
|
105
971
|
99
144
|
93,6
|
1
|
Beverages and tobacco
|
|
2
|
Sirove materije, osim goriva
|
488
918
|
553
598
|
113,2
|
184
321
|
159
292
|
86,4
|
2
|
Crude materials, except fuels
|
|
3
|
Mineralna goriva i maziva
|
925
407
|
500
798
|
54,1
|
2
401 818
|
1
139 386
|
47,4
|
3
|
Mineral fuels and lubricants
|
|
4
|
Životinjska i biljna ulja i masti
|
9
575
|
12
180
|
127,2
|
46
231
|
29
779
|
64,4
|
4
|
Animal and vegetable oils and fats
|
|
5
|
Kemijski proizvodi
|
575
888
|
509
845
|
88,5
|
1
257 266
|
1
308 173
|
104,0
|
5
|
Chemical products
|
|
6
|
Proizvodi svrstani prema materijalu
|
969
811
|
907
622
|
93,6
|
1
664 965
|
1
651 540
|
99,2
|
6
|
Manufactured goods classified chiefly by material
|
|
7
|
Strojevi i prijevozna sredstva
|
1
163 382
|
1
225 333
|
105,3
|
1
979 541
|
2
009 925
|
101,5
|
7
|
Machinery and transport equipment
|
|
8
|
Razni gotovi proizvodi
|
867
971
|
1
017 120
|
117,2
|
1
095 168
|
1
286 119
|
117,4
|
8
|
Miscellaneous manufactured articles
|
|
9
|
Proizvodi i transakcije, d. n.
|
75
341
|
52
645
|
69,9
|
7
013
|
1
805
|
25,7
|
9
|
Commodities and transactions, n. e. s.
|
|
|
Neraspoređeno
|
9
898
|
5
061
|
51,1
|
1
130
|
1
142
|
101,1
|
|
Not classified
|
3. IZVOZ I UVOZ PREMA EKONOMSKIM GRUPACIJAMA
ZEMALJA
EXPORT
AND IMPORT, ACCORDING TO ECONOMIC CLASSIFICATION OF COUNTRIES
tis.
kuna
Thousand
kuna
|
|
Izvoz
Export
|
Uvoz
Import
|
|
|
|
I. 2014.
|
I. 2015.
|
indeksi
Indices
I. 2015.
I. 2014.
|
I. 2014.
|
I. 2015.
|
indeksi
Indices
I. 2015.
I. 2014.
|
|
|
|
|
|
|
|
|
|
|
|
Ukupno
|
5
848 117
|
5
661 348
|
96,8
|
9
739 597
|
8
649 839
|
88,8
|
Total
|
|
|
|
|
|
|
|
|
|
|
Zemlje Europske unije
|
3
832 457
|
3
799 373
|
99,1
|
6
860 027
|
7
261 064
|
105,8
|
EU countries
|
|
Austrija
|
394 998
|
391 516
|
99,1
|
826 186
|
917 889
|
111,1
|
Austria
|
|
Belgija
|
70 919
|
85 192
|
120,1
|
152 821
|
155 207
|
101,6
|
Belgium
|
|
Bugarska
|
14 223
|
20 241
|
142,3
|
24 564
|
50 605
|
206,0
|
Bulgaria
|
|
Cipar
|
377
|
4 006
|
1)
|
4 254
|
2 542
|
59,8
|
Cyprus
|
|
Češka
|
71 496
|
79 087
|
110,6
|
207 811
|
210 080
|
101,1
|
Czech Republic
|
|
Danska
|
25 039
|
21 293
|
85,0
|
66 480
|
44 394
|
66,8
|
Denmark
|
|
Estonija
|
1 102
|
1 280
|
116,2
|
1 034
|
3 418
|
330,4
|
Estonia
|
|
Finska
|
14 623
|
4 568
|
31,2
|
12 308
|
14 812
|
120,3
|
Finland
|
|
Francuska
|
145 539
|
160 379
|
110,2
|
216 429
|
213 139
|
98,5
|
France
|
|
Grčka
|
168
219
|
32 587
|
19,4
|
57 164
|
34 331
|
60,1
|
Greece
|
|
Irska
|
2 833
|
3 003
|
106,0
|
18 721
|
24 307
|
129,8
|
Ireland
|
|
Italija
|
821
919
|
762 773
|
92,8
|
1
127 888
|
1
324 750
|
117,5
|
Italy
|
|
Letonija
|
1 520
|
3 834
|
252,3
|
3 161
|
3 933
|
124,4
|
Latvia
|
|
Litva
|
3 967
|
13 387
|
337,5
|
4 747
|
6 256
|
131,8
|
Lithuania
|
|
Luksemburg
|
3 013
|
4 383
|
145,5
|
2 547
|
2 395
|
94,0
|
Luxembourg
|
|
Mađarska
|
170
981
|
171
989
|
100,6
|
655 260
|
765 031
|
116,8
|
Hungary
|
|
Malta
|
108
486
|
7 149
|
6,6
|
1 591
|
737
|
46,3
|
Malta
|
|
Nizozemska
|
59 578
|
68 371
|
114,8
|
335 657
|
374 660
|
111,6
|
Netherlands
|
|
Njemačka
|
693
834
|
737
915
|
106,4
|
1
469 480
|
1
357 604
|
92,4
|
Germany
|
|
Poljska
|
59 067
|
89 605
|
151,7
|
199
136
|
238 566
|
119,8
|
Poland
|
|
Portugal
|
15 891
|
25 646
|
161,4
|
5 439
|
7 361
|
135,3
|
Portugal
|
|
Rumunjska
|
39 177
|
62 751
|
160,2
|
59 462
|
82 782
|
139,2
|
Romania
|
|
Slovačka
|
84 917
|
87
283
|
102,8
|
166
983
|
169 284
|
101,4
|
Slovakia
|
|
Slovenija
|
656
666
|
722
724
|
110,1
|
975
118
|
962 557
|
98,7
|
Slovenia
|
|
Španjolska
|
78
905
|
92 373
|
117,1
|
114
379
|
159 647
|
139,6
|
Spain
|
|
Švedska
|
21 125
|
20
990
|
99,4
|
54
971
|
48
621
|
88,4
|
Sweden
|
|
Ujedinjena Kraljevina
|
104
043
|
124
548
|
119,7
|
96
425
|
85
748
|
88,9
|
United Kingdom
|
|
Neraspoređeno
|
-
|
502
|
-
|
12
|
409
|
1)
|
Not classified
|
|
|
|
|
|
|
|
|
|
|
Zemlje Efte
|
96
042
|
84 533
|
88,0
|
88
455
|
136
274
|
154,1
|
EFTA countries
|
|
Island
|
213
|
136
|
63,8
|
560
|
1 090
|
194,7
|
Iceland
|
|
Lihtenštajn
|
1 265
|
1 492
|
118,0
|
695
|
21
|
3,0
|
Liechtenstein
|
|
Norveška
|
6 310
|
10 048
|
159,2
|
8 221
|
5 892
|
71,7
|
Norway
|
|
Švicarska
|
88 254
|
72 857
|
82,6
|
78
979
|
129
271
|
163,7
|
Switzerland
|
|
|
|
|
|
|
|
|
|
|
Zemlje Cefte
|
996
141
|
947
340
|
95,1
|
497
226
|
380
646
|
76,6
|
CEFTA
countries
|
|
Albanija
|
51
089
|
27
909
|
54,6
|
1 332
|
1 513
|
113,6
|
Albania
|
|
Bosna I Hercegovina
|
611
936
|
507
268
|
82,9
|
297
657
|
196
053
|
65,9
|
Bosnia and Herzegovina
|
|
Crna Gora
|
43
855
|
46
908
|
107,0
|
7 422
|
1 137
|
15,3
|
Montenegro
|
|
Kosovo
|
26
261
|
40
710
|
155,0
|
427
|
612
|
143,2
|
Kosovo
|
|
Makedonija
|
53
582
|
42
639
|
79,6
|
51
938
|
45 186
|
87,0
|
Macedonia,
FYR
|
|
Moldavija
|
446
|
645
|
144,7
|
465
|
197
|
42,5
|
Moldova
|
|
Srbija
|
208 971
|
281
260
|
134,6
|
137
985
|
135
948
|
98,5
|
Serbia
|
|
|
|
|
|
|
|
|
|
|
Zemlje OPEC-a
|
79
616
|
121
124
|
152,1
|
54
417
|
22 589
|
41,5
|
OPEC
countries
|
|
Alžir
|
18
702
|
995
|
5,3
|
3 360
|
8 588
|
255,6
|
Algeria
|
|
Angola
|
78
|
85
|
108,7
|
-
|
-
|
-
|
Angola
|
|
Ekvador
|
2
|
151
|
1)
|
8 047
|
6 351
|
78,9
|
Ecuador
|
|
Irak
|
394
|
238
|
60,3
|
29
|
-
|
-
|
Iraq
|
|
Iran, Islamska Republika
|
915
|
2 424
|
265,1
|
160
|
356
|
222,6
|
Iran,
Islamic Republic of
|
|
Katar
|
5
222
|
4 904
|
93,9
|
4 282
|
2 485
|
58,0
|
Qatar
|
|
Kuvajt
|
4
085
|
1 830
|
44,8
|
1
|
-
|
-
|
Kuwait
|
|
Libija
|
13
670
|
7 662
|
56,1
|
-
|
1
|
-
|
Libya
|
|
Nigerija
|
3 235
|
1 671
|
51,7
|
46
|
-
|
-
|
Nigeria
|
|
Saudijska Arabija
|
31
563
|
83
658
|
265,1
|
30 474
|
933
|
3,1
|
Saudi
Arabia
|
|
Ujedinjeni Arapski Emirati
|
1
752
|
17
505
|
999,2
|
8 019
|
3 874
|
48,3
|
United Arab
Emirates
|
|
Venezuela
|
-
|
-
|
-
|
0
|
1
|
372,5
|
Venezuela
|
|
|
|
|
|
|
|
|
|
|
Ostale europske zemlje
|
167
252
|
140
511
|
84,0
|
1
126 542
|
135
983
|
12,1
|
Other countries in Europe
|
|
Bjelorusija
|
5 510
|
8 791
|
159,5
|
310
|
161
|
51,9
|
Belarus
|
|
Rusija
|
107
075
|
95
286
|
89,0
|
1
014 783
|
30
421
|
3,0
|
Russian Federation
|
|
Turska
|
32
664
|
30
011
|
91,9
|
86 433
|
94
823
|
109,7
|
Turkey
|
|
Ukrajina
|
22
003
|
6
251
|
28,4
|
22 584
|
10
540
|
46,7
|
Ukraine
|
|
Ostale zemlje
|
-
|
172
|
-
|
2 433
|
38
|
1,6
|
Other countries
|
|
|
|
|
|
|
|
|
|
|
Ostale azijske zemlje
|
340
709
|
323
270
|
94,9
|
817 653
|
457
993
|
56,0
|
Other countries in Asia
|
|
Azerbajdžan
|
11
694
|
735
|
6,3
|
-
|
109
|
-
|
Azerbaijan
|
|
Bangladeš
|
1 895
|
2 110
|
111,3
|
5 662
|
6 604
|
116,6
|
Bangladesh
|
|
Filipini
|
3 299
|
7
|
0,2
|
284
|
974
|
343,2
|
Philippines
|
|
Hong Kong, Kina
|
2 511
|
2 703
|
107,7
|
10 298
|
1 976
|
19,2
|
Hong Kong, China
|
|
Indija
|
2 855
|
1
149
|
40,3
|
43 212
|
46 498
|
107,6
|
India
|
|
Indonezija
|
4 232
|
616
|
14,6
|
4 361
|
7 291
|
167,2
|
Indonesia
|
|
Izrael
|
30
724
|
14
944
|
48,6
|
9 206
|
6 380
|
69,3
|
Israel
|
|
Japan
|
221 477
|
217 881
|
98,4
|
9 602
|
14 301
|
148,9
|
Japan
|
|
Kazahstan
|
3
037
|
1 289
|
42,5
|
375
440
|
181
|
0,0
|
Kazakhstan
|
|
Kina
|
32
474
|
35
374
|
108,9
|
245
767
|
288
414
|
117,4
|
China
|
|
Koreja, Republika
|
4
814
|
9
834
|
204,3
|
54 314
|
31 649
|
58,3
|
Korea, Republic of
|
|
Libanon
|
7
514
|
5
565
|
74,1
|
10
|
2
|
20,9
|
Lebanon
|
|
Malezija
|
361
|
734
|
203,4
|
6 917
|
7 099
|
102,6
|
Malaysia
|
|
Pakistan
|
-
|
6
044
|
-
|
2 944
|
5 262
|
178,7
|
Pakistan
|
|
Singapur
|
3
575
|
1
275
|
35,7
|
2 391
|
1 005
|
42,0
|
Singapore
|
|
Sirija
|
128
|
-
|
-
|
-
|
-
|
-
|
Syrian Arab Republic
|
|
Tajland
|
214
|
372
|
174,1
|
14
717
|
7 593
|
51,6
|
Thailand
|
|
Tajvan, Kina
|
544
|
1
249
|
229,5
|
16
530
|
16 267
|
98,4
|
Taiwan, China
|
|
Vijetnam
|
5
727
|
6
974
|
121,8
|
12
634
|
12 847
|
101,7
|
Viet Nam
|
|
Ostale zemlje
|
3
634
|
14
415
|
396,7
|
3 363
|
3 541
|
105,3
|
Other countries
|
|
|
|
|
|
|
|
|
|
|
Ostale afričke zemlje
|
88
842
|
56
105
|
63,2
|
20
190
|
61 882
|
306,5
|
Other countries in Africa
|
|
Egipat
|
41
493
|
42
794
|
103,1
|
3 307
|
7 717
|
233,3
|
Egypt
|
|
Gana
|
-
|
246
|
-
|
516
|
13
|
2,4
|
Ghana
|
|
Južnoafrička Republika
|
16
002
|
789
|
4,9
|
891
|
35
823
|
1)
|
South Africa
|
|
Liberija
|
780
|
-
|
-
|
-
|
-
|
-
|
Liberia
|
|
Maroko
|
15
179
|
884
|
5,8
|
532
|
285
|
53,6
|
Morocco
|
|
Tunis
|
12
372
|
564
|
4,6
|
14
044
|
17
209
|
122,5
|
Tunisia
|
|
Ostale zemlje
|
3
016
|
10
829
|
359,1
|
900
|
835
|
92,8
|
Other countries
|
|
|
|
|
|
|
|
|
|
|
Ostale američke zemlje
|
230
314
|
176
016
|
76,4
|
206
412
|
140
112
|
67,9
|
Other
countries in America
|
|
Argentina
|
251
|
4
|
1,5
|
14 966
|
30 297
|
202,4
|
Argentina
|
|
Brazil
|
11
388
|
3 742
|
32,9
|
86 194
|
18 341
|
21,3
|
Brazil
|
|
Čile
|
177
|
16
|
9,3
|
11
|
213
|
1)
|
Chile
|
|
Kanada
|
4 839
|
9 710
|
200,7
|
5 273
|
6 210
|
117,8
|
Canada
|
|
Kolumbija
|
88
488
|
-
|
-
|
2 088
|
781
|
37,4
|
Colombia
|
|
Meksiko
|
9 556
|
9 336
|
97,7
|
2 724
|
5 688
|
208,8
|
Mexico
|
|
Peru
|
3 898
|
50
|
1,3
|
174
|
173
|
98,9
|
Peru
|
|
SAD
|
109 786
|
147
148
|
134,0
|
78
065
|
77 998
|
99,9
|
United States
|
|
Ostale zemlje
|
1 932
|
6 010
|
311,1
|
16
916
|
410
|
2,4
|
Other countries
|
|
|
|
|
|
|
|
|
|
|
Oceanijske zemlje
|
10
189
|
7 940
|
77,9
|
1 735
|
2 497
|
143,9
|
Countries of Oceania
|
|
Australija
|
5 904
|
3 850
|
65,2
|
1 203
|
1 500
|
124,8
|
Australia
|
|
Maršalovi Otoci
|
-
|
3 898
|
-
|
-
|
1
|
-
|
Marshall Islands
|
|
Novi Zeland
|
109
|
168
|
153,3
|
532
|
996
|
187,1
|
New Zealand
|
|
Ostale zemlje
|
4
176
|
24
|
0,6
|
0
|
-
|
-
|
Other countries
|
|
|
|
|
|
|
|
|
|
|
Neraspoređeno
|
6
556
|
5 136
|
78,3
|
66 941
|
50 800
|
75,9
|
Not classified
|
1) Indeks
je veći od 999.
1) The
index exceeds 999.
II. ROBNA RAZMJENA REPUBLIKE HRVATSKE S
INOZEMSTVOM U EURIMA
FOREIGN
TRADE IN GOODS OF THE REPUBLIC OF CROATIA, EURO
1. PROSJEČNA VRIJEDNOST EURA ZA REPUBLIKU
HRVATSKU
AVERAGE
EXCHANGE RATE OF EURO IN THE REPUBLIC OF CROATIA
|
|
Izvoz
Export
|
Uvoz
Import
|
|
|
|
I. 2014.
|
I. 2015.
|
indeksi
Indices
I. 2015.
I. 2014.
|
I. 2014.
|
I. 2015.
|
indeksi
Indices
I. 2015.
I. 2014.
|
|
|
|
|
|
|
|
|
|
|
|
Prosječan tečaj 1 eura u kunama
|
7,6278
|
7,6570
|
100,4
|
7,6277
|
7,6581
|
100,4
|
Average
Exchange rate for 1 euro in kuna
|
2. IZVOZ I UVOZ PREMA NKD-u 2007.
EXPORT
AND IMPORT, ACCORDING TO NKD 2007.
tis. eura
Thousand
euros
|
|
|
|
Izvoz
Export
|
Uvoz
Import
|
|
|
|
|
|
|
|
I. 2014.
|
I. 2015.
|
indeksi
Indices
I. 2015.
I. 2014.
|
I. 2014.
|
I. 2015.
|
indeksi
Indices
I. 2015.
I. 2014.
|
|
|
|
|
|
|
|
|
|
|
|
|
|
|
|
|
|
|
|
Ukupno
|
766
684
|
739
365
|
96,4
|
1
276 871
|
1
129 507
|
88,5
|
|
|
Total
|
|
|
|
|
|
|
|
|
|
|
|
|
|
|
A
|
|
Poljoprivreda,
šumarstvo i ribarstvo
|
58 216
|
73 032
|
125,4
|
40 537
|
36 486
|
90,0
|
A
|
|
Agriculture,
forestry and fishing
|
|
|
|
|
|
|
|
|
|
|
|
|
|
|
B
|
|
Rudarstvo i
vađenje
|
13 259
|
11 182
|
84,3
|
176 280
|
37 407
|
21,2
|
B
|
|
Mining and quarrying
|
|
|
|
|
|
|
|
|
|
|
|
|
|
|
C
|
|
Prerađivačka
industrija
|
635 372
|
597 059
|
94,0
|
1 002 291
|
1 001 997
|
100,0
|
C
|
|
Manufacturing
|
|
|
10
|
Proizvodnja
prehrambenih proizvoda
|
49 946
|
56 674
|
113,5
|
107 257
|
102 120
|
95,2
|
|
10
|
Manufacture of food products
|
|
|
11
|
Proizvodnja
pića
|
6 480
|
6 073
|
93,7
|
8 767
|
8 779
|
100,1
|
|
11
|
Manufacture of beverages
|
|
|
12
|
Proizvodnja
duhanskih proizvoda
|
1 965
|
2 331
|
118,6
|
4 390
|
3 781
|
86,1
|
|
12
|
Manufacture of tobacco products
|
|
|
13
|
Proizvodnja
tekstila
|
9 151
|
9 247
|
101,0
|
26 642
|
26 983
|
101,3
|
|
13
|
Manufacture of textiles
|
|
|
14
|
Proizvodnja
odjeće
|
32 393
|
45 697
|
141,1
|
50 365
|
63 221
|
125,5
|
|
14
|
Manufacture of wearing apparel
|
|
|
15
|
Proizvodnja
kože i srodnih proizvoda
|
23 888
|
27 051
|
113,2
|
37 276
|
43 093
|
115,6
|
|
15
|
Manufacture of leather and related products
|
|
|
16
|
Prerada
drva i proizvoda od drva i pluta, osim namještaja; proizvodnja proizvoda od
slame i pletarskih materijala
|
39 422
|
41 394
|
105,0
|
12 062
|
13 382
|
110,9
|
|
16
|
Manufacture of wood and of products of wood and cork, except
furniture; manufacture of articles of straw and plaiting materials
|
|
|
17
|
Proizvodnja
papira i proizvoda od papira
|
14 589
|
13 605
|
93,3
|
31 476
|
34 061
|
108,2
|
|
17
|
Manufacture of paper and paper products
|
|
|
18
|
Tiskanje i
umnožavanje snimljenih zapisa
|
56
|
129
|
231,3
|
244
|
228
|
93,4
|
|
18
|
Printing and reproduction of recorded media
|
|
|
19
|
Proizvodnja
koksa i rafiniranih naftnih proizvoda
|
77 830
|
24 003
|
30,8
|
92 287
|
67 826
|
73,5
|
|
19
|
Manufacture of coke and refined petroleum products
|
|
|
20
|
Proizvodnja
kemikalija i kemijskih proizvoda
|
44 989
|
39 771
|
88,4
|
102 217
|
96 357
|
94,3
|
|
20
|
Manufacture of chemicals and chemical products
|
|
|
21
|
Proizvodnja
osnovnih farmaceutskih proizvoda i farmaceutskih pripravaka
|
26 044
|
21 085
|
81,0
|
50 570
|
59 914
|
118,5
|
|
21
|
Manufacture of basic pharmaceutical products and pharmaceutical
preparations
|
|
|
22
|
Proizvodnja
proizvoda od gume i plastike
|
18 337
|
19 663
|
107,2
|
44 125
|
45 042
|
102,1
|
|
22
|
Manufacture of rubber and plastic products
|
|
|
23
|
Proizvodnja
ostalih nemetalnih mineralnih proizvoda
|
23 404
|
24 603
|
105,1
|
17 430
|
19 228
|
110,3
|
|
23
|
Manufacture of other non-metallic mineral products
|
|
|
24
|
Proizvodnja
metala
|
34 385
|
19 930
|
58,0
|
71 447
|
60 329
|
84,4
|
|
24
|
Manufacture of basic metals
|
|
|
25
|
Proizvodnja
gotovih metalnih proizvoda, osim strojeva i opreme
|
44 307
|
54 580
|
123,2
|
38 179
|
38 983
|
102,1
|
|
25
|
Manufacture of fabricated metal products, except machinery and
equipment
|
|
|
26
|
Proizvodnja
računala te elektroničkih i optičkih proizvoda
|
21 005
|
24 730
|
117,7
|
74 788
|
81 279
|
108,7
|
|
26
|
Manufacture of computer, electronic and optical products
|
|
|
27
|
Proizvodnja
električne opreme
|
42 054
|
43 968
|
104,6
|
47 398
|
52 978
|
111,8
|
|
27
|
Manufacture of electrical equipment
|
|
|
28
|
Proizvodnja
strojeva i uređaja, d. n.
|
61 208
|
54 674
|
89,3
|
81 321
|
70 670
|
86,9
|
|
28
|
Manufacture of machinery and equipment n. e. c.
|
|
|
29
|
Proizvodnja
motornih vozila, prikolica i poluprikolica
|
12 040
|
26 833
|
222,9
|
61 287
|
61 937
|
101,1
|
|
29
|
Manufacture of motor vehicles, trailers and semi-trailers
|
|
|
30
|
Proizvodnja
ostalih prijevoznih sredstava
|
20 855
|
10 650
|
51,1
|
8 804
|
12 053
|
136,9
|
|
30
|
Manufacture of other transport equipment
|
|
|
31
|
Proizvodnja
namještaja
|
26 268
|
24 357
|
92,7
|
12 977
|
14 937
|
115,1
|
|
31
|
Manufacture of furniture
|
|
|
32
|
Ostala
prerađivačka industrija
|
4 757
|
6 011
|
126,4
|
20 984
|
24 815
|
118,3
|
|
32
|
Other manufacturing
|
|
|
|
|
|
|
|
|
|
|
|
|
|
|
D
|
|
Opskrba
električnom energijom, plinom, parom i klimatizacija
|
32 078
|
32 278
|
100,6
|
48 745
|
47 348
|
97,1
|
D
|
|
Electricity, gas, steam and air conditioning supply
|
|
|
|
|
|
|
|
|
|
|
|
|
|
|
E
|
|
Opskrba vodom;
uklanjanje otpadnih voda, gospodarenje otpadom te djelatnosti sanacije
okoliša
|
23 002
|
21 405
|
93,1
|
4 408
|
3 168
|
71,9
|
E
|
|
Water supply; sewerage, waste management and remediation activities
|
|
|
|
|
|
|
|
|
|
|
|
|
|
|
J
|
|
Informacije
i komunikacije
|
3 357
|
3 611
|
107,6
|
4 446
|
2 938
|
66,1
|
J
|
|
Information and communication
|
|
|
|
|
|
|
|
|
|
|
|
|
|
|
M
|
|
Stručne,
znanstvene i tehničke djelatnosti
|
102
|
44
|
43,4
|
1
|
5
|
378,8
|
M
|
|
Professional, scientific and technical activities
|
|
|
|
|
|
|
|
|
|
|
|
|
|
|
R
|
|
Umjetnost,
zabava i rekreacija
|
1
|
93
|
1)
|
15
|
8
|
52,9
|
R
|
|
Arts, entertainment and recreation
|
|
|
|
|
|
|
|
|
|
|
|
|
|
|
|
|
Neraspoređeno
|
1 298
|
661
|
50,9
|
148
|
149
|
100,7
|
|
|
Not classified
|
1) Indeks
je veći od 999.
1) The index exceeds 999.
3. IZVOZ I UVOZ PO SEKTORIMA SMTK
EXPORT
AND IMPORT, ACCORDING TO SITC SECTIONS
tis. eura
Thousand
euros
|
|
|
Izvoz
Export
|
Uvoz
Import
|
|
|
|
|
|
I. 2014.
|
I. 2015.
|
indeksi
Indices
I.
2015.
I. 2014.
|
I. 2014.
|
I. 2015.
|
indeksi
Indices
I.
2015.
I. 2014.
|
|
|
|
|
|
|
|
|
|
|
|
|
|
|
|
Ukupno
|
766
684
|
739
365
|
96,4
|
1
276 871
|
1
129 507
|
88,5
|
|
Total
|
|
|
|
|
|
|
|
|
|
|
|
|
0
|
Hrana i žive životinje
|
90 405
|
106
329
|
117,6
|
130
601
|
125
820
|
96,3
|
0
|
Food and live animals
|
|
1
|
Pića i duhan
|
9 477
|
8 304
|
87,6
|
13 892
|
12 945
|
93,2
|
1
|
Beverages and tobacco
|
|
2
|
Sirove materije, osim goriva
|
64
098
|
72 280
|
112,8
|
24 166
|
20 799
|
86,1
|
2
|
Crude materials, except fuels
|
|
3
|
Mineralna goriva i maziva
|
121
318
|
65 382
|
53,9
|
314
845
|
148
778
|
47,3
|
3
|
Mineral fuels and lubricants
|
|
4
|
Životinjska i biljna ulja i masti
|
1 255
|
1 590
|
126,7
|
6 061
|
3 888
|
64,2
|
4
|
Animal and vegetable oils and fats
|
|
5
|
Kemijski proizvodi
|
75 497
|
66 565
|
88,2
|
164
832
|
170
819
|
103,6
|
5
|
Chemical products
|
|
6
|
Proizvodi svrstani prema
materijalu
|
127
146
|
118
576
|
93,3
|
218
287
|
215
662
|
98,8
|
6
|
Manufactured goods classified chiefly by material
|
|
7
|
Strojevi i prijevozna sredstva
|
152
517
|
159
989
|
104,9
|
259
531
|
262
462
|
101,1
|
7
|
Machinery and transport equipment
|
|
8
|
Razni gotovi proizvodi
|
113
796
|
132
813
|
116,7
|
143
588
|
167
950
|
117,0
|
8
|
Miscellaneous manufactured articles
|
|
9
|
Proizvodi i transakcije, d. n.
|
9 878
|
6 875
|
69,6
|
919
|
236
|
25,6
|
9
|
Commodities and transactions, n. e. s.
|
|
|
Neraspoređeno
|
1 298
|
661
|
50,9
|
148
|
149
|
100,7
|
|
Not classified
|
4. IZVOZ I UVOZ PREMA EKONOMSKIM GRUPACIJAMA
ZEMALJA
EXPORT
AND IMPORT, ACCORDING TO ECONOMIC CLASSIFICATION OF COUNTRIES
tis. eura
Thousand
euros
|
|
Izvoz
Export
|
Uvoz
Import
|
|
|
|
I. 2014.
|
I. 2015.
|
indeksi
Indices
I.
2015.
I. 2014.
|
I. 2014.
|
I. 2015.
|
indeksi
Indices
I.
2015.
I. 2014.
|
|
|
|
|
|
|
|
|
|
|
|
Ukupno
|
766 684
|
739 365
|
96,4
|
1 276 871
|
1 129 507
|
88,5
|
Total
|
|
|
|
|
|
|
|
|
|
|
Zemlje Europske unije
|
502 468
|
496 151
|
98,7
|
899 418
|
948 236
|
105,4
|
EU countries
|
|
|
|
|
|
|
|
|
|
|
Austrija
|
51 788
|
51 127
|
98,7
|
108 321
|
119 868
|
110,7
|
Austria
|
|
Belgija
|
9 298
|
11 125
|
119,6
|
20 037
|
20 269
|
101,2
|
Belgium
|
|
Bugarska
|
1 865
|
2 643
|
141,7
|
3 221
|
6 609
|
205,2
|
Bulgaria
|
|
Cipar
|
49
|
523
|
1)
|
558
|
332
|
59,5
|
Cyprus
|
|
Češka
|
9 374
|
10 328
|
110,2
|
27 246
|
27 435
|
100,7
|
Czech Republic
|
|
Danska
|
3 283
|
2 781
|
84,7
|
8 716
|
5 798
|
66,5
|
Denmark
|
|
Estonija
|
144
|
167
|
115,7
|
136
|
446
|
329,1
|
Estonia
|
|
Finska
|
1 917
|
597
|
31,1
|
1 614
|
1 934
|
119,9
|
Finland
|
|
Francuska
|
19 081
|
20 944
|
109,8
|
28 376
|
27 835
|
98,1
|
France
|
|
Grčka
|
22 055
|
4 255
|
19,3
|
7 495
|
4 483
|
59,8
|
Greece
|
|
Irska
|
371
|
392
|
105,6
|
2 454
|
3 174
|
129,3
|
Ireland
|
|
Italija
|
107 761
|
99 609
|
92,4
|
147 877
|
172 999
|
117,0
|
Italy
|
|
Letonija
|
199
|
501
|
251,3
|
414
|
514
|
124,0
|
Latvia
|
|
Litva
|
520
|
1 748
|
336,1
|
622
|
817
|
131,3
|
Lithuania
|
|
Luksemburg
|
395
|
572
|
144,9
|
334
|
313
|
93,7
|
Luxembourg
|
|
Mađarska
|
22 417
|
22 460
|
100,2
|
85 911
|
99 906
|
116,3
|
Hungary
|
|
Malta
|
14 223
|
934
|
6,6
|
209
|
96
|
46,1
|
Malta
|
|
Nizozemska
|
7 811
|
8 928
|
114,3
|
44 008
|
48 928
|
111,2
|
Netherlands
|
|
Njemačka
|
90 968
|
96 362
|
105,9
|
192 663
|
177 290
|
92,0
|
Germany
|
|
Poljska
|
7 744
|
11 701
|
151,1
|
26 109
|
31 156
|
119,3
|
Poland
|
|
Portugal
|
2 083
|
3 349
|
160,7
|
713
|
961
|
134,8
|
Portugal
|
|
Rumunjska
|
5 136
|
8 194
|
159,5
|
7 796
|
10 811
|
138,7
|
Romania
|
|
Slovačka
|
11 133
|
11 398
|
102,4
|
21 893
|
22 107
|
101,0
|
Slovakia
|
|
Slovenija
|
86 095
|
94 379
|
109,6
|
127 848
|
125 701
|
98,3
|
Slovenia
|
|
Španjolska
|
10 345
|
12 063
|
116,6
|
14 996
|
20 849
|
139,0
|
Spain
|
|
Švedska
|
2 770
|
2 741
|
99,0
|
7 207
|
6 350
|
88,1
|
Sweden
|
|
Ujedinjena Kraljevina
|
13 641
|
16 264
|
119,2
|
12 643
|
11 199
|
88,6
|
United Kingdom
|
|
Neraspoređeno
|
-
|
66
|
-
|
2
|
53
|
1)
|
Not classified
|
|
|
|
|
|
|
|
|
|
|
Zemlje Efte
|
12 589
|
11 030
|
87,6
|
11 595
|
17 786
|
153,4
|
EFTA countries
|
|
Island
|
28
|
18
|
63,5
|
73
|
142
|
193,8
|
Iceland
|
|
Lihtenštajn
|
166
|
195
|
117,5
|
91
|
3
|
3,0
|
Liechtenstein
|
|
Norveška
|
827
|
1 308
|
158,1
|
1 078
|
769
|
71,4
|
Norway
|
|
Švicarska
|
11 568
|
9 509
|
82,2
|
10 353
|
16 872
|
163,0
|
Switzerland
|
|
|
|
|
|
|
|
|
|
|
Zemlje Cefte
|
130 581
|
123 746
|
94,8
|
65 179
|
49 684
|
76,2
|
CEFTA countries
|
|
Albanija
|
6 697
|
3 643
|
54,4
|
175
|
197
|
113,1
|
Albania
|
|
Bosna i Hercegovina
|
80 218
|
66 215
|
82,5
|
39 018
|
25 590
|
65,6
|
Bosnia and Herzegovina
|
|
Crna Gora
|
5 749
|
6 169
|
107,3
|
973
|
148
|
15,3
|
Montenegro
|
|
Kosovo
|
3 442
|
5 314
|
154,4
|
56
|
80
|
142,6
|
Kosovo
|
|
Makedonija
|
7 024
|
5 566
|
79,2
|
6 808
|
5 898
|
86,6
|
Macedonia, FYR
|
|
Moldavija
|
58
|
84
|
144,0
|
61
|
26
|
42,3
|
Moldova
|
|
Srbija
|
27 393
|
36 755
|
134,2
|
18 088
|
17 745
|
98,1
|
Serbia
|
|
|
|
|
|
|
|
|
|
|
Zemlje OPEC-a
|
10 436
|
15 809
|
151,5
|
7 133
|
2 948
|
41,3
|
OPEC countries
|
|
Alžir
|
2 451
|
130
|
5,3
|
440
|
1 121
|
254,5
|
Algeria
|
|
Angola
|
10
|
11
|
108,2
|
-
|
-
|
-
|
Angola
|
|
Ekvador
|
0
|
20
|
1)
|
1 055
|
829
|
78,6
|
Ecuador
|
|
Irak
|
52
|
31
|
60,0
|
4
|
-
|
-
|
Iraq
|
|
Iran, Islamska Republika
|
120
|
316
|
263,9
|
21
|
47
|
221,6
|
Iran, Islamic Republic of
|
|
Katar
|
684
|
640
|
93,5
|
561
|
324
|
57,8
|
Qatar
|
|
Kuvajt
|
535
|
239
|
44,6
|
0
|
-
|
-
|
Kuwait
|
|
Libija
|
1 792
|
1 000
|
55,8
|
-
|
0
|
-
|
Libya
|
|
Nigerija
|
424
|
218
|
51,4
|
6
|
-
|
-
|
Nigeria
|
|
Saudijska Arabija
|
4 137
|
10 919
|
263,9
|
3 994
|
122
|
3,0
|
Saudi Arabia
|
|
Ujedinjeni Arapski Emirati
|
230
|
2 285
|
994,8
|
1 051
|
506
|
48,1
|
United Arab Emirates
|
|
Venezuela
|
-
|
-
|
-
|
0
|
0
|
367,6
|
Venezuela
|
|
|
|
|
|
|
|
|
|
|
Ostale europske zemlje
|
21 923
|
18 339
|
83,7
|
147 661
|
17 749
|
12,0
|
Other countries in Europe
|
|
Bjelorusija
|
722
|
1 147
|
158,9
|
41
|
21
|
51,7
|
Belarus
|
|
Rusija
|
14 035
|
12 436
|
88,6
|
133 011
|
3 970
|
3,0
|
Russian Federation
|
|
Turska
|
4 281
|
3 917
|
91,5
|
11 330
|
12 377
|
109,2
|
Turkey
|
|
Ukrajina
|
2 884
|
816
|
28,3
|
2 960
|
1 376
|
46,5
|
Ukraine
|
|
Ostale zemlje
|
-
|
22
|
-
|
319
|
5
|
1,6
|
Other countries
|
|
|
|
|
|
|
|
|
|
|
Ostale azijske zemlje
|
44 658
|
42 192
|
94,5
|
107 181
|
59 783
|
55,8
|
Other countries in Asia
|
|
Azerbajdžan
|
1 533
|
96
|
6,3
|
-
|
14
|
-
|
Azerbaijan
|
|
Bangladeš
|
248
|
275
|
110,9
|
743
|
862
|
116,1
|
Bangladesh
|
|
Filipini
|
432
|
1
|
0,2
|
37
|
127
|
341,3
|
Philippines
|
|
Hong Kong, Kina
|
329
|
353
|
107,2
|
1 350
|
258
|
19,1
|
Hong Kong, China
|
|
Indija
|
374
|
150
|
40,1
|
5 664
|
6 069
|
107,1
|
India
|
|
Indonezija
|
555
|
80
|
14,5
|
572
|
952
|
166,4
|
Indonesia
|
|
Izrael
|
4 027
|
1 950
|
48,4
|
1 207
|
833
|
69,0
|
Israel
|
|
Japan
|
29 030
|
28 437
|
98,0
|
1 259
|
1 867
|
148,3
|
Japan
|
|
Kazahstan
|
398
|
168
|
42,3
|
49 210
|
24
|
0,0
|
Kazakhstan
|
|
Kina
|
4 257
|
4 617
|
108,5
|
32 220
|
37 648
|
116,8
|
China
|
|
Koreja, Republika
|
631
|
1 283
|
203,4
|
7 119
|
4 131
|
58,0
|
Korea, Republic of
|
|
Libanon
|
985
|
726
|
73,7
|
1
|
0
|
20,8
|
Lebanon
|
|
Malezija
|
47
|
96
|
202,6
|
907
|
927
|
102,2
|
Malaysia
|
|
Pakistan
|
-
|
789
|
-
|
386
|
687
|
177,9
|
Pakistan
|
|
Singapur
|
469
|
166
|
35,5
|
313
|
131
|
41,9
|
Singapore
|
|
Sirija
|
17
|
-
|
-
|
-
|
-
|
-
|
Syrian Arab Republic
|
|
Tajland
|
28
|
49
|
173,4
|
1 929
|
991
|
51,4
|
Thailand
|
|
Tajvan, Kina
|
71
|
163
|
228,5
|
2 167
|
2 123
|
98,0
|
Taiwan, China
|
|
Vijetnam
|
751
|
910
|
121,3
|
1 656
|
1 677
|
101,3
|
Viet Nam
|
|
Ostale zemlje
|
476
|
1 881
|
395,0
|
441
|
462
|
104,9
|
Other countries
|
|
|
|
|
|
|
|
|
|
|
Ostale afričke zemlje
|
11 645
|
7 323
|
62,9
|
2 646
|
8 077
|
305,2
|
Other countries in Africa
|
|
Egipat
|
5 439
|
5 585
|
102,7
|
433
|
1 007
|
232,3
|
Egypt
|
|
Gana
|
-
|
32
|
-
|
68
|
2
|
2,4
|
Ghana
|
|
Južnoafrička Republika
|
2 097
|
103
|
4,9
|
117
|
4 675
|
1)
|
South Africa
|
|
Liberija
|
102
|
-
|
-
|
-
|
-
|
-
|
Liberia
|
|
Maroko
|
1 990
|
115
|
5,8
|
70
|
37
|
53,4
|
Morocco
|
|
Tunis
|
1 622
|
74
|
4,5
|
1 841
|
2 246
|
122,0
|
Tunisia
|
|
Ostale zemlje
|
395
|
1 413
|
357,6
|
118
|
109
|
92,4
|
Other countries
|
|
|
|
|
|
|
|
|
|
|
Ostale američke zemlje
|
30 189
|
22 973
|
76,1
|
27 057
|
18 288
|
67,6
|
Other countries in America
|
|
Argentina
|
33
|
0
|
1,5
|
1 962
|
3 954
|
201,6
|
Argentina
|
|
Brazil
|
1 493
|
488
|
32,7
|
11 298
|
2 394
|
21,2
|
Brazil
|
|
Čile
|
23
|
2
|
9,2
|
1
|
28
|
1)
|
Chile
|
|
Kanada
|
634
|
1 267
|
199,8
|
691
|
811
|
117,3
|
Canada
|
|
Kolumbija
|
11 598
|
-
|
-
|
274
|
102
|
37,2
|
Colombia
|
|
Meksiko
|
1 253
|
1 218
|
97,3
|
357
|
742
|
208,0
|
Mexico
|
|
Peru
|
511
|
7
|
1,3
|
23
|
23
|
98,5
|
Peru
|
|
SAD
|
14 390
|
19 205
|
133,5
|
10 234
|
10 181
|
99,5
|
United States
|
|
Ostale zemlje
|
253
|
784
|
309,8
|
2 217
|
54
|
2,4
|
Other countries
|
|
|
|
|
|
|
|
|
|
|
Oceanijske zemlje
|
1336
|
1036
|
77,6
|
227
|
326
|
143,3
|
Countries of Oceania
|
|
Australija
|
774
|
502
|
64,9
|
158
|
196
|
124,2
|
Australia
|
|
Maršalovi Otoci
|
-
|
509
|
-
|
-
|
0
|
-
|
Marshall Islands
|
|
Novi Zeland
|
14
|
22
|
152,6
|
70
|
130
|
186,3
|
New Zealand
|
|
Ostale zemlje
|
547
|
3
|
0,6
|
0
|
-
|
-
|
Other countries
|
|
|
|
|
|
|
|
|
|
|
Neraspoređeno
|
859
|
766
|
89,2
|
8 774
|
6 630
|
75,6
|
Not classified
|
1) Indeks
je veći od 999.
1) The
index exceeds 999.
|
METODOLOŠKA
OBJAŠNJENJA
|
|
NOTES
ON METHODOLOGY
|
|
|
|
|
|
|
|
|
|
Pridruživanjem
Republike Hrvatske Europskoj uniji 1. srpnja 2013. statistički podaci o
robnoj razmjeni Republike Hrvatske s inozemstvom dobivaju se iz dva različita
izvora: Intrastatova obrasca za statistiku robne razmjene između zemalja
članica EU-a (Intrastat) i Jedinstvene carinske deklaracije za statistiku
robne razmjene sa zemljama nečlanicama EU-a (Extrastat).
|
|
After
the accession of the Republic of Croatia to the European Union, on 1 July
2013, data on foreign trade in goods statistics of the Republic of Croatia
are acquired from two different sources: the Intrastat form for the
statistics on the trading in goods between EU Member States (Intrastat) and
the Single Administrative Document for statistics on the trading in goods
with non-EU countries (Extrastat).
|
|
|
|
|
|
|
|
|
|
Pravna
osnova
|
|
Legal
basis
|
|
|
|
|
|
Pravna
osnova za provođenje istraživanja Intrastat jest europsko zakonodavstvo za
statistiku robne razmjene između zemalja članica EU-a (Uredba br. 638/2004.
i dopune navedene Uredbe br. 222/2009. i 659/2014. Europskog parlamenta i
Vijeća te provedbena Uredba Komisije br. 1982/2004. i dopune Uredbe
Komisije br. 1915/2005., 91/2010. i 96/2010. i 1093/2013.), Zakon o
službenoj statistici (NN, br. 103/03., 75/09. i 59/12.), Godišnji
provedbeni plan statističkih aktivnosti Republike Hrvatske (NN, br.
21/15.), Program statističkih aktivnosti Republike Hrvatske (NN, br.
69/13.), Zakon o carinskoj službi (NN, br. 68/13. i 30/14.).
|
|
The
legal basis for the conduct of the Intrastat survey is the European
legislation related to the statistics on the trading in goods between EU
Member States (Regulation No 638/2004 and amending regulations Nos 222/2009
and 659/2014 of the European Parliament and of the Council as well as the
Commission Implementing Regulation No 1982/2004 and the Commission amending
regulations Nos 1915/2005, 91/2010, 96/2010 and 1093/2013), the Official
Statistics Act (NN, Nos 103/03, 75/09 and 59/12), the Annual Implementation
Plan of Statistical Activities of the Republic of Croatia (NN, No. 21/15),
the Programme of Statistical Activities of the Republic of Croatia (NN, No.
69/13) and the Customs Administration Act (NN, Nos. 68/13 and 30/14).
|
|
|
|
|
|
Pravna
osnova za Extrastat jest europsko zakonodavstvo za statistiku robne
razmjene s trećim zemljama (Uredba (EZ-a) br. 471/2009. Europskog
parlamenta i Vijeća, Uredba Komisije (EU-a) br. 92/2010. i Uredba Komisije
(EU-a) br. 113/2010.), Zakon o provedbi carinskih propisa Europske unije
(NN, br. 54/13.), Zakon o službenoj statistici (NN, br. 103/03., 75/09. i
59/12.), Godišnji provedbeni plan statističkih aktivnosti Republike
Hrvatske (NN, br. 21/15.), Program statističkih aktivnosti Republike
Hrvatske (NN, br. 69/13.), Zakon o carinskoj službi (NN, br. 68/13.) i
Pravilnik o popunjavanju Jedinstvene carinske deklaracije (NN, br. 77/13.).
|
|
The
legal basis for the Extrastat is the European legislation related to the
statistics on the trading in goods with third countries (the Regulation
(EC) No 471/2009 of the European Parliament and of the Council, the
Commission Regulation (EU) No 92/2010 and the Commission Regulation (EU) No
113/2010), the EU Customs Regulations Implementation Act (NN, No. 54/13),
the Official Statistics Act (NN, Nos 103/03, 75/09 and 59/12), the Annual
Implementation Plan of Statistical Activities of the Republic of Croatia
(NN, No. 21/15), the Programme of Statistical Activities of the Republic of
Croatia (NN, No. 69/13), the Customs Administration Act (NN, No. 68/13) and
the Ordinance on Filling the Single Administrative Document (NN, No.
77/13).
|
|
|
|
|
|
|
|
|
|
Izvori
podataka
|
|
Data
sources
|
|
|
|
|
|
Izvor
podataka za statistiku robne razmjene sa zemljama članicama EU-a jest
Intrastatov obrazac kojim izvještajne jedinice izvješćuju primitke i/ili
otpreme na mjesečnoj osnovi, tj. u mjesecu u kojem roba fizički ulazi ili
napušta teritorij Republike Hrvatske. Izvještajne jedinice jesu svi
poslovni subjekti, obveznici poreza na dodanu vrijednost, čija vrijednost
robne razmjene sa zemljama članicama EU-a prelazi prag uključivanja
određenoga za izvještajnu godinu. Za 2015. određena je vrijednost praga
uključivanja za primitke od 1,8 milijuna kuna, a za otpreme od 1 milijun
kuna. Radi potpunog usklađivanja s metodologijom i zakonodavstvom EU-a u
podatke od siječnja 2014., objavljene u ovom priopćenju, uključena je
vrijednost trgovine ispod praga uključivanja, procijenjena na osnovi
podataka o isporukama i stjecanjima dobara u zemlje članice / iz zemalja
članica EU-a, dobivenih od Porezne uprave Republike Hrvatske.
|
|
The
data source for the statistics on the trading in goods with EU Member
States is the Intrastat form used by reporting units to report on arrivals
and/or dispatches on the monthly basis, that is, in a month in which goods
physically enter or leave the territory of the Republic of Croatia. The
reporting units are all business entities, value added tax payers, whose
value of trading in goods with EU Member States exceeds the exemption
threshold determined for the reference year. For 2015, the value of 1.8
million kuna of the exemption threshold for arrivals and 1 million kuna for
dispatches has been determined. In order to achieve the complete
harmonisation with the EU methodology and legislation, the data from
January 2014 issued in this first release, have been supplemented with the
trade value below the exemption threshold, after being estimated on the
basis of data on supplies and acquisitions of goods in/from EU Member
States provided by the Tax Administration Office of the Republic of
Croatia.
|
|
|
|
|
|
Izvor
podataka za statistiku robne razmjene s trećim zemljama, odnosno zemljama
nečlanicama EU-a jesu Jedinstvene carinske deklaracije o izvozu i uvozu
robe. Državni zavod za statistiku Republike Hrvatske dobiva od Carinske
uprave Republike Hrvatske kontrolirane Jedinstvene carinske deklaracije u
obliku slogova.
|
|
The
data source for the statistics on the trading in goods with third
countries, that is, non-EU countries, are Single Administrative Documents
on export and import of goods. The Croatian Bureau of Statistics receives
the reviewed Single Administrative Documents from the Customs
Administration of the Republic of Croatia in the form of data records.
|
|
|
|
|
|
Poštujući
osnovne metodološke preporuke Statističkog ureda UN-a i Eurostata, Državni
zavod za statistiku prikupljene podatke Intrastata i Extrastata statistički
obrađuje i objavljuje kao jedinstveni podatak robne razmjene Republike
Hrvatske s inozemstvom.
|
|
Following
the basic methodological recommendations of the UN Statistical Office and
Eurostat, the Croatian Bureau of Statistics statistically processes and
disseminates the collected Intrastat and Extrastat data as unique
information on the foreign trade in goods of the Republic of Croatia.
|
|
|
|
|
|
|
|
|
|
Obuhvat
i usporedivost
|
|
Coverage
and comparability
|
|
|
|
|
|
Statistika
robne razmjene s inozemstvom obuhvaća svu robu koja se izvozi iz zemlje
odnosno uvozi u zemlju. U podatke o robnoj razmjeni s inozemstvom uključeni
su i izvoz i uvoz prema osnovi unutarnje i vanjske proizvodnje na bruto
osnovi.
|
|
The
statistics on foreign trade in goods comprises all the goods exported from
or imported into the country. Data on foreign trade in goods include both
export and import based on gross inward and outward processing.
|
|
|
|
|
|
Iskazuju
se stvarno postignute vrijednosti u vrijeme kad su poslovi zaključeni
(fakturne vrijednosti) i preračunavaju se na osnovi isporuke na hrvatskoj
granici.
|
|
The
values expressed are actual values achieved at the time when deals were
contracted (invoice values), which are then further recalculated according
to deliveries at the Croatian border.
|
|
|
|
|
|
Statistička
vrijednost robe jest vrijednost robe na hrvatskoj granici. Kod izvoza
odnosno otprema vrijednosti su prikazane prema paritetu fob, a kod uvoza
odnosno primitika vrijednosti se prikazuju prema paritetu cif.
|
|
The
statistical value of goods is the value of goods at the Croatian border.
The values for exports, that is dispatches, are shown as an FOB-type value,
while the values for imports, that is arrivals, are shown as a CIF-type
value.
|
|
|
|
|
|
Iznosi
u stranim valutama preračunani su u kune, eure i američke dolare primjenom
tekućih dnevnih tečajnih lista koje vrijede na dan carinjenja robe, a od 1.
srpnja 2013. primjenom mjesečnih tečajnih lista određenih za izvještajni
mjesec. Primjenjuje se srednji valutni tečaj Hrvatske narodne banke.
|
|
The
amounts expressed in foreign currencies are converted into kuna, euros and
American dollars according to the current daily exchange rate lists valid
on the day customs duties are levied, while since 1 July 2013 according to
the monthly exchange rate lists determined for the reporting month. The
mean exchange rate of the Croatian National Bank is used.
|
|
|
|
|
|
U
pojedinim tablicama može se dogoditi da ukupni zbroj ne odgovara zbroju
pojedinačnih stavki zbog zaokruživanja na tisuće.
|
|
In
certain tables, the sum total may not equal the sum of individual figures
due to the rounding to thousands.
|
|
|
|
|
|
Od 1.
siječnja 2002. u prikupljanju podataka primjenjuje se osmomjesna šifra
Kombinirane nomenklature, carinske i statističke klasifikacije proizvoda
Europske unije, koja je usklađena do razine šestomjesne šifre proizvoda s
Harmoniziranim sustavom.
|
|
Since 1
January 2002, the 8-digit code of the Combined Nomenclature, the EU customs
and statistical classification of products, has been used in data
collection and it is harmonised up to the 6-digit code level with the
Harmonised system.
|
|
|
|
|
|
U
prikazivanju podataka po djelatnostima primjenjuje se NKD 2007. (NN, br.
58/07. i 72/07.), koji je stupio na snagu 1. siječnja 2008. Utemeljen je na
europskoj klasifikaciji NACE, Rev. 2, koja je obvezatna za zemlje članice
Europske unije. Uvođenje NKD-a 2007. katkad dovodi do prekida vremenskih
serija s obzirom na promjene u strukturi klasifikacije. Sve bitne promjene
koje su se dogodile u klasifikaciji objavljene su u Metodologiji za
statističku primjenu Nacionalne klasifikacije djelatnosti 2007. – NKD 2007.
(NN, br. 102/07., 123/08. i 90/13.).
|
|
Data by
type of activities have been presented according to the NKD 2007.
(NN, Nos 58/07 and 72/07), which entered into force on 1 January
2008 and is based on the European classification NACE, Rev. 2, which is
obligatory in the EU Member States. The implementation of NKD 2007. leads
occasionally to the break in time series due to the changes in
classification's structure. All relevant changes in the classification were
published in the Methodology for Statistical Implementation of the National
Classification of Activities, 2007 version – NKD 2007. (NN, Nos 102/07,
123/08 and 90/13).
|
|
|
|
|
|
Podaci
se iskazuju prema proizvodnom načelu kod kojeg se podaci za izvoz i uvoz
dobivaju prema djelatnosti koja proizvodi dotični proizvod, odnosno iz koje
proizvod potječe.
|
|
Data
are presented by using the production approach according to which export
and import data are reported according to the manufacturing activity from
which the product originates.
|
|
|
|
|
|
Roba
koja se pojavljuje u izvozu i uvozu za potrebe statistike razvrstava se
prema Standardnoj međunarodnoj trgovinskoj klasifikaciji (SMTK, Rev. 4).
|
|
Goods
listed under export and import are classified, for statistical needs,
according to the Standard International Trade Classification (SITC, Rev.
4).
|
|
|
|
|
|
|
|
|
|
Podaci
se iskazuju kod izvoza robe prema zemljama namjene, a od 1. srpnja
2013. kod uvoza robe primjenjuje se novi metodološki kriterij iskazivanja
podataka uvoza prema zemljama. U Extrastatu se kod uvoza robe podaci
iskazuju prema zemljama podrijetla robe, dok se kod primitaka robe u
Intrastatu iskazuju prema zemljama otpreme.
|
|
Data on
the export are shown by countries of destination, while since 1 July
2013, a new methodological criterion has been applied, by which data on the
import are shown by countries. In Extrastat, data on the import are shown by
countries of the origin of goods, while in Intrastat data on the arrivals
of goods are presented by countries of dispatch.
|
|
|
|
|
|
Za
određeni mjesec obrađuju se samo Jedinstvene carinske deklaracije koje
imaju datum prihvaćanja u carinarnici/ispostavi iz tog mjeseca i
Intrastatovi obrasci dostavljeni za izvještajni mjesec. U tekućoj godini
mijenjaju se već objavljeni podaci za prijašnje mjesece radi razvrstavanja
naknadno pristiglih i/ili ispravljenih Intrastatovih obrazaca i
Jedinstvenih carinskih deklaracija koje se odnose na prijašnja razdoblja.
|
|
Only
Single Administrative Documents containing the date of acceptance in the
customs office in a particular month are processed for that month as well
as Intrastat forms submitted for the reporting month. The already issued
data for previous months are changed during the current year in order to
classify later received and/or corrected Intrastat forms and Single
Administrative Documents from previous periods.
|
|
|
|
|
|
Mjesečni
podaci ispravljaju se sve dok se ne zaključi konačna obrada tekuće godine
(sredinom sljedeće godine). Mjesečni rezultati sve do konačne obrade tekuće
godine i objavljivanja konačnih podataka smatraju se privremenima.
|
|
The
monthly data are corrected until the final data processing for the current
year is done (the middle of the next year). The monthly data are considered
provisional until the final processing of the current year and
dissemination of the final data are done.
|
|
|
|
|
|
|
|
|
|
|
|
|
|
Kratice
|
|
Abbreviations
|
|
|
|
|
|
BEC
|
Međunarodna klasifikacija ekonomske namjene proizvoda
|
|
BEC
|
Classification by Broad Economic Categories
|
|
Cefta
|
Sporazum o slobodnoj trgovini srednjoeuropskih
zemalja
|
|
CEFTA
|
Central European Free Trade Agreement
|
|
cif
|
cijena s osiguranjem i vozarinom
|
|
CIF
|
cost, insurance and freight
|
|
d. n.
|
drugdje nespomenuto
|
|
EFTA
|
European Free Trade Association
|
|
Efta
|
Europsko udruženje za slobodnu trgovinu
|
|
EU
|
European Union
|
|
EU
|
Europska unija
|
|
Eurostat
|
Statistical Office of the European Communities
|
|
EZ
|
Europska zajednica
|
|
FOB
|
free on board
|
|
Eurostat
|
Statistički ured Europske unije
|
|
mln
|
million
|
|
fob
|
franko brod
|
|
NACE
|
Statistical Classification of Economic Activities
|
|
mil.
|
milijun
|
|
|
in the European Community
|
|
NACE
|
Statistička klasifikacija ekonomskih djelatnosti u
|
|
n. e. c.
|
not elsewhere classified
|
|
|
Europskoj zajednici
|
|
n. e. s.
|
not elsewhere specified
|
|
NKD 2007.
|
Nacionalna klasifikacija djelatnosti, verzija 2007.
|
|
NKD 2007.
|
National Classification of Activities, 2007 version
|
|
NN
|
Narodne novine
|
|
NN
|
Narodne novine, official gazette of the Republic of
Croatia
|
|
OPEC
|
Organizacija zemalja izvoznica nafte
|
|
OPEC
|
Organization of Petroleum Exporting Countries
|
|
SAD
|
Sjedinjene Američke Države
|
|
SITC
|
Standard International Trade Classification
|
|
SMTK
|
Standardna međunarodna trgovinska klasifikacija
|
|
UN
|
United Nations
|
|
tis.
|
tisuća
|
|
US $
|
American dollar
|
|
UN
|
Ujedinjeni narodi
|
|
|
|
|
USD
|
američki dolar
|
|
|
|
|
|
|
|
|
|
|
|
|
Znakovi
|
|
Symbols
|
|
|
|
|
|
-
|
nema
pojave
|
|
-
|
no
occurrence
|
|
0
|
podatak
je manji od 0,5 upotrijebljene mjerne jedinice
|
|
0
|
value
non zero but less than 0.5 of the unit of measure used
|
|
|
|
|
|
|
|
Objavljuje
i tiska Državni zavod za statistiku Republike Hrvatske, Zagreb, Ilica 3, p.
p. 80.
Published
and printed by the Croatian Bureau of Statistics, Zagreb, Ilica 3, P. O. B.
80
Telefon/ Phone:
+385 (0) 1 4806-111, telefaks/ Fax: +385 (0) 1 4817-666
Odgovara
ravnatelj Marko Krištof.
Person
responsible: Marko Krištof, Director General
Priredile:
Vesna Polančec i Zrinka Lokas
Prepared
by:
Vesna Polančec and Zrinka Lokas
|
|
MOLIMO
KORISNIKE DA PRI KORIŠTENJU PODATAKA NAVEDU IZVOR.
USERS
ARE KINDLY REQUESTED TO STATE THE SOURCE
|
|
Naklada:
20 primjeraka
20 copies
printed
Podaci iz
ovog priopćenja objavljuju se i na internetu.
First
Release data are also published on the Internet.
Služba za
komunikaciju s korisnicima
User
Communication Department
|
· Informacije
i korisnički zahtjevi
Information
and user requests
|
· Pretplata
publikacija
Subscription
|
· Novinarski
upiti
Press corner
|
|
Telefon/ Phone:
+385 (0) 1 4806-138, 4806-154, 4811-212
Elektronička
pošta/ E-mail:
stat.info@dzs.hr
Telefaks/ Fax:
+385 (0) 1 4806-148, 4806-199
|
Telefon/ Phone:
+385 (0) 1 4814-791
Elektronička
pošta/ E-mail:
prodaja@dzs.hr
Telefaks/ Fax:
+385 (0) 1 4806-148, 4806-199
|
Telefon/ Phone:
+385 (0) 1 4806-121, 4806-196
Elektronička
pošta/ E-mail:
press@dzs.hr
Telefaks/ Fax:
+385 (0) 1 4806-148, 4806-199
|
|