|

GODINA/ YEAR: LII. ZAGREB, 11.
TRAVNJA 2016./ 11 APRIL, 2016 BROJ/ NUMBER: 9.2.7/4.
ANKETA O RADNOJ SNAZI LABOUR
FORCE SURVEY
|
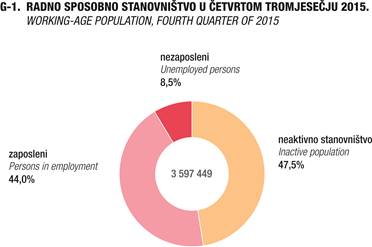
Ovo priopćenje donosi rezultate Ankete o radnoj
snazi (ARS) za tromjesečno razdoblje od listopada do prosinca 2015.
|
|
This
issue of the first release presents the Labour Force Survey results related
to the quarterly period from October to December 2015.
|
|
|
|
|
|
Budući
da je metodologija Ankete usklađena s onom koju propisuje Statistički ured
Europske unije (Eurostat), rezultati za Republiku Hrvatsku redovito se
objavljuju na internetskim stranicama i u svim Eurostatovim publikacijama
te omogućuju usporedbu sa svim zemljama članicama Europske unije.
|
|
As the
methodology for the Survey is harmonised with regulations of the
Statistical Office of the European Communities (Eurostat), results for the
Republic of Croatia are regularly published on web pages and in all
Eurostat's publications, thus enabling the comparison of the Republic of
Croatia with all EU Member States.
|
|
|
|
|
|
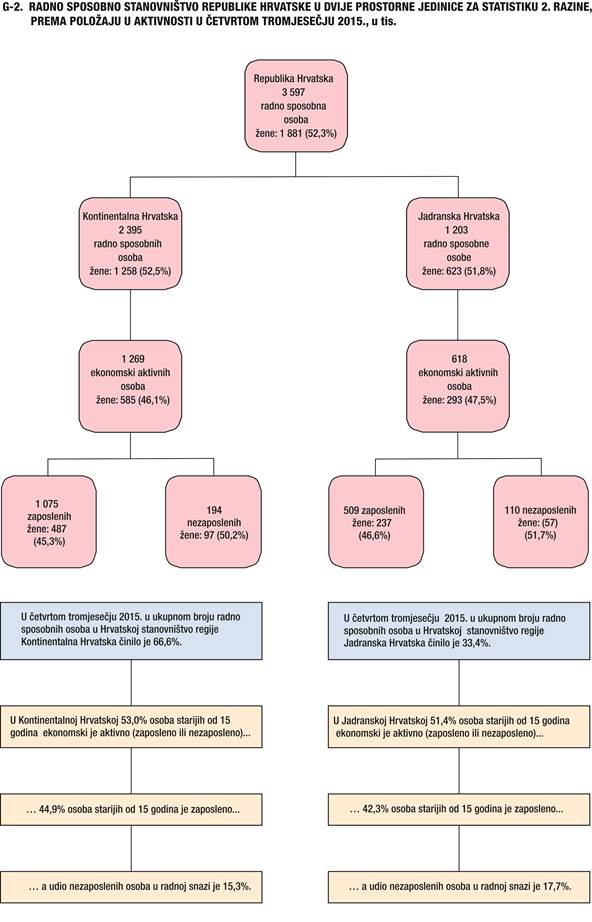
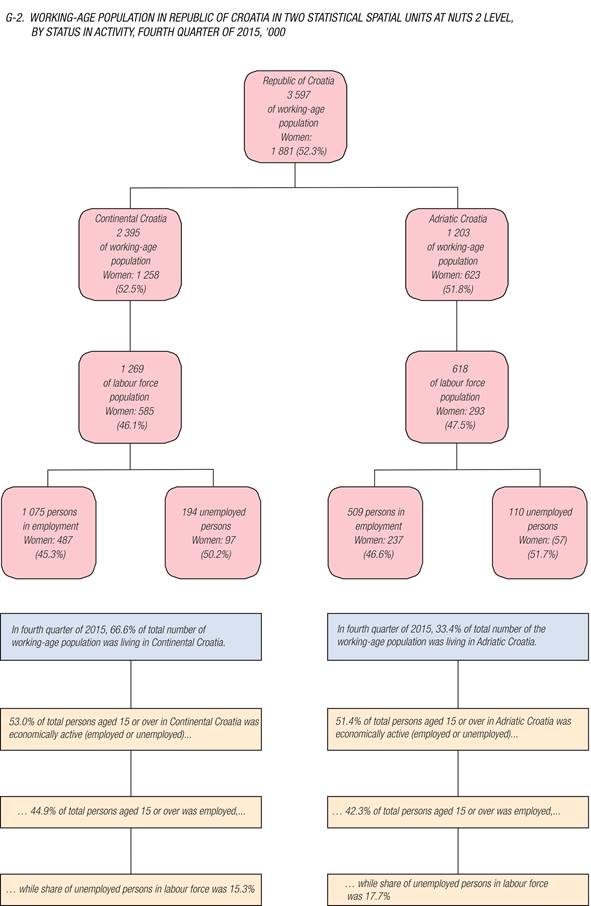
Priopćenje
za četvrto tromjesečje 2015. donosi i rezultate Ankete o radnoj snazi prema
NKPJS-u 2012. – 2. razina. Distribucija glavnih kategorija ekonomske
aktivnosti stanovništva pokazuje da je u Kontinentalnoj Hrvatskoj udio
radno sposobnih osoba starijih od 15 godina 2 395 000 ili 66,6% od
ukupnog broja radno sposobnog stanovništva u Hrvatskoj, dok je u Jadranskoj
Hrvatskoj 1 203 000 osoba, odnosno 33,4%. U Kontinentalnoj
Hrvatskoj udio je ekonomski aktivnoga u radno sposobnom stanovništvu 53,0%,
što je više od prosjeka Hrvatske (52,5%), dok Jadranska Hrvatska ima 51,4%
aktivnih stanovnika. Stopa zaposlenosti u Jadranskoj Hrvatskoj iznosi
42,3%, dok je u Kontinentalnoj Hrvatskoj 44,9%. U skladu s tim stopa
nezaposlenosti u Jadranskoj Hrvatskoj iznosi 17,7%, što je više od
hrvatskog prosjeka, dok u Kontinentalnoj Hrvatskoj iznosi 15,3%.
|
|
The
first release for the fourth quarter of 2015 also presents the Labour Force
Survey data at NUTS 2nd level. The distribution of the main
categories of economic activities of the population shows that the share of
working-age population, 2 395 000 of them in
particular, or 66.6% of the total number in the Republic of Croatia,
belonged to Continental Croatia, while Adriatic Croatia had
1 203 000 persons aged 15 or over, which accounted
for 33.4% of the total working-age population in the country. In Continental
Croatia, the share of economically active persons within the working-age
population was 53.0%, which was higher than the Croatian average (52.5%),
while Adriatic Croatia had 51.4% of active population. The employment rate
in Adriatic Croatia was 42.3%, while in the Continental Croatia it was
44.9%. Accordingly, the unemployment rate in Adriatic Croatia was 17.7%,
which was higher than the Croatian average, while in Continental Croatia it
amounted to 15.3%.
|
|
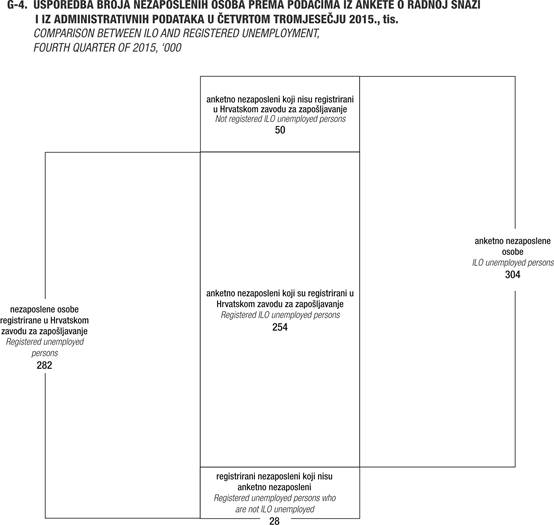
Usporedba
podataka o nezaposlenima dobivenih Anketom prema podacima Hrvatskog zavoda
za zapošljavanje (HZZ-a) i drugih statističkih praćenja temeljenih na
administrativnim izvorima pokazuje da je u četvrtom tromjesečju 2015. stopa
nezaposlenosti prema podacima administrativnih evidencija veća (17,6%) od
stope anketne nezaposlenosti (16,1%). U tom razdoblju prosječan broj
nezaposlenih prema Anketi veći je za 22 000 od podataka Hrvatskog
zavoda za zapošljavanje, što upućuje na smanjenje broja nezaposlenih osoba
koje se prijavljuju na HZZ. Budući da su se anketirane osobe izjašnjavale o
prijavljenosti službi za zapošljavanje, usporedba podataka pokazuje da je
od ukupno 304 000 nezaposlenih prema Anketi njih 254 000 ili
83,7% prijavljeno službi za zapošljavanje. Ostalih 16,3% anketno
nezaposlenih nije bilo zainteresirano za prijavu službi za zapošljavanje.
Istodobno, od ukupno 282 000 registriranih u Hrvatskom zavodu za
zapošljavanje, njih 28 000 ili 9,8% ne zadovoljava međunarodne
kriterije nezaposlenosti.
|
|
The
comparison between the unemployment data obtained by the Labour Force
Survey according to the Croatian Employment Service and those obtained from
other administrative data records shows that in the fourth quarter of 2015
the unemployment rate obtained from the administrative records was higher
(17.6%) than the ILO unemployment rate (16.1%). In the same period, the average
number of unemployed persons according to the Survey exceeded the number
obtained from the Croatian Employment Service by 22 000 persons, which
indicates a decrease in the number of persons registering with the Croatian
Employment Service. Since the interviewed persons provided information on
their registration with the Croatian Employment Service, the data
comparison shows that 254 000, or 83.7%, out of the total of
304 000 unemployed persons were registered. The remaining 16.3% of
persons who were classified as unemployed in the Survey were not
registered. At the same time, 28 000, or 9.8%, of the total of 282 000
persons who were registered with the Croatian Employment Service did not
fulfil the international criteria of unemployment.
|
1. RADNO SPOSOBNO STANOVNIŠTVO PREMA AKTIVNOSTI I
SPOLU
WORKING-AGE
POPULATION, BY ACTIVITY AND SEX
|
|
X. – XII. 2014.
|
I. – III. 2015.
|
IV. – VI. 2015.
|
VII. – IX. 2015
|
X – XII. 2015.
|
|
|
|
|
|
|
|
|
|
|
|
|
|
Ukupno,
tis.
Total,
'000
|
|
|
|
|
|
|
|
|
|
|
|
|
Radno sposobno
stanovništvo (15+)
|
3 613
|
3 612
|
3 601
|
3 600
|
3 597
|
Working-age population (15+)
|
|
|
|
|
|
|
|
|
|
Aktivno stanovništvo
|
1 899
|
1 883
|
1 896
|
1 927
|
1 888
|
Labour force
|
|
Zaposleni
|
1 552
|
1 543
|
1 602
|
1 629
|
1 584
|
Persons in employment
|
|
Nezaposleni
|
347
|
340
|
295
|
297
|
304
|
Unemployed persons
|
|
|
|
|
|
|
|
|
|
Neaktivno stanovništvo (15+)
|
1 714
|
1 728
|
1 705
|
1 673
|
1 710
|
Inactive population (15+)
|
|
|
|
|
|
|
|
|
|
|
|
|
%
|
|
|
|
|
|
|
|
|
|
|
|
|
Stopa aktivnosti
|
52,6
|
52,1
|
52,7
|
53,5
|
52,5
|
Activity rate
|
|
Stopa zaposlenosti
|
43,0
|
42,7
|
44,5
|
45,3
|
44,0
|
Employment rate
|
|
Stopa nezaposlenosti
|
18,3
|
18,1
|
15,5
|
15,4
|
16,1
|
Unemployment rate
|
|
|
|
|
|
|
|
|
|
|
|
|
|
|
|
|
|
|
|
|
Muškarci,
tis.
Men,
'000
|
|
|
|
|
|
|
|
|
|
|
|
|
Radno sposobno
stanovništvo (15+)
|
1 725
|
1 724
|
1 718
|
1 718
|
1 717
|
Working-age population (15+)
|
|
|
|
|
|
|
|
|
|
Aktivno stanovništvo
|
1 027
|
1 014
|
1 015
|
1 029
|
1 010
|
Labour force
|
|
Zaposleni
|
841
|
831
|
859
|
881
|
860
|
Persons in employment
|
|
Nezaposleni
|
186
|
183
|
157
|
148
|
150
|
Unemployed persons
|
|
|
|
|
|
|
|
|
|
Neaktivno stanovništvo (15+)
|
697
|
710
|
703
|
689
|
707
|
Inactive population (15+)
|
|
|
|
|
|
|
|
|
|
|
|
|
%
|
|
|
|
|
|
|
|
|
|
|
|
|
Stopa aktivnosti
|
59,6
|
58,8
|
59,1
|
59,9
|
58,8
|
Activity rate
|
|
Stopa zaposlenosti
|
48,8
|
48,2
|
50,0
|
51,3
|
50,1
|
Employment rate
|
|
Stopa nezaposlenosti
|
18,1
|
18,1
|
15,4
|
14,4
|
14,8
|
Unemployment rate
|
|
|
|
|
|
|
|
|
|
|
|
|
|
|
|
|
|
|
|
|
Žene,
tis.
Women,
'000
|
|
|
|
|
|
|
|
|
|
|
|
|
Radno sposobno
stanovništvo (15+)
|
1 888
|
1 887
|
1 883
|
1 882
|
1 881
|
Working-age population (15+)
|
|
|
|
|
|
|
|
|
|
Aktivno stanovništvo
|
872
|
869
|
881
|
898
|
878
|
Labour force
|
|
Zaposleni
|
711
|
712
|
743
|
749
|
724
|
Persons in employment
|
|
Nezaposleni
|
161
|
157
|
138
|
150
|
154
|
Unemployed persons
|
|
|
|
|
|
|
|
|
|
Neaktivno stanovništvo (15+)
|
1 016
|
1 018
|
1 002
|
984
|
1 003
|
Inactive population (15+)
|
|
|
|
|
|
|
|
|
|
|
|
|
%
|
|
|
|
|
|
|
|
|
|
|
|
|
Stopa aktivnosti
|
46,2
|
46,1
|
46,8
|
47,7
|
46,7
|
Activity rate
|
|
Stopa zaposlenosti
|
37,6
|
37,8
|
39,5
|
39,8
|
38,5
|
Employment rate
|
|
Stopa nezaposlenosti
|
18,5
|
18,1
|
15,7
|
16,7
|
17,6
|
Unemployment rate
|
WORKING-AGE POPULATION, BY ACTIVITY, AGE GROUPS AND SEX
tis.
'000
|
|
X. – XII. 2014.
|
I. – III. 2015.
|
IV. – VI. 2015.
|
VII. – IX. 2015.
|
X – XII. 2015.
|
X. – XII. 2014
|
I. – III. 2015.
|
IV. – VI. 2015.
|
VII. – IX. 2015.
|
X – XII. 2015.
|
|
|
|
|
|
|
|
|
|
|
|
|
|
|
Aktivno stanovništvo
Labour force
|
|
|
Zaposleni
Persons in employment
|
|
|
|
Ukupno
Total
|
|
|
|
|
|
|
|
|
|
|
|
|
|
|
Ukupno
Total
|
1 899
|
1 883
|
1 896
|
1 927
|
1 888
|
1 552
|
1 543
|
1 602
|
1 629
|
1 584
|
|
|
|
|
|
|
|
|
|
|
|
|
|
15 – 24
|
172
|
161
|
142
|
170
|
174
|
86
|
86
|
85
|
100
|
98
|
|
25 – 49
|
1 212
|
1 214
|
1 227
|
1 226
|
1 200
|
1 013
|
1 007
|
1 045
|
1 060
|
1 029
|
|
50 – 64
|
485
|
480
|
499
|
508
|
488
|
425
|
422
|
443
|
447
|
431
|
|
65 i više
65 and over
|
(31)
|
(28)
|
(28)
|
(22)
|
(25)
|
(29)
|
(28)
|
(28)
|
(22)
|
(25)
|
|
55 – 64
|
253
|
256
|
274
|
273
|
264
|
219
|
227
|
247
|
238
|
231
|
|
15 – 64
|
1 869
|
1 855
|
1 868
|
1 905
|
1 862
|
1 523
|
1 515
|
1 574
|
1 608
|
1 559
|
|
20 – 64
|
1 831
|
1 819
|
1 839
|
1 862
|
1 821
|
1 513
|
1 503
|
1 560
|
1 588
|
1 544
|
|
25 – 29
|
224
|
226
|
221
|
221
|
209
|
173
|
174
|
172
|
179
|
172
|
|
15 – 29
|
396
|
387
|
363
|
391
|
384
|
259
|
260
|
257
|
280
|
270
|
|
|
|
|
|
|
|
|
|
|
|
|
|
|
|
Muškarci
Men
|
|
|
|
|
|
|
|
|
|
|
|
|
|
|
Ukupno
Total
|
1 027
|
1 014
|
1 015
|
1 029
|
1 010
|
841
|
831
|
859
|
881
|
860
|
|
|
|
|
|
|
|
|
|
|
|
|
|
15 – 24
|
104
|
94
|
86
|
99
|
100
|
51
|
49
|
53
|
61
|
59
|
|
25 – 49
|
630
|
627
|
639
|
642
|
629
|
530
|
523
|
551
|
567
|
550
|
|
50 – 64
|
277
|
277
|
273
|
275
|
267
|
244
|
243
|
239
|
241
|
239
|
|
65 i više
65 and over
|
(16)
|
((16))
|
(17)
|
((12))
|
((13))
|
(16)
|
((16))
|
(17)
|
((12))
|
((13))
|
|
55 – 64
|
160
|
164
|
164
|
159
|
155
|
138
|
143
|
146
|
138
|
135
|
|
15 – 64
|
1 011
|
998
|
998
|
1 017
|
997
|
825
|
815
|
842
|
869
|
847
|
|
20 – 64
|
989
|
978
|
981
|
993
|
973
|
819
|
808
|
833
|
858
|
838
|
|
25 – 29
|
120
|
119
|
118
|
118
|
113
|
93
|
93
|
96
|
100
|
95
|
|
15 – 29
|
224
|
213
|
205
|
217
|
214
|
144
|
141
|
148
|
161
|
154
|
|
|
|
|
|
|
|
|
|
|
|
|
|
|
|
Žene
Women
|
|
|
|
|
|
|
|
|
|
|
|
|
|
|
Ukupno
Total
|
872
|
869
|
881
|
898
|
878
|
711
|
712
|
743
|
749
|
724
|
|
|
|
|
|
|
|
|
|
|
|
|
|
15 – 24
|
68
|
67
|
56
|
71
|
74
|
(35)
|
(37)
|
(33)
|
40
|
39
|
|
25 – 49
|
582
|
587
|
588
|
585
|
571
|
483
|
484
|
495
|
493
|
480
|
|
50 – 64
|
208
|
202
|
226
|
233
|
220
|
180
|
179
|
204
|
206
|
193
|
|
65 i više
65 and over
|
((14))
|
((13))
|
((11))
|
((10))
|
((12))
|
((13))
|
((13))
|
((11))
|
((10))
|
((12))
|
|
55 – 64
|
93
|
93
|
110
|
114
|
109
|
81
|
84
|
101
|
100
|
96
|
|
15 – 64
|
858
|
857
|
870
|
888
|
866
|
698
|
700
|
732
|
739
|
712
|
|
20 – 64
|
842
|
840
|
858
|
869
|
848
|
695
|
695
|
727
|
731
|
706
|
|
25 – 29
|
104
|
107
|
102
|
102
|
96
|
80
|
81
|
76
|
79
|
77
|
|
15 – 29
|
172
|
174
|
158
|
173
|
170
|
115
|
118
|
109
|
119
|
116
|
|
|
|
|
|
|
|
|
|
|
|
|
|
|
Nezaposleni
Unemployed persons
|
|
|
Neaktivni
Inactive population
|
|
|
|
Ukupno
Total
|
|
|
|
|
|
|
|
|
|
|
|
|
|
|
Ukupno
Total
|
347
|
340
|
295
|
297
|
304
|
1 714
|
1 728
|
1 705
|
1 673
|
1 710
|
|
|
|
|
|
|
|
|
|
|
|
|
|
15 – 24
|
86
|
75
|
57
|
70
|
76
|
318
|
328
|
343
|
315
|
310
|
|
25 – 49
|
199
|
208
|
181
|
166
|
171
|
210
|
204
|
182
|
183
|
206
|
|
50 – 64
|
60
|
57
|
56
|
61
|
57
|
423
|
428
|
408
|
395
|
414
|
|
65 i više
65 and over
|
.
|
-
|
.
|
.
|
.
|
763
|
768
|
772
|
780
|
780
|
|
55 – 64
|
(34)
|
(29)
|
(27)
|
(35)
|
(33)
|
352
|
349
|
332
|
330
|
340
|
|
15 – 64
|
346
|
340
|
294
|
297
|
304
|
951
|
960
|
933
|
893
|
930
|
|
20 – 64
|
318
|
316
|
279
|
274
|
277
|
744
|
753
|
721
|
695
|
731
|
|
25 – 29
|
51
|
52
|
49
|
(42)
|
(37)
|
(46)
|
(43)
|
(43)
|
(43)
|
(53)
|
|
15 – 29
|
137
|
128
|
105
|
111
|
114
|
365
|
371
|
386
|
358
|
362
|
|
|
|
|
|
|
|
|
|
|
|
|
|
|
|
Muškarci
Men
|
|
|
|
|
|
|
|
|
|
|
|
|
|
|
Ukupno
Total
|
186
|
183
|
157
|
148
|
150
|
697
|
710
|
703
|
689
|
707
|
|
|
|
|
|
|
|
|
|
|
|
|
|
15 – 24
|
53
|
46
|
(34)
|
(39)
|
(41)
|
146
|
155
|
162
|
149
|
147
|
|
25 – 49
|
100
|
103
|
88
|
74
|
79
|
89
|
91
|
74
|
70
|
82
|
|
50 – 64
|
(33)
|
(34)
|
(34)
|
(34)
|
(29)
|
165
|
165
|
168
|
164
|
172
|
|
65 i više
65 and over
|
-
|
-
|
.
|
.
|
.
|
297
|
299
|
299
|
306
|
307
|
|
55 – 64
|
(22)
|
(21)
|
(18)
|
(21)
|
(20)
|
133
|
130
|
130
|
133
|
138
|
|
15 – 64
|
186
|
183
|
156
|
148
|
149
|
400
|
411
|
404
|
383
|
401
|
|
20 – 64
|
171
|
170
|
148
|
135
|
135
|
297
|
306
|
298
|
284
|
301
|
|
25 – 29
|
(27)
|
(26)
|
(23)
|
((18))
|
((19))
|
((18))
|
((18))
|
((15))
|
((16))
|
((20))
|
|
15 – 29
|
80
|
72
|
56
|
57
|
60
|
164
|
173
|
177
|
165
|
167
|
|
|
|
|
|
|
|
|
|
|
|
|
|
|
|
Žene
Women
|
|
|
|
|
|
|
|
|
|
|
|
|
|
|
Ukupno
Total
|
161
|
157
|
138
|
150
|
154
|
1 016
|
1 018
|
1 002
|
984
|
1 003
|
|
|
|
|
|
|
|
|
|
|
|
|
|
15 – 24
|
(33)
|
(30)
|
(23)
|
(31)
|
(35)
|
172
|
172
|
181
|
166
|
162
|
|
25 – 49
|
99
|
104
|
93
|
92
|
91
|
121
|
114
|
109
|
113
|
125
|
|
50 – 64
|
(28)
|
(23)
|
(22)
|
(27)
|
(28)
|
258
|
263
|
239
|
231
|
243
|
|
65 i više
65 and over
|
.
|
-
|
-
|
-
|
-
|
466
|
469
|
473
|
474
|
473
|
|
55 – 64
|
((12))
|
((9))
|
((9))
|
((14))
|
((13))
|
219
|
219
|
202
|
197
|
202
|
|
15 – 64
|
160
|
157
|
138
|
150
|
154
|
551
|
549
|
529
|
510
|
530
|
|
20 – 64
|
147
|
145
|
131
|
138
|
142
|
447
|
446
|
423
|
412
|
430
|
|
25 – 29
|
((24))
|
(26)
|
(26)
|
((24))
|
((19))
|
((29))
|
((25))
|
(27)
|
(27)
|
(33)
|
|
15 – 29
|
57
|
56
|
(49)
|
54
|
54
|
201
|
197
|
209
|
194
|
195
|
POPULATION ACTIVITY MEASURES, BY AGE GROUPS AND SEX
%
|
|
Stope aktivnosti
Activity rates
|
Stope zaposlenosti
Employment rates
|
Stope nezaposlenosti
Unemployment rates
|
|
|
X. – XII. 2014.
|
I. – III. 2015.
|
IV. – VI. 2015.
|
VII. – IX. 2015.
|
X – XII. 2015.
|
X. – XII. 2014.
|
I. – III. 2015.
|
IV. – VI. 2015.
|
VII. – IX. 2015.
|
X – XII. 2015.
|
X. – XII. 2014.
|
I. – III. 2015.
|
IV. – VI. 2015.
|
VII. – IX. 2015.
|
X – XII. 2015.
|
|
|
|
|
|
|
|
|
|
|
|
|
|
|
|
|
|
|
|
|
Ukupno
Total
|
|
|
|
|
|
|
|
|
|
|
|
|
|
|
|
|
|
|
|
Ukupno
Total
|
52,6
|
52,1
|
52,7
|
53,5
|
52,5
|
43,0
|
42,7
|
44,5
|
45,3
|
44,0
|
18,3
|
18,1
|
15,5
|
15,4
|
16,1
|
|
|
|
|
|
|
|
|
|
|
|
|
|
|
|
|
|
|
15 – 24
|
35,1
|
33,0
|
29,3
|
35,1
|
36,0
|
17,5
|
17,5
|
17,6
|
20,7
|
20,3
|
50,1
|
46,8
|
39,9
|
41,0
|
43,8
|
|
25 – 49
|
85,3
|
85,6
|
87,1
|
87,0
|
85,3
|
71,3
|
71,0
|
74,2
|
75,2
|
73,2
|
16,4
|
17,1
|
14,8
|
13,5
|
14,2
|
|
50 – 64
|
53,4
|
52,8
|
55,0
|
56,3
|
54,1
|
46,8
|
46,5
|
48,9
|
49,5
|
47,8
|
12,4
|
11,9
|
11,2
|
12,1
|
11,6
|
|
65 i više
65 and over
|
(3,9)
|
(3,6)
|
(3,6)
|
(2,7)
|
(3,1)
|
(3,6)
|
(3,6)
|
(3,5)
|
(2,7)
|
(3,1)
|
.
|
-
|
.
|
.
|
.
|
|
55 – 64
|
41,8
|
42,4
|
45,2
|
45,3
|
43,7
|
36,2
|
37,5
|
40,8
|
39,5
|
38,3
|
(13,5)
|
(11,5)
|
(9,8)
|
(12,9)
|
(12,3)
|
|
15 – 64
|
66,3
|
65,9
|
66,7
|
68,1
|
66,7
|
54,0
|
53,8
|
56,2
|
57,5
|
55,8
|
18,5
|
18,3
|
15,8
|
15,6
|
16,3
|
|
20 – 64
|
71,1
|
70,7
|
71,8
|
72,8
|
71,4
|
58,8
|
58,5
|
60,9
|
62,1
|
60,5
|
17,4
|
17,4
|
15,2
|
14,7
|
15,2
|
|
25 – 29
|
82,8
|
84,1
|
83,8
|
83,7
|
79,9
|
64,0
|
64,6
|
65,3
|
68,0
|
65,6
|
22,7
|
23,1
|
22,1
|
(18,8)
|
(17,9)
|
|
15 – 29
|
52,1
|
51,1
|
48,5
|
52,2
|
51,4
|
34,0
|
34,3
|
34,4
|
37,3
|
36,2
|
34,6
|
33,0
|
29,1
|
28,5
|
29,7
|
|
|
|
|
|
|
|
|
|
|
|
|
|
|
|
|
|
|
|
|
|
|
|
|
|
|
|
|
|
|
|
|
|
|
|
|
|
|
|
|
|
Muškarci
Men
|
|
|
|
|
|
|
|
|
|
|
|
|
|
|
|
|
|
|
|
|
|
|
|
Ukupno
Total
|
59,6
|
58,8
|
59,1
|
59,9
|
58,8
|
48,8
|
48,2
|
50,0
|
51,3
|
50,1
|
18,1
|
18,1
|
15,4
|
14,4
|
14,8
|
|
|
|
|
|
|
|
|
|
|
|
|
|
|
|
|
|
|
15 – 24
|
41,6
|
37,8
|
34,8
|
40,0
|
40,6
|
20,4
|
19,5
|
21,3
|
24,4
|
23,8
|
51,0
|
48,3
|
(39,0)
|
(39,1)
|
(41,2)
|
|
25 – 49
|
87,7
|
87,4
|
89,7
|
90,1
|
88,5
|
73,8
|
72,9
|
77,3
|
79,7
|
77,4
|
15,9
|
16,6
|
13,8
|
11,6
|
12,6
|
|
50 – 64
|
62,7
|
62,7
|
61,9
|
62,7
|
60,9
|
55,3
|
55,0
|
54,0
|
54,9
|
54,3
|
(11,8)
|
(12,2)
|
(12,6)
|
(12,4)
|
(10,8)
|
|
65 i više
65 and over
|
(5,1)
|
((4,9))
|
(5,4)
|
((3,8))
|
((4,1))
|
(5,1)
|
((4,9))
|
(5,3)
|
((3,7))
|
((4,0))
|
-
|
-
|
.
|
.
|
.
|
|
55 – 64
|
54,7
|
55,7
|
55,7
|
54,5
|
52,9
|
47,1
|
48,7
|
49,7
|
47,4
|
46,2
|
(13,7)
|
(12,7)
|
(10,7)
|
(13,1)
|
(12,7)
|
|
15 – 64
|
71,7
|
70,8
|
71,2
|
72,6
|
71,3
|
58,5
|
57,8
|
60,1
|
62,1
|
60,6
|
18,4
|
18,4
|
15,7
|
14,5
|
15,0
|
|
20 – 64
|
76,9
|
76,2
|
76,7
|
77,8
|
76,4
|
63,6
|
62,9
|
65,1
|
67,2
|
65,8
|
17,2
|
17,4
|
15,1
|
13,6
|
13,9
|
|
25 – 29
|
87,1
|
86,8
|
88,7
|
88,3
|
85,3
|
67,8
|
67,7
|
71,6
|
74,8
|
71,2
|
(22,2)
|
(22,0)
|
(19,2)
|
((15,2))
|
((16,5))
|
|
15 – 29
|
57,7
|
55,1
|
53,7
|
56,9
|
56,2
|
37,2
|
36,6
|
38,9
|
42,0
|
40,4
|
35,6
|
33,7
|
27,5
|
26,1
|
28,1
|
|
|
|
|
|
|
|
|
|
|
|
|
|
|
|
|
|
|
|
|
|
|
|
|
|
|
|
|
|
|
|
|
|
|
|
|
|
|
|
|
|
Žene
Women
|
|
|
|
|
|
|
|
|
|
|
|
|
|
|
|
|
|
|
|
|
|
|
|
Ukupno
Total
|
46,2
|
46,1
|
46,8
|
47,7
|
46,7
|
37,6
|
37,8
|
39,5
|
39,8
|
38,5
|
18,5
|
18,1
|
15,7
|
16,7
|
17,6
|
|
|
|
|
|
|
|
|
|
|
|
|
|
|
|
|
|
|
15 – 24
|
28,3
|
27,9
|
23,6
|
29,9
|
31,3
|
(14,5)
|
(15,4)
|
(13,8)
|
16,9
|
16,5
|
(48,8)
|
(44,7)
|
(41,4)
|
(43,6)
|
(47,3)
|
|
25 – 49
|
82,8
|
83,8
|
84,4
|
83,8
|
82,1
|
68,7
|
69,0
|
71,0
|
70,7
|
69,0
|
17,0
|
17,7
|
15,9
|
15,7
|
16,0
|
|
50 – 64
|
44,7
|
43,5
|
48,6
|
50,3
|
47,6
|
38,7
|
38,5
|
43,9
|
44,4
|
41,6
|
(13,2)
|
(11,5)
|
(9,5)
|
(11,7)
|
(12,6)
|
|
65 i više
65 and over
|
((3,0))
|
((2,7))
|
((2,4))
|
((2,1))
|
((2,5))
|
((2,6))
|
((2,7))
|
((2,4))
|
((2,1))
|
((2,5))
|
.
|
-
|
-
|
-
|
-
|
|
55 – 64
|
29,8
|
29,8
|
35,3
|
36,7
|
35,0
|
25,9
|
27,0
|
32,3
|
32,1
|
30,9
|
((13,1))
|
((9,3))
|
((8,3))
|
((12,5))
|
((11,9))
|
|
15 – 64
|
60,9
|
60,9
|
62,2
|
63,5
|
62,0
|
49,6
|
49,8
|
52,3
|
52,8
|
51,0
|
18,6
|
18,3
|
15,9
|
16,9
|
17,8
|
|
20 – 64
|
65,3
|
65,3
|
67,0
|
67,9
|
66,4
|
53,9
|
54,0
|
56,8
|
57,0
|
55,3
|
17,5
|
17,3
|
15,2
|
15,9
|
16,7
|
|
25 – 29
|
78,4
|
81,2
|
78,8
|
79,1
|
74,4
|
60,1
|
61,5
|
58,8
|
60,9
|
59,9
|
((23,3))
|
(24,3)
|
(25,4)
|
((23,0))
|
((19,5))
|
|
15 – 29
|
46,2
|
46,9
|
43,1
|
47,2
|
46,5
|
30,8
|
31,9
|
29,7
|
32,4
|
31,8
|
33,4
|
32,1
|
(31,0)
|
31,4
|
31,6
|
4. STRUKTURA RADNO
SPOSOBNOG STANOVNIŠTVA PREMA ŠKOLSKOJ SPREMI I SPOLU
STRUCTURE OF WORKING-AGE POPULATION, BY EDUCATIONAL ATTAINMENT
AND SEX
|
|
Radna snaga
Labour force
|
Neaktivni
Inactive population
|
|
|
|
zaposleni
Persons in employment
|
nezaposleni
Unemployed persons
|
|
|
|
X. – XII. 2014.
|
I. – III. 2015.
|
IV. – VI. 2015.
|
VII. – IX. 2015.
|
X. – XII. 2015.
|
X. – XII. 2014.
|
I. – III. 2015.
|
IV. – VI. 2015.
|
VII. – IX. 2015.
|
X. – XII. 2015.
|
X. – XII. 2014.
|
I. – III. 2015.
|
IV. – VI. 2015.
|
VII. – IX. 2015.
|
X. – XII. 2015.
|
|
|
|
|
|
|
|
|
|
|
|
|
|
|
|
|
|
|
|
|
|
Ukupno
Total
|
|
|
|
|
|
|
|
|
|
|
|
|
|
|
|
|
|
|
|
|
Ukupno
|
100,0
|
100,0
|
100,0
|
100,0
|
100,0
|
100,0
|
100,0
|
100,0
|
100,0
|
100,0
|
100,0
|
100,0
|
100,0
|
100,0
|
100,0
|
Total
|
|
|
|
|
|
|
|
|
|
|
|
|
|
|
|
|
|
|
|
Nezavršena
osnovna škola
|
((1,1))
|
((0,8))
|
((0,8))
|
((0,8))
|
((0,7))
|
.
|
((1,5))
|
.
|
.
|
((2,1))
|
10,1
|
11,2
|
10,2
|
9,5
|
10,3
|
Uncompleted
basic school
|
|
Osnovna
škola
|
9,1
|
8,8
|
9,6
|
10,2
|
9,0
|
14,7
|
12,2
|
13,8
|
15,5
|
(11,9)
|
34,7
|
34,3
|
34,2
|
33,1
|
32,6
|
Basic school
(8 years)
|
|
Strukovne
škole (niža i srednja stručna sprema)
|
60,5
|
59,9
|
58,5
|
59,2
|
59,6
|
68,3
|
69,8
|
65,5
|
64,4
|
67,5
|
38,5
|
37,5
|
37,9
|
39,9
|
39,0
|
Vocational
schools
|
|
Gimnazija
|
3,2
|
3,2
|
(2,8)
|
(2,8)
|
3,4
|
((3,8))
|
((4,0))
|
((3,8))
|
((4,0))
|
((4,3))
|
6,7
|
6,8
|
7,7
|
7,2
|
7,1
|
Grammar
school
|
|
Visoko
obrazovanje (stručni i sveučilišni studij, magisterij znanosti, doktorat)
|
26,1
|
27,3
|
28,2
|
27,0
|
27,3
|
(12,1)
|
(12,5)
|
(16,3)
|
15,2
|
14,2
|
10,0
|
10,2
|
10,1
|
10,3
|
11,0
|
Higher
education (professional and university study, masters of science degree,
doctorate)
|
|
|
|
|
|
|
|
|
|
|
|
|
|
|
|
|
|
|
|
|
|
|
|
|
|
|
|
|
|
|
|
|
|
|
|
|
|
|
Žene
Women
|
|
|
|
|
|
|
|
|
|
|
|
|
|
|
|
|
|
|
|
|
Ukupno
|
100,0
|
100,0
|
100,0
|
100,0
|
100,0
|
100,0
|
100,0
|
100,0
|
100,0
|
100,0
|
100,0
|
100,0
|
100,0
|
100,0
|
100,0
|
Total
|
|
|
|
|
|
|
|
|
|
|
|
|
|
|
|
|
|
|
|
Nezavršena
osnovna škola
|
((0,9))
|
((0,7))
|
((1,0))
|
((0,7))
|
((0,3))
|
.
|
.
|
.
|
.
|
.
|
12,8
|
14,0
|
12,9
|
12,5
|
13,5
|
Uncompleted
basic school
|
|
Osnovna
škola
|
9,7
|
9,9
|
11,2
|
11,3
|
9,8
|
(17,8)
|
(14,2)
|
(13,4)
|
(15,5)
|
(13,6)
|
39,0
|
38,5
|
38,5
|
38,0
|
37,2
|
Basic school
(8 years)
|
|
Strukovne
škole (niža i srednja stručna sprema)
|
54,0
|
52,2
|
50,4
|
51,5
|
52,2
|
62,2
|
65,7
|
62,3
|
61,1
|
63,8
|
31,8
|
30,7
|
31,0
|
31,8
|
31,6
|
Vocational
schools
|
|
Gimnazija
|
(3,7)
|
(3,7)
|
(3,6)
|
(3,9)
|
(3,9)
|
((4,6))
|
((6,1))
|
((5,0))
|
.
|
((5,6))
|
8,2
|
8,1
|
8,9
|
9,0
|
8,5
|
Grammar
school
|
|
Visoko
obrazovanje (stručni i sveučilišni studij, magisterij znanosti, doktorat)
|
31,6
|
33,5
|
33,9
|
32,6
|
33,8
|
(15,4)
|
(13,8)
|
(18,5)
|
(18,8)
|
(16,4)
|
8,2
|
8,7
|
8,7
|
8,7
|
9,2
|
Higher
education (professional and university study, masters of science degree,
doctorate)
|
|
|
|
|
|
|
|
|
|
|
|
|
|
|
|
|
|
|
|
|
Ukupno
Total
|
Muškarci
Men
|
Žene
Women
|
|
|
|
X. – XII.
2014.
|
I. – III.
2015.
|
IV. – VI. 2015.
|
VII. – IX. 2015.
|
X –XII. 2015.
|
X. – XII.
2014.
|
I. – III.
2015.
|
IV. – VI. 2015.
|
VII. – IX. 2015.
|
X –XII. 2015.
|
X. – XII.
2014.
|
I. – III.
2015.
|
IV. – VI. 2015.
|
VII. – IX. 2015.
|
X –XII. 2015.
|
|
|
|
|
|
|
|
|
|
|
|
|
|
|
|
|
|
|
|
|
|
|
|
|
|
|
u tis
'000.
|
|
|
|
|
|
|
|
|
|
|
|
|
|
|
|
|
|
|
|
|
|
|
|
|
|
Zaposleni
|
1 552
|
1 543
|
1 602
|
1 629
|
1 584
|
841
|
831
|
859
|
881
|
860
|
711
|
712
|
743
|
749
|
724
|
Persons in
employment
|
|
|
|
|
|
|
|
|
|
|
|
|
|
|
|
|
|
|
|
Zaposlenici
|
1 314
|
1 298
|
1 342
|
1 378
|
1 350
|
694
|
670
|
693
|
722
|
713
|
621
|
628
|
650
|
656
|
637
|
Persons in
paid employment
|
|
Samozaposleni
|
217
|
220
|
228
|
217
|
205
|
141
|
152
|
157
|
149
|
137
|
76
|
68
|
70
|
68
|
69
|
Self-employed
persons
|
|
Pomažući
članovi
|
(20)
|
(25)
|
(32)
|
(34)
|
(28)
|
((7))
|
((9))
|
((9))
|
((10))
|
((10))
|
((13))
|
(16)
|
(23)
|
(24)
|
(18)
|
Unpaid
family workers
|
|
|
|
|
|
|
|
|
|
|
|
|
|
|
|
|
|
|
|
|
|
|
|
|
|
|
|
|
|
|
|
|
|
|
|
|
|
|
|
|
|
|
|
|
|
%
|
|
|
|
|
|
|
|
|
|
|
|
|
|
|
|
|
|
|
|
|
|
|
|
|
|
|
Zaposleni
|
100,0
|
100,0
|
100,0
|
100,0
|
100,0
|
100,0
|
100,0
|
100,0
|
100,0
|
100,0
|
100,0
|
100,0
|
100,0
|
100,0
|
100,0
|
Persons in
employment
|
|
|
|
|
|
|
|
|
|
|
|
|
|
|
|
|
|
|
|
Zaposlenici
|
84,7
|
84,2
|
83,8
|
84,6
|
85,3
|
82,5
|
80,8
|
80,7
|
81,9
|
82,9
|
87,3
|
88,1
|
87,4
|
87,7
|
88,1
|
Persons in
paid employment
|
|
Samozaposleni
|
14,0
|
14,2
|
14,2
|
13,3
|
13,0
|
16,7
|
18,2
|
18,3
|
16,9
|
15,9
|
10,8
|
9,6
|
9,5
|
9,1
|
9,5
|
Self-employed
persons
|
|
Pomažući
članovi
|
(1,3)
|
(1,6)
|
(2,0)
|
(2,1)
|
(1,7)
|
((0,8))
|
((1,0))
|
((1,0))
|
((1,2))
|
((1,2))
|
((1,9))
|
(2,3)
|
(3,1)
|
(3,2)
|
(2,4)
|
Unpaid
family workers
|
6. PROSJEČNI SATI RADA
NA GLAVNOM POSLU U REFERENTNOM TJEDNU PREMA SEKTORIMA DJELATNOSTI NKD-a 2007.
I SPOLU
AVERAGE HOURS ACTUALLY WORKED ON MAIN JOB DURING REFERENCE WEEK,
ACCORDING TO NKD 2007.
ACTIVITY SECTORS AND BY SEX
|
|
X. – XII. 2014.
|
I. – III. 2015.
|
IV. – VI. 2015.
|
VII. – IX. 2015.
|
X –XII. 2015.
|
|
|
|
|
|
|
|
|
|
|
|
|
|
Ukupno
Total
|
|
|
|
|
|
|
|
|
|
|
|
|
Ukupno
|
38,8
|
38,1
|
37,6
|
39,3
|
37,6
|
Total
|
|
|
|
|
|
|
|
|
|
Poljoprivredne
djelatnosti
|
35,2
|
29,3
|
33,2
|
34,7
|
31,3
|
Agriculture
|
|
Nepoljoprivredne
djelatnosti
|
39,9
|
39,0
|
37,7
|
40,2
|
38,8
|
Industry
|
|
Uslužne
djelatnosti
|
38,9
|
38,9
|
38,2
|
39,7
|
38,0
|
Services
|
|
|
|
|
|
|
|
|
|
|
|
|
|
|
|
|
|
|
|
|
Muškarci
Men
|
|
|
|
|
|
|
|
|
|
|
|
|
Ukupno
|
39,6
|
38,9
|
38,4
|
40,3
|
38,3
|
Total
|
|
|
|
|
|
|
|
|
|
Poljoprivredne
djelatnosti
|
39,1
|
32,4
|
36,2
|
38,0
|
34,1
|
Agriculture
|
|
Nepoljoprivredne
djelatnosti
|
40,0
|
39,3
|
38,2
|
40,4
|
38,7
|
Industry
|
|
Uslužne
djelatnosti
|
39,5
|
39,8
|
39,1
|
40,9
|
38,7
|
Services
|
|
|
|
|
|
|
|
|
|
|
|
|
|
|
|
|
|
|
|
|
Žene
Women
|
|
|
|
|
|
|
|
|
|
|
|
|
Ukupno
|
37,8
|
37,1
|
36,5
|
38,0
|
36,8
|
Total
|
|
|
|
|
|
|
|
|
|
Poljoprivredne
djelatnosti
|
28,5
|
24,1
|
28,2
|
28,9
|
26,3
|
Agriculture
|
|
Nepoljoprivredne
djelatnosti
|
39,4
|
38,3
|
36,6
|
39,4
|
38,8
|
Industry
|
|
Uslužne
djelatnosti
|
38,5
|
38,0
|
37,5
|
38,7
|
37,4
|
Services
|
PERSONS IN EMPLOYMENT, ACCORDING TO NKD 2007. AND BY SEX
tis.
‘000
|
|
Ukupno
Total
|
Muškarci
Men
|
Žene
Women
|
|
|
|
X. – XII. 2014.
|
I. – III. 2015.
|
IV. – VI. 2015.
|
VII. – IX. 2015.
|
X. –XII. 2015.
|
X. – XII. 2014.
|
I. – III. 2015.
|
IV. – VI. 2015.
|
VII. – IX. 2015.
|
X. –XII. 2015.
|
X. – XII. 2014.
|
I. – III. 2015.
|
IV. – VI. 2015.
|
VII. – IX. 2015.
|
X. –XII. 2015.
|
|
|
|
|
|
|
|
|
|
|
|
|
|
|
|
|
|
|
|
|
Ukupno1)
|
1 552
|
1 543
|
1 602
|
1 629
|
1 584
|
841
|
831
|
859
|
881
|
860
|
711
|
712
|
743
|
749
|
724
|
Total1)
|
|
|
|
|
|
|
|
|
|
|
|
|
|
|
|
|
|
|
|
Poljoprivreda,
šumarstvo i ribarstvo
|
145
|
132
|
157
|
156
|
136
|
91
|
84
|
97
|
100
|
87
|
54
|
49
|
60
|
57
|
49
|
Agriculture,
forestry and fishing
|
|
Rudarstvo i
vađenje
|
((8))
|
((7))
|
((9))
|
((9))
|
.
|
((8))
|
((5))
|
((7))
|
((8))
|
.
|
-
|
.
|
.
|
.
|
.
|
Mining and
quarrying
|
|
Prerađivačka
industrija
|
262
|
266
|
273
|
263
|
262
|
176
|
174
|
175
|
174
|
177
|
86
|
92
|
99
|
89
|
85
|
Manufacturing
|
|
Opskrba
električnom energijom, plinom, parom i klimatizacija
|
((15))
|
((14))
|
((15))
|
((15))
|
((12))
|
((10))
|
((9))
|
((12))
|
((13))
|
((10))
|
((5))
|
.
|
.
|
.
|
-
|
Electricity,
gas, steam and air conditioning supply
|
|
Opskrba
vodom; uklanjanje otpadnih voda, gospodarenje otpadom te djelatnosti
sanacije okoliša
|
(21)
|
(23)
|
(31)
|
(36)
|
(26)
|
((19))
|
((15))
|
(21)
|
(26)
|
((22))
|
.
|
((8))
|
((10))
|
((9))
|
.
|
Water
supply; sewerage, waste management and remediation activities
|
|
Građevinarstvo
|
108
|
106
|
103
|
113
|
116
|
102
|
98
|
96
|
107
|
106
|
((6))
|
((8))
|
((7))
|
((6))
|
((10))
|
Construction
|
|
Trgovina na
veliko i na malo; popravak motornih vozila i motocikla
|
217
|
230
|
221
|
221
|
228
|
95
|
98
|
94
|
92
|
103
|
123
|
132
|
128
|
129
|
126
|
Wholesale
and retail trade; repair of motor vehicles and motorcycles
|
|
Prijevoz i
skladištenje
|
108
|
112
|
103
|
103
|
99
|
83
|
89
|
85
|
82
|
74
|
(24)
|
((23))
|
((18))
|
(21)
|
(25)
|
Transportation
and storage
|
|
Djelatnosti
pružanja smještaja te pripreme i usluživanja hrane
|
89
|
81
|
102
|
125
|
101
|
(35)
|
(33)
|
(44)
|
51
|
(43)
|
54
|
49
|
57
|
74
|
58
|
Accommodation
and food service activities
|
|
Informacije
i komunikacije
|
(45)
|
(38)
|
(45)
|
(50)
|
(37)
|
((25))
|
((23))
|
(30)
|
(28)
|
(23)
|
((20))
|
((15))
|
((15))
|
((21))
|
((13))
|
Information
and communication
|
|
Financijske
djelatnosti i djelatnosti osiguranja
|
(38)
|
(37)
|
(37)
|
(41)
|
(38)
|
((18))
|
((16))
|
((12))
|
((14))
|
((15))
|
((20))
|
((21))
|
(25)
|
(27)
|
(23)
|
Financial
and insurance activities
|
|
Poslovanje
nekretninama
|
((6))
|
((8))
|
((9))
|
.
|
.
|
.
|
((5))
|
.
|
.
|
.
|
.
|
.
|
.
|
.
|
.
|
Real estate
activities
|
|
Stručne,
znanstvene i tehničke djelatnosti
|
55
|
54
|
69
|
66
|
67
|
(21)
|
(23)
|
(33)
|
(39)
|
(35)
|
(34)
|
(31)
|
(36)
|
(27)
|
(32)
|
Professional,
scientific and technical activities
|
|
Administrativne
i pomoćne uslužne djelatnosti
|
(36)
|
(35)
|
(40)
|
(42)
|
(31)
|
((20))
|
((18))
|
((21))
|
((23))
|
((15))
|
((17))
|
((18))
|
((18))
|
((19))
|
((17))
|
Administrative
and support service activities
|
|
Javna uprava
i obrana; obvezno socijalno osiguranje
|
123
|
111
|
108
|
105
|
118
|
63
|
62
|
58
|
56
|
69
|
61
|
49
|
50
|
49
|
50
|
Public
administration and defence; compulsory social security
|
|
Obrazovanje
|
115
|
112
|
122
|
113
|
127
|
(27)
|
(26)
|
(27)
|
(24)
|
(28)
|
88
|
87
|
95
|
89
|
99
|
Education
|
|
Djelatnosti
zdravstvene zaštite i socijalne skrbi
|
105
|
114
|
105
|
95
|
101
|
((23))
|
(22)
|
(21)
|
((18))
|
((18))
|
82
|
92
|
84
|
77
|
83
|
Human health
and social work activities
|
|
Umjetnost,
zabava i rekreacija
|
((20))
|
((23))
|
((21))
|
(27)
|
(27)
|
((11))
|
((13))
|
((10))
|
((10))
|
((13))
|
((9))
|
((9))
|
((11))
|
((17))
|
((14))
|
Arts,
entertainment and recreation
|
|
Ostale
uslužne djelatnosti
|
(30)
|
(33)
|
(28)
|
(37)
|
(45)
|
((10))
|
((13))
|
((11))
|
((10))
|
((12))
|
((20))
|
((19))
|
((17))
|
(27)
|
(32)
|
Other
service activities
|
|
Djelatnosti
kućanstava kao poslodavaca; djelatnosti kućanstava koja proizvode različitu
robu i obavljaju različite usluge za vlastite potrebe
|
.
|
.
|
.
|
.
|
.
|
-
|
-
|
-
|
-
|
.
|
.
|
.
|
.
|
.
|
.
|
Activities
of households as employers; undifferentiated goods – and services –
producing activities of households for own use
|
|
Djelatnosti
izvanteritorijalnih organizacija i tijela
|
.
|
.
|
.
|
-
|
.
|
.
|
-
|
-
|
-
|
-
|
.
|
.
|
.
|
-
|
.
|
Activities
of extra-territorial organisations and bodies
|
1) Zbog
nepouzdanih procjena podataka označenih s ((.)) zbroj podataka nižih razina
ne daje ukupno.
1) Due to unreliable estimates marked by
((.)), data do not add up to the total.
|
|
Ukupno
Total
|
Muškarci
Men
|
Žene
Women
|
|
|
|
X. – XII. 2014.
|
I. – III. 2015.
|
IV. – VI. 2015.
|
VII. – IX. 2015.
|
X. –XII. 2015.
|
X. – XII. 2014.
|
I. – III. 2015.
|
IV. – VI. 2015.
|
VII. – IX. 2015.
|
X. –XII. 2015.
|
X. – XII. 2014.
|
I. – III. 2015.
|
IV. – VI. 2015.
|
VII. – IX. 2015.
|
X. –XII. 2015.
|
|
|
|
|
|
|
|
|
|
|
|
|
|
|
|
|
|
|
|
|
Ukupno1)
|
100,0
|
100,0
|
100,0
|
100,0
|
100,0
|
100,0
|
100,0
|
100,0
|
100,0
|
100,0
|
100,0
|
100,0
|
100,0
|
100,0
|
100,0
|
Total1)
|
|
|
|
|
|
|
|
|
|
|
|
|
|
|
|
|
|
|
|
Poljoprivreda,
šumarstvo i ribarstvo
|
9,3
|
8,6
|
9,8
|
9,6
|
8,6
|
10,8
|
10,1
|
11,3
|
11,3
|
10,2
|
7,6
|
6,8
|
8,1
|
7,6
|
6,8
|
Agriculture,
forestry and fishing
|
|
Rudarstvo i
vađenje
|
((0,5))
|
((0,4))
|
((0,5))
|
((0,6))
|
.
|
((0,9))
|
((0,6))
|
((0,8))
|
((0,9))
|
.
|
-
|
.
|
.
|
.
|
.
|
Mining and
quarrying
|
|
Prerađivačka
industrija
|
16,9
|
17,3
|
17,1
|
16,1
|
16,5
|
21,0
|
21,0
|
20,3
|
19,7
|
20,6
|
12,1
|
12,9
|
13,3
|
11,9
|
11,7
|
Manufacturing
|
|
Opskrba
električnom energijom, plinom, parom i klimatizacija
|
((1,0))
|
((0,9))
|
((0,9))
|
((0,9))
|
((0,8))
|
((1,2))
|
((1,1))
|
((1,3))
|
((1,5))
|
((1,2))
|
((0,7))
|
.
|
.
|
.
|
.
|
Electricity,
gas, steam and air conditioning supply
|
|
Opskrba
vodom; uklanjanje otpadnih voda, gospodarenje otpadom te djelatnosti
sanacije okoliša
|
(1,4)
|
(1,5)
|
(1,9)
|
(2,2)
|
(1,6)
|
((2,2))
|
((1,8))
|
(2,5)
|
(3,0)
|
((2,5))
|
.
|
((1,1))
|
((1,3))
|
((1,2))
|
.
|
Water
supply; sewerage, waste management and remediation activities
|
|
Građevinarstvo
|
7,0
|
6,9
|
6,4
|
6,9
|
7,3
|
12,1
|
11,9
|
11,1
|
12,1
|
12,3
|
((0,9))
|
((1,1))
|
((1,0))
|
((0,8))
|
((1,4))
|
Construction
|
|
Trgovina na
veliko i na malo; popravak motornih vozila i motocikla
|
14,0
|
14,9
|
13,8
|
13,6
|
14,4
|
11,3
|
11,8
|
10,9
|
10,5
|
11,9
|
17,3
|
18,5
|
17,2
|
17,2
|
17,3
|
Wholesale
and retail trade; repair of motor vehicles and motorcycles
|
|
Prijevoz i
skladištenje
|
6,9
|
7,3
|
6,4
|
6,3
|
6,2
|
9,9
|
10,8
|
9,9
|
9,3
|
8,6
|
(3,4)
|
((3,2))
|
((2,4))
|
(2,8)
|
(3,4)
|
Transportation
and storage
|
|
Djelatnosti
pružanja smještaja te pripreme i usluživanja hrane
|
5,7
|
5,3
|
6,4
|
7,7
|
6,4
|
(4,1)
|
(3,9)
|
(5,2)
|
5,8
|
(5,0)
|
7,6
|
6,8
|
7,7
|
9,9
|
8,0
|
Accommodation
and food service activities
|
|
Informacije
i komunikacije
|
(2,9)
|
(2,5)
|
(2,8)
|
(3,0)
|
(2,3)
|
((3,0))
|
((2,8))
|
(3,5)
|
(3,2)
|
(2,7)
|
((2,8))
|
((2,1))
|
((2,1))
|
((2,8))
|
((1,8))
|
Information
and communication
|
|
Financijske
djelatnosti i djelatnosti osiguranja
|
(2,4)
|
(2,4)
|
(2,3)
|
(2,5)
|
(2,4)
|
((2,1))
|
((1,9))
|
((1,4))
|
((1,6))
|
((1,7))
|
((2,8))
|
((3,0))
|
(3,3)
|
(3,6)
|
(3,2)
|
Financial
and insurance activities
|
|
Poslovanje
nekretninama
|
((0,4))
|
((0,5))
|
((0,5))
|
.
|
.
|
.
|
((0,6))
|
.
|
.
|
.
|
.
|
.
|
.
|
.
|
.
|
Real estate
activities
|
|
Stručne,
znanstvene i tehničke djelatnosti
|
3,5
|
3,5
|
4,3
|
4,0
|
4,2
|
(2,5)
|
(2,8)
|
(3,8)
|
(4,4)
|
(4,0)
|
(4,7)
|
(4,3)
|
(4,9)
|
(3,6)
|
(4,4)
|
Professional,
scientific and technical activities
|
|
Administrativne
i pomoćne uslužne djelatnosti
|
(2,3)
|
(2,3)
|
(2,5)
|
(2,6)
|
(2,0)
|
((2,3))
|
((2,1))
|
((2,5))
|
((2,6))
|
((1,7))
|
((2,3))
|
((2,5))
|
((2,4))
|
((2,5))
|
((2,3))
|
Administrative
and support service activities
|
|
Javna uprava
i obrana; obvezno socijalno osiguranje
|
8,0
|
7,2
|
6,8
|
6,4
|
7,5
|
7,5
|
7,5
|
6,8
|
6,3
|
8,0
|
8,5
|
6,8
|
6,7
|
6,6
|
6,9
|
Public
administration and defence; compulsory social security
|
|
Obrazovanje
|
7,4
|
7,3
|
7,6
|
7,0
|
8,0
|
(3,2)
|
(3,1)
|
(3,1)
|
(2,8)
|
(3,3)
|
12,4
|
12,2
|
12,8
|
11,9
|
13,7
|
Education
|
|
Djelatnosti
zdravstvene zaštite i socijalne skrbi
|
6,8
|
7,4
|
6,6
|
5,9
|
6,4
|
((2,7))
|
(2,7)
|
(2,4)
|
((2,1))
|
((2,0))
|
11,6
|
12,9
|
11,3
|
10,3
|
11,5
|
Human health
and social work activities
|
|
Umjetnost,
zabava i rekreacija
|
((1,3))
|
((1,5))
|
((1,3))
|
(1,6)
|
(1,7)
|
((1,3))
|
((1,6))
|
((1,1))
|
((1,1))
|
((1,5))
|
((1,3))
|
((1,3))
|
((1,5))
|
((2,2))
|
((1,9))
|
Arts,
entertainment and recreation
|
|
Ostale
uslužne djelatnosti
|
(1,9)
|
(2,1)
|
(1,8)
|
(2,3)
|
(2,8)
|
((1,1))
|
((1,6))
|
((1,3))
|
((1,2))
|
((1,4))
|
((2,9))
|
((2,7))
|
((2,3))
|
(3,6)
|
(4,5)
|
Other
service activities
|
|
Djelatnosti
kućanstava kao poslodavaca; djelatnosti kućanstava koja proizvode različitu
robu i obavljaju različite usluge za vlastite potrebe
|
.
|
.
|
.
|
.
|
.
|
-
|
-
|
-
|
-
|
-
|
.
|
.
|
.
|
.
|
.
|
Activities
of households as employers; undifferentiated goods – and services –
producing activities of households for own use
|
|
Djelatnosti
izvanteritorijalnih organizacija i tijela
|
.
|
.
|
.
|
-
|
.
|
.
|
-
|
-
|
-
|
-
|
.
|
.
|
.
|
-
|
.
|
Activities
of extra-territorial organisations and bodies
|
1) Zbog
nepouzdanih procjena podataka označenih s ((.)) zbroj podataka nižih razina
ne daje ukupno.
1) Due to unreliable estimates marked by
((.)), data do not add up to the total.
PERSONS IN
EMPLOYMENT, ACCORDING TO NKZ 10. MAJOR GROUPS OF OCCUPATIONS AND BY SEX
tis.
'000
|
|
Ukupno
Total
|
Muškarci
Men
|
Žene
Women
|
|
|
|
X. – XII. 2014.
|
I. – III. 2015.
|
IV. – VI. 2015.
|
VII. – IX. 2015.
|
X. –XII. 2015.
|
X. – XII. 2014.
|
I. – III. 2015.
|
IV. – VI. 2015.
|
VII. – IX. 2015.
|
X. –XII. 2015.
|
X. – XII. 2014.
|
I. – III. 2015.
|
IV. – VI. 2015.
|
VII. – IX. 2015.
|
X. –XII. 2015.
|
|
|
|
|
|
|
|
|
|
|
|
|
|
|
|
|
|
|
|
|
Ukupno1)
|
1 552
|
1 543
|
1 602
|
1 629
|
1 584
|
841
|
831
|
859
|
881
|
860
|
711
|
712
|
743
|
749
|
724
|
Total1)
|
|
|
|
|
|
|
|
|
|
|
|
|
|
|
|
|
|
|
|
Zakonodavci/zakonodavke,
dužnosnici/dužnosnice i direktori/direktorice
|
71
|
78
|
74
|
68
|
64
|
54
|
58
|
55
|
(50)
|
(47)
|
((17))
|
((19))
|
((19))
|
((18))
|
((17))
|
Managers
|
|
Znanstvenici/znanstvenice,
inženjeri/inženjerke i stručnjaci/stručnjakinje
|
255
|
262
|
279
|
262
|
264
|
95
|
88
|
103
|
102
|
92
|
160
|
173
|
176
|
160
|
172
|
Professionals
|
|
Tehničari/tehničarke
i stručni suradnici/stručne suradnice
|
222
|
220
|
229
|
232
|
230
|
116
|
118
|
125
|
132
|
126
|
106
|
101
|
104
|
101
|
103
|
Technicians
and associate professionals
|
|
Administrativni
službenici/administrativne službenice
|
156
|
156
|
150
|
145
|
142
|
(55)
|
64
|
50
|
(40)
|
(48)
|
101
|
92
|
100
|
105
|
94
|
Clerical
support workers
|
|
Uslužna i
trgovačka zanimanja
|
273
|
279
|
280
|
305
|
302
|
103
|
95
|
99
|
116
|
116
|
170
|
184
|
181
|
188
|
187
|
Service and
sales workers
|
|
Poljoprivrednici/poljoprivrednice,
šumari/šumarke i ribari/ribarke, lovci/lovkinje
|
115
|
110
|
117
|
112
|
104
|
70
|
66
|
67
|
65
|
61
|
45
|
44
|
50
|
47
|
43
|
Skilled
agricultural, forestry and fishery workers
|
|
Zanimanja u
obrtu i pojedinačnoj proizvodnji
|
187
|
189
|
195
|
190
|
182
|
172
|
175
|
179
|
174
|
170
|
((14))
|
((14))
|
((16))
|
((17))
|
((12))
|
Craft and
related trades workers
|
|
Rukovatelji/rukovateljice
postrojenjima i strojevima, industrijski proizvođači/industrijske
proizvođačice i sastavljači/sastavljačice strojeva
|
156
|
137
|
144
|
170
|
164
|
116
|
104
|
109
|
127
|
125
|
(40)
|
(33)
|
(35)
|
(44)
|
(39)
|
Plant and
machine operators and assemblers
|
|
Jednostavna
zanimanja
|
94
|
94
|
114
|
128
|
117
|
(38)
|
44
|
54
|
61
|
60
|
55
|
50
|
60
|
67
|
56
|
Elementary
occupations
|
|
Vojna
zanimanja
|
((20))
|
((16))
|
((15))
|
((13))
|
((14))
|
((18))
|
((16))
|
((14))
|
((13))
|
((14))
|
.
|
.
|
.
|
.
|
-
|
Armed forces
occupations
|
|
Nepoznato
|
.
|
.
|
.
|
.
|
.
|
.
|
.
|
.
|
.
|
.
|
.
|
-
|
.
|
.
|
.
|
Other
|
|
|
|
|
|
|
|
|
|
|
|
|
|
|
|
|
|
|
|
|
|
|
|
|
|
|
|
%
|
|
|
|
|
|
|
|
|
|
|
|
|
|
|
|
|
|
|
|
|
|
|
|
|
|
|
|
Ukupno1)
|
100,0
|
100,0
|
100,0
|
100,0
|
100,0
|
100,0
|
100,0
|
100,0
|
100,0
|
100,0
|
100,0
|
100,0
|
100,0
|
100,0
|
100,0
|
Total1)
|
|
|
|
|
|
|
|
|
|
|
|
|
|
|
|
|
|
|
|
Zakonodavci/zakonodavke,
dužnosnici/dužnosnice i direktori/direktorice
|
4,6
|
5,0
|
4,6
|
4,2
|
4,0
|
6,5
|
7,0
|
6,4
|
(5,6)
|
(5,4)
|
((2,4))
|
((2,7))
|
((2,6))
|
((2,5))
|
((2,4))
|
Managers
|
|
Znanstvenici/znanstvenice,
inženjeri/inženjerke i stručnjaci/stručnjakinje
|
16,4
|
16,9
|
17,4
|
16,1
|
16,7
|
11,3
|
10,6
|
12,0
|
11,5
|
10,7
|
22,5
|
24,3
|
23,7
|
21,4
|
23,8
|
Professionals
|
|
Tehničari/tehničarke
i stručni suradnici/stručne suradnice
|
14,3
|
14,2
|
14,3
|
14,3
|
14,5
|
13,8
|
14,2
|
14,6
|
15,0
|
14,7
|
14,9
|
14,2
|
13,9
|
13,4
|
14,3
|
Technicians
and associate professionals
|
|
Administrativni
službenici/administrativne službenice
|
10,1
|
10,1
|
9,4
|
8,9
|
9,0
|
(6,5)
|
7,6
|
5,9
|
(4,5)
|
(5,6)
|
14,3
|
13,0
|
13,5
|
14,1
|
13,0
|
Clerical
support workers
|
|
Uslužna i
trgovačka zanimanja
|
17,6
|
18,1
|
17,5
|
18,7
|
19,1
|
12,2
|
11,4
|
11,5
|
13,2
|
13,5
|
24,0
|
25,9
|
24,4
|
25,2
|
25,8
|
Service and
sales workers
|
|
Poljoprivrednici/poljoprivrednice,
šumari/šumarke i ribari/ribarke, lovci/lovkinje
|
7,4
|
7,1
|
7,3
|
6,9
|
6,5
|
8,3
|
7,9
|
7,8
|
7,4
|
7,1
|
6,4
|
6,2
|
6,7
|
6,3
|
5,9
|
Skilled
agricultural, forestry and fishery workers
|
|
Zanimanja u
obrtu i pojedinačnoj proizvodnji
|
12,0
|
12,2
|
12,2
|
11,7
|
11,5
|
20,5
|
21,1
|
20,9
|
19,7
|
19,8
|
((2,0))
|
((1,9))
|
((2,1))
|
((2,2))
|
((1,7))
|
Craft and
related trades workers
|
|
Rukovatelji/rukovateljice
postrojenjima i strojevima, industrijski proizvođači/industrijske
proizvođačice i sastavljači/sastavljačice strojeva
|
10,1
|
8,9
|
9,0
|
10,5
|
10,4
|
13,8
|
12,5
|
12,7
|
14,4
|
14,5
|
(5,6)
|
(4,7)
|
(4,7)
|
(5,8)
|
(5,4)
|
Plant and
machine operators and assemblers
|
|
Jednostavna
zanimanja
|
6,1
|
6,1
|
7,1
|
7,8
|
7,4
|
(4,6)
|
5,3
|
6,3
|
6,9
|
7,0
|
7,8
|
7,0
|
8,1
|
8,9
|
7,8
|
Elementary
occupations
|
|
Vojna zanimanja
|
((1,3))
|
((1,1))
|
((0,9))
|
((0,8))
|
((0,9))
|
((2,2))
|
((1,9))
|
((1,7))
|
((1,5))
|
((1,6))
|
.
|
.
|
.
|
.
|
.
|
Armed forces
occupations
|
|
Nepoznato
|
.
|
.
|
.
|
.
|
.
|
.
|
.
|
.
|
.
|
.
|
.
|
.
|
.
|
.
|
.
|
Other
|
1) Zbog
nepouzdanih procjena podataka označenih s ((.)) zbroj podataka nižih razina
ne daje ukupno.
1) Due to unreliable estimates marked by
((.)), data do not add up to the total.
10. ZAPOSLENE OSOBE PREMA SEKTORIMA DJELATNOSTI
NKD-a 2007. PREMA NKPJS-u – 2.
RAZINA I U REPUBLICI HRVATSKOJ
U
ČETVRTOM TROMJESEČJU 2015.
PERSONS
IN EMPLOYMENT, ACCORDING TO NKD 2007. ACTIVITY SECTORS, AT NUTS 2nd
LEVEL AND IN REPUBLIC OF CROATIA,
FOURTH
QUARTER OF 2015
|
|
Republika
Hrvatska
Republic
of Croatia – total
|
Kontinentalna
Hrvatska
Continental
Croatia
|
Jadranska
Hrvatska
Adriatic
Croatia
|
|
|
|
|
|
|
|
|
|
|
tis.
’000
|
|
|
|
|
|
|
|
|
|
Ukupno1)
|
1 584
|
1 075
|
509
|
Total1)
|
|
|
|
|
|
|
|
Poljoprivredne djelatnosti
|
136
|
116
|
(20)
|
Agriculture
|
|
Nepoljoprivredne djelatnosti
|
421
|
302
|
119
|
Industry
|
|
Uslužne djelatnosti
|
1 024
|
656
|
368
|
Services
|
|
|
|
|
|
|
|
|
|
|
|
|
|
|
|
%
|
|
|
|
|
|
|
|
|
|
Ukupno1)
|
100,0
|
100,0
|
100,0
|
Total1)
|
|
|
|
|
|
|
|
Poljoprivredne djelatnosti
|
8,6
|
10,8
|
(3,9)
|
Agriculture
|
|
Nepoljoprivredne djelatnosti
|
26,6
|
28,0
|
23,5
|
Industry
|
|
Uslužne djelatnosti
|
64,7
|
61,0
|
72,4
|
Services
|
1) Zbog
neodgovora anketiranih osoba, zbroj podataka nižih razina ne daje ukupno.
1) Due to the
non-response of interviewed persons, data do not add up to the total.
11. NEZAPOSLENI PREMA
DULJINI TRAŽENJA POSLA
UNEMPLOYED PERSONS, BY DURATION OF JOB SEARCH
|
|
Ukupno, tis.
Total, '000
|
Ukupno, %
Total, %
|
|
|
|
X. – XII.
2014.
|
I. – III.
2015.
|
IV. – VI.
2015.
|
VII. – IX. 2015
|
X. –XII.
2015
|
X. – XII.
2014.
|
I. – III.
2015.
|
IV. – VI.
2015.
|
VII. – IX. 2015
|
X. –XII.
2015
|
|
|
|
|
|
|
|
|
|
|
|
|
|
|
|
Ukupno
|
347
|
340
|
295
|
297
|
304
|
100,0
|
100,0
|
100,0
|
100,0
|
100,0
|
Total
|
|
|
|
|
|
|
|
|
|
|
|
|
|
|
Našli posao1)
|
.
|
.
|
-
|
-
|
-
|
.
|
.
|
-
|
-
|
-
|
Unemployed
persons who found job1)
|
|
Kraće od 1
mjeseca
|
((8))
|
((8))
|
((10))
|
((14))
|
((14))
|
((2,4))
|
((2,2))
|
((3,5))
|
((4,8))
|
((4,6))
|
Less than 1
month
|
|
1 – 5
mjeseci
|
86
|
73
|
(35)
|
47
|
73
|
24,9
|
21,5
|
(12,0)
|
15,7
|
24,1
|
1 – 5 months
|
|
6 – 11
mjeseci
|
(35)
|
53
|
60
|
(32)
|
(25)
|
(10,1)
|
15,7
|
20,5
|
(10,8)
|
(8,2)
|
6 – 11 months
|
|
12 – 23
mjeseca
|
68
|
71
|
63
|
70
|
58
|
19,6
|
21,0
|
21,3
|
23,4
|
19,1
|
12 – 23 months
|
|
24 i više
mjeseci
|
145
|
135
|
126
|
134
|
134
|
41,7
|
39,6
|
42,7
|
45,3
|
44,0
|
24 months
and over
|
1) Prema međunarodnoj metodologiji i osobe koje su našle posao, a
nisu počele raditi u vrijeme provođenja Ankete, smatraju se nezaposlenima.
1) According to the
international methodology, persons who, at the time of the Survey, have found
a job to start later are also considered unemployed persons.
12. REGISTRIRANI
NEZAPOSLENI KOJI PREMA ANKETI NISU NEZAPOSLENI
|
|
Ukupno, tis.
Total, '000
|
Ukupno, %
Total, %
|
|
|
|
X. – XII.
2014.
|
I. – III.
2015.
|
IV. – VI.
2015.
|
VII. – IX. 2015
|
X. –XII. 2015
|
X. – XII.
2014.
|
I. – III.
2015.
|
IV. – VI.
2015.
|
VII. – IX. 2015
|
X. –XII. 2015
|
|
|
|
|
|
|
|
|
|
|
|
|
|
|
|
Nezaposleni prema Anketi
|
347
|
340
|
295
|
297
|
304
|
100,0
|
100,0
|
100,0
|
100,0
|
100,0
|
ILO
unemployed persons
|
|
Registrirani
u HZZ-u
|
292
|
279
|
243
|
254
|
254
|
84,1
|
81,9
|
82,6
|
85,4
|
83,7
|
Registered
with CES
|
|
Neregistrirani
u HZZ-u
|
55
|
61
|
52
|
43
|
50
|
15,9
|
18,1
|
17,4
|
14,6
|
16,3
|
Not
registered with CES
|
|
|
|
|
|
|
|
|
|
|
|
|
|
|
Registrirani nezaposleni
|
312
|
326
|
278
|
258
|
282
|
100,0
|
100,0
|
100,0
|
100,0
|
100,0
|
Registered
unemployed persons
|
|
Koji prema
Anketi nisu nezaposleni
|
20
|
47
|
35
|
4
|
28
|
6,3
|
14,5
|
12,3
|
1,6
|
9,8
|
Not ILO unemployed
|
13. RADNO SPOSOBNO STANOVNIŠTVO PREMA STATUSU U
AKTIVNOSTI U ČETVRTOM TROMJESEČJU 2015. U ODNOSU NA TREĆE
TROMJESEČJE 2015.
WORKING-AGE
POPULATION, BY STATUS IN ACTIVITY, FOURTH QUARTER OF 2015 COMPARED TO THIRD
QUARTER OF 2015
%
|
Status u
III. tromjesečju 2015.
|
Status u IV
tromjesečju 2015.
Status
in 2015/Q4
|
Status
in 2015/Q3
|
|
zaposleni
Persons
in employment
|
nezaposleni
Unemployed
persons
|
neaktivni
Inactive
population
|
|
|
|
|
|
|
|
|
|
Ukupno
Total
|
|
|
|
|
|
|
|
|
|
Ukupno
|
100,0
|
100,0
|
100,0
|
Total
|
|
|
|
|
|
|
|
Zaposleni
|
98,0
|
11,1
|
2,0
|
Persons in employment
|
|
Nezaposleni
|
1,6
|
83,4
|
0,4
|
Unemployed persons
|
|
Neaktivni
|
0,4
|
5,5
|
97,6
|
Inactive population
|
|
|
|
|
|
|
|
|
|
Muškarci
Men
|
|
|
|
|
|
|
|
|
|
Ukupno
|
100,0
|
100,0
|
100,0
|
Total
|
|
|
|
|
|
|
|
Zaposleni
|
98,0
|
5,6
|
2,6
|
Persons in employment
|
|
Nezaposleni
|
1,6
|
88,8
|
0,4
|
Unemployed persons
|
|
Neaktivni
|
0,4
|
5,6
|
97,0
|
Inactive population
|
|
|
|
|
|
|
|
|
|
Žene
Women
|
|
|
|
|
|
|
|
|
|
Ukupno
|
100,0
|
100,0
|
100,0
|
Total
|
|
|
|
|
|
|
|
Zaposleni
|
97,9
|
16,4
|
1,6
|
Persons in employment
|
|
Nezaposleni
|
1,7
|
78,2
|
0,4
|
Unemployed persons
|
|
Neaktivni
|
0,4
|
5,4
|
98,0
|
Inactive population
|
|
Višekratno
anketiranje dijela uzorka kućanstava omogućuje praćenje tijekova osoba na
tržištu rada na godišnjoj i tromjesečnoj razini. Pritom se primarno obraća
pozornost na promatranje kretanja (tijekova) stanovništva u glavnim
kategorijama ekonomske aktivnosti – zaposlenosti, nezaposlenosti i neaktivnosti.
|
|
Multiple
interviewing of a part of the sampled households has enabled the monitoring
of the flows of persons on the labour market at an annual and quarterly
level. In this matter, the main focus is on the monitoring of the movements
(flows) of the population within the main categories of economic activity –
employment, unemployment and inactivity.
|
|
|
|
|
|
U ovoj
tablici objavljuju se podaci o radno sposobnim osobama koje su anketirane u
četvrtom i trećem tromjesečju 2015. U četvrtom tromjesečju 2015. od ukupnog
broja zaposlenih osoba 98,0% bilo je zaposleno i u prethodnom tromjesečju,
1,6% nezaposleno, a 0,4% neaktivno. U četvrtom tromjesečju 2015. 83,4%
nezaposlenih osoba bilo je nezaposleno i u prethodnom tromjesečju, 11,1%
zaposleno, a 5,5% neaktivno. Od ukupnog broja neaktivnih osoba 97,6% bilo
je neaktivno i u trećem tromjesečju 2015., zaposleno 2,0%, a nezaposleno
0,4%.
|
|
This
table presents data on the working-age persons interviewed in the fourth
and third quarter of 2015. Regarding the total number of persons who were
employed in the fourth quarter of 2015, there were 98.0% of them who had
been employed in the previous quarter as well, 1.6% had been unemployed and
0.4% had been inactive. Regarding unemployed persons, there were 83.4% of
them in the fourth quarter of 2015 who had been unemployed in the previous
quarter as well, 11.1% who had been employed and 5.5% who had been
classified as inactive. Regarding inactive persons, 97.6% had been inactive
in the third quarter of 2015 as well, 2.0% had been employed and 0.4% had
been unemployed.
|
|
|
|
|
|
U izračun su
uključene osobe koje su sudjelovale u Anketi u oba tromjesečja. Postoci su
izračunani iz neuteženih podataka.
|
|
Only
persons who took part in the survey in both quarters are included in the
calculation. Percentages are calculated from unweighted data.
|
14. RADNO SPOSOBNO STANOVNIŠTVO PREMA STATUSU U
AKTIVNOSTI U ČETVRTOM TROMJESEČJU 2015. U ODNOSU NA ČETVRTO
TROMJESEČJE 2014.
WORKING-AGE
POPULATION, BY STATUS IN ACTIVITY, FOURTH QUARTER OF 2015 COMPARED TO FOURTH
QUARTER OF 2014
%
|
Status u
IV. tromjesečju 2014.
|
Status u
IV. tromjesečju 2015.
Status
in 2015/Q4
|
Status
in 2014/Q4
|
|
zaposleni
Persons
in employment
|
nezaposleni
Unemployed
persons
|
Neaktivni
Inactive
population
|
|
|
|
|
|
|
|
|
|
Ukupno
Total
|
|
|
|
|
|
|
|
|
|
Ukupno
|
100,0
|
100,0
|
100,0
|
Total
|
|
|
|
|
|
|
|
Zaposleni
|
92,4
|
10,6
|
2,2
|
Persons in employment
|
|
Nezaposleni
|
4,4
|
74,8
|
1,5
|
Unemployed persons
|
|
Neaktivni
|
3,2
|
14,6
|
96,3
|
Inactive population
|
|
|
|
|
|
|
|
|
|
Muškarci
Men
|
|
|
|
|
|
|
|
|
|
Ukupno
|
100,0
|
100,0
|
100,0
|
Total
|
|
|
|
|
|
|
|
Zaposleni
|
92,5
|
10,6
|
2,3
|
Persons in employment
|
|
Nezaposleni
|
5,0
|
76,5
|
1,8
|
Unemployed persons
|
|
Neaktivni
|
2,5
|
12,9
|
95,9
|
Inactive population
|
|
|
|
|
|
|
|
|
|
Žene
Women
|
|
|
|
|
|
|
|
|
|
Ukupno
|
100,0
|
100,0
|
100,0
|
Total
|
|
|
|
|
|
|
|
Zaposleni
|
92,2
|
10,7
|
2,1
|
Persons in employment
|
|
Nezaposleni
|
3,6
|
73,0
|
1,3
|
Unemployed persons
|
|
Neaktivni
|
4,2
|
16,3
|
96,6
|
Inactive population
|
|
U ovoj
tablici objavljuju se podaci o radno sposobnim osobama koje su anketirane u
četvrtom tromjesečju 2014. i četvrtom tromjesečju 2015. U četvrtom
tromjesečju 2015. od ukupnog broja zaposlenih osoba, 92,4% bilo je
zaposleno i u četvrtom tromjesečju 2014., nezaposleno 4,4%, a neaktivno
3,2%. U četvrtom tromjesečju 2015. 74,8% nezaposlenih osoba bilo je
nezaposleno i u četvrtom tromjesečju 2014., zaposleno 10,6%, a neaktivno
14,6%. Od ukupnog broja neaktivnih osoba 96,3% bilo je neaktivno i u
četvrtom tromjesečju 2014., zaposleno 2,2%, a nezaposleno 1,5%.
|
|
This
table presents data on the working-age persons interviewed in the fourth
quarter of 2014 and the fourth quarter of 2015. Regarding the total number
of persons who were employed in the fourth quarter of 2015, there were
92.4% of them who had been employed in the fourth quarter of 2014 as well,
4.4% had been unemployed and 3.2% had been inactive. Regarding unemployed
persons, there were 74.8% of them in the fourth quarter of 2015 who had
been unemployed in the fourth quarter of 2014 as well, 10.6% who had been
employed and 14.6% who had been classified as inactive. Regarding inactive
persons, 96.3% had been inactive in the fourth quarter of 2014 as well, 2.2%
had been employed and 1.5% had been unemployed.
|
15. USPOREDBA ANKETNIH I ADMINISTRATIVNIH PODATAKA
O NEZAPOSLENOSTI PREMA SPOLU
COMPARISON BETWEEN REGISTERED AND ILO UNEMPLOYMENT, BY SEX
|
|
Ukupno
Total
|
Muškarci
Men
|
Žene
Women
|
|
|
X. – XII. 2014.
|
I. – III. 2015.
|
IV. – VI. 2015.
|
VII. – IX. 2015.
|
X. – XII. 2015.
|
X. – XII. 2014.
|
I. – III. 2015.
|
IV. – VI. 2015.
|
VII. – IX. 2015.
|
X. – XII. 2015.
|
X. – XII. 2014.
|
I. – III. 2015.
|
IV. – VI. 2015.
|
VII. – IX. 2015.
|
X. – XII. 2015.
|
|
|
|
|
|
|
|
|
|
|
|
|
|
|
|
|
|
|
|
Nezaposlene osobe
registrirane u HZZ-u, tis.
|
312
|
326
|
278
|
258
|
282
|
143
|
152
|
128
|
117
|
127
|
169
|
174
|
150
|
141
|
155
|
Unemployed
persons registered with CES,'000
|
|
Nezaposleni prema
Anketi, tis.
|
347
|
340
|
295
|
297
|
304
|
186
|
183
|
157
|
148
|
150
|
161
|
157
|
138
|
150
|
154
|
ILO
unemployed persons, '000
|
|
Stopa anketne
nezaposlenosti, %
|
18,3
|
18,1
|
15,5
|
15,4
|
16,1
|
18,1
|
18,1
|
15,4
|
14,4
|
14,8
|
18,5
|
18,1
|
15,7
|
16,7
|
17,6
|
ILO
unemployment rate, %
|
|
Stopa registrirane
nezaposlenosti,%
|
19,0
|
20,11)
|
17,21)
|
16,01)
|
17,61)
|
16,7
|
17,91)
|
15,11)
|
13,91)
|
15,21)
|
21,5
|
22,41)
|
19,41)
|
18,31)
|
20,21)
|
Registered
unemployment rate, %
|
1) Stope
su izračunane iz privremenih administrativnih podataka.
1) Rates were calculated from temporary
administrative data.
|
METODOLOŠKA
OBJAŠNJENJA
|
|
NOTES ON METHODOLOGY
|
|
|
|
|
|
|
|
|
|
Prikupljanje
podataka
|
|
Data
collection
|
|
|
|
|
|
Anketa
o radnoj snazi prvi je put u Republici Hrvatskoj bila provedena u studenome
1996. kao godišnje istraživanje. Na isti način bila je provedena u lipnju
1997. U skladu s potrebama za učestalijim podacima i prema iskustvima
europskih zemalja te preporukama međunarodnih institucija od 1998. do 2006.
provodila se anketiranjem dijela kućanstava iz uzorka svakog mjeseca.
Rezultati se obrađuju i objavljuju u polugodišnjoj dinamici. Tijekom 2006.
Državni zavod za statistiku osigurao je preduvjete za unapređenje Ankete o
radnoj snazi u metodološkome i provedbenom smislu radi dobivanja
preciznijih rezultata i potpunog usklađivanja s pravnom stečevinom
Zajednice. Stoga se od 2007. Anketa provodi kontinuirano, odnosno kućanstva
se anketiraju neprekidno tijekom cijele godine. To znači da je svaki tjedan
referentni i anketni, odnosno provedbeni. Prikupljeni podaci kontinuirano
se dostavljaju Državnom zavodu za statistiku, koji obrađuje i objavljuje
rezultate u tromjesečnoj dinamici od početka 2007.
|
|
In
the Republic of Croatia, the Labour Force Survey was for the first time
carried out in November 1996 as an annual survey. It was carried out in the
same manner in June 1997. In order to fulfil the need for more frequent
data collection than just once a year, and following the example of
European countries and recommendations of international institutions, the
Labour Force Survey has been carried out by interviewing a part of sampled
households every month. Data are processed and published for each half-year
period. In 2006, the Croatian Bureau of Statistics set preconditions for
improving the Labour Force Survey in its methodology and organisation,
aiming at obtaining more precise results and achieving the complete
harmonisation with the Acquis Communaitaire. Therefore, starting from 2007,
the Labour Force Survey has been carried out continuously, that is,
households are interviewed throughout the year. This means that every week
is both a reference and an interviewing week. Collected data are
continuously delivered to the Croatian Bureau of Statistics, which has
processed and published results in quarterly dynamics since the beginning
of 2007.
|
|
|
|
|
|
U
skladu s tim anketari obilaze kućanstva svaki tjedan i na izabranim
adresama obavljaju anketni intervju koji u prosjeku traje dvadesetak
minuta. Na temelju Zakona o službenoj statistici (NN, br. 103/03., 75/09. i
59/12.) zajamčena je tajnost svih podataka koje ispitanici daju o sebi i o
članovima svoga kućanstva. Prikupljeni podaci upotrebljavaju se isključivo
za statističke svrhe.
|
|
Accordingly,
interviewers visit sampled addresses every week and conduct interviews on
private households living at these addresses. The interview lasts
approximately 20 minutes. On the basis of the Act on Official Statistics
(NN, Nos 103/03, 75/09 and 59/12), all information given by interviewed
persons are confidential. The data collected are used for statistical
purposes only.
|
|
|
|
|
|
Na
terenu radi oko 80 anketara čiji rad organizira i kontrolira 22 kontrolora.
Ispunjene upitnike preuzete od anketara kontrolori provjeravaju prije
dostave Državnom zavodu za statistiku i uočene pogreške ispravljaju u
suradnji s anketarima.
|
|
Field
work is carried out by approximately 80 interviewers. Their work is
organised and monitored by 22 field supervisors. Supervisors control the
filled in questionnaires submitted by interviewers and, in cooperation with
interviewers, correct detected errors before sending them to the Croatian
Bureau of Statistics.
|
|
|
|
|
|
|
|
|
|
Temeljna
načela i definicije
|
|
Basic
concepts and definitions
|
|
|
|
|
|
Anketa
o radnoj snazi mjeri ekonomsku aktivnost stanovništva u kratkom razdoblju
promatranja od tjedan dana. Referentni tjedan za anketu koja se u Republici
Hrvatskoj provodi od početka 2007. svaki je tjedan tijekom cijele godine.
|
|
The
Labour Force Survey measures the economic activity of the population in a
short survey period of one week. The reference week for the Survey, which
has been carried out in the Republic of Croatia since the beginning of
2007, is every week throughout the year.
|
|
|
|
|
|
Kućanstvo
je
mala ekonomska zajednica koja nije uvijek, iako najčešće to jest, zajednica
srodnika koji zajedno žive i dijele troškove života (stanovanje,
hrana i drugo).
|
|
A
household is a small economic group of persons that
is usually, although not always, a group of relatives living together and
sharing costs of living (housing, food, etc.).
|
|
|
|
|
|
Radno
sposobno stanovništvo čine osobe starije od navršenih 15
godina.
|
|
Working-age
population is comprised of all persons aged 15
years and over.
|
|
|
|
|
|
Zaposleni
su
osobe koje su u referentnom tjednu obavljale bilo kakav posao za novac ili
plaćanje u naturi. To su svi zaposlenici, samozaposlene osobe i članovi
obitelji koji pomažu u poslovnom subjektu u vlasništvu člana obitelji
(trgovačko društvo, poduzeće, obrt, slobodno zanimanje, poljoprivredno
gospodarstvo) ili u nekome drugom obliku obiteljske privređivačke
djelatnosti i osobe koje su radile za naknadu prema ugovoru, za neposredno
plaćanje u novcu ili naturi. Anketom se, dakle, obuhvaćaju sve osobe koje
su u referentnom tjednu radile barem jedan sat bez obzira na njihov
formalni status i način plaćanja za obavljeni rad. Stoga zaposleni u Anketi
o radnoj snazi može biti umirovljenik, student i kućanica.
|
|
Persons
in employment are those who were engaged in any work
for payment in cash or kind during the reference week. Those are employees,
the self-employed, and family members who are helping in some kind of
family business (family enterprise, firm, craft, free-lance, farm) or some
other kind of gainful activity, as well as persons who worked on contract,
for direct payment in cash or kind. Therefore, the Survey covers all
persons who worked for at least one hour in the reference period,
irrespective of their formal status or means of payment. In this way, a retired
person, a student or a housewife can also be classified as employed.
|
|
|
|
|
|
Zaposleni
su i svi zaposlenici ili samozaposlene osobe koje su u referentnom tjednu
trenutačno bile odsutne s posla, a vratit će se na rad kod istog poslodavca
ili na istu aktivnost nakon što prestane razlog za odsutnost.
|
|
Persons
in employment are also those who were absent from work during the reference
week but had a job to return to with the same employer after the reason for
absence no longer existed.
|
|
|
|
|
|
Zaposlenici su
osobe koje rade za poslodavca u državnome ili privatnom sektoru i za svoj
rad primaju naknadu u novcu ili naturi.
|
|
Persons
in paid employment are those who work for an employer in
the state or private sector and are paid for their work in money or kind.
|
|
|
|
|
|
Samozaposleni
su
poslodavci koji upravljaju poslovnim subjektom i zapošljavaju jednoga ili
više zaposlenika te osobe koje rade za vlastiti račun i ne zapošljavaju
zaposlenike.
|
|
Self-employed
persons are employers who run an enterprise and
employ one or more employees, as well as own-account workers who have no
employees.
|
|
|
|
|
|
Pomažući
članovi jesu osobe koje nisu zaposlenici ili
samozaposleni, a rade u poslovnom subjektu koji je u vlasništvu člana
obitelji i za svoj rad ne primaju naknadu.
|
|
Unpaid
family workers are those who are not in paid employment
or self-employment, but work in an enterprise owned by a family member and
do not receive a payment for their work.
|
|
|
|
|
|
Nezaposleni
su
osobe koje zadovoljavaju sljedeća tri kriterija:
|
|
Unemployed
persons are those who meet the following three
criteria:
|
|
|
|
|
|
a)
|
u referentnom
tjednu nisu obavljale nikakav posao za novac ili plaćanje u naturi
|
|
a)
|
In the
reference period did not work for payment in cash or kind;
|
|
|
|
|
|
|
|
b)
|
u posljednja
četiri tjedna prije anketiranja aktivno su tražile posao
|
|
b)
|
Were
actively seeking work during four weeks prior to the Survey, and
|
|
|
|
|
|
|
|
c)
|
ponuđeni posao
mogle bi početi obavljati u iduća dva tjedna.
|
|
c)
|
Were
currently available for work within the next two weeks.
|
|
|
|
|
|
Toj
skupini pripadaju i osobe koje su našle posao i u skoroj će budućnosti
nastupiti na posao.
|
|
Those
who have found a job to start in the future are also included.
|
|
|
|
|
|
Podzaposleni
su
osobe koje uobičajeno rade manje od 36 sati na tjedan, htjele bi raditi
više nego što uobičajeno rade i bile bi spremne raditi više u iduća dva
tjedna (u okviru sadašnjega glavnog posla, na dodatnom poslu ili novome
glavnom poslu).
|
|
Underemployed
persons are those who usually work less than
36 hours per week but would like to work more and are prepared to accept
more work in the next two weeks (within their present work, with additional
work or with other work).
|
|
|
|
|
|
Trenutačno
aktivno stanovništvo ili radna snaga jesu zaposlene i
nezaposlene osobe razvrstane prema ekonomskoj aktivnosti u referentnom
tjednu.
|
|
Currently
active population or the labour force consists of
persons whose activity status in the reference week is either employed or
unemployed.
|
|
|
|
|
|
Neaktivno
stanovništvo jesu osobe do navršenih 15 godina i osobe u
radno sposobnom stanovništvu koje nisu zaposlene ili nezaposlene.
|
|
Inactive
population consists of persons under the age of 15
as well as those of working age who are neither employed nor unemployed.
|
|
|
|
|
|
Ciljano
stanovništvo koje se prati Anketom određuje se prema prisutnosti
članova u intervjuiranom kućanstvu. Pri određivanju prisutnosti prihvaćeno
je načelo "de facto" stanovništva koje isključuje članove
kućanstva s boravištem na drugoj adresi na kojoj rade ili se školuju dulje
od 12 mjeseci, a ne uključuje privremeno prisutne članove drugoga
kućanstva. Anketom nisu obuhvaćena kolektivna kućanstva kao što su domovi,
samostani i slično.
|
|
Target
population covered by the Survey is determined by
the presence of interviewed household members in the household. The definition
of presence is based on the "de facto" principle, which excludes
household members living at some other address where they work or go to
school for more than 12 months, as well as temporarily present members of
another household. The Survey does not cover collective households such as
student homes, convents, etc.
|
|
|
|
|
|
Stopa
aktivnosti jest postotni udio aktivnog stanovništva (radne
snage) u radno sposobnom stanovništvu.
|
|
Activity
rate represents the labour force as a percentage of the
working-age population.
|
|
|
|
|
|
Stopa
zaposlenosti jest postotni udio zaposlenih u radno sposobnom
stanovništvu.
|
|
Employment
rate represents persons in employment as a percentage of
working-age population.
|
|
|
|
|
|
Stopa
nezaposlenosti jest postotni udio nezaposlenih u
aktivnom stanovništvu (radnoj snazi).
|
|
Unemployment
rate represents unemployed persons as a percentage of the
labour force.
|
|
|
|
|
|
U pojedinim tablicama može se dogoditi da ukupni
zbroj ne odgovara zbroju pojedinačnih stavki zbog zaokruživanja na tisuće.
|
|
In
certain tables, the sum total may not equal the sum of individual figures
due to the rounding to thousands.
|
|
|
|
|
|
Prema
iskustvu većine razvijenih zemalja, Državni zavod za statistiku od 1996.,
na temelju dosad raspoloživih podataka iz administrativnih izvora i podataka
ovog istraživanja, objavljuje dvije različito određene stope nezaposlenosti
i s njima povezane podatke o aktivnom stanovništvu ili radnoj snazi.
|
|
Since
1996, in accordance with the experience of most developed countries and
based on the data available from administrative sources and the Labour
Force Survey, the Croatian Bureau of Statistics of the Republic of Croatia
has published two differently defined unemployment rates and related data
on active population or labour force.
|
|
|
|
|
|
Državni
zavod za statistiku uz anketne podatke objavljuje i podatke o zaposlenosti
i nezaposlenosti prema administrativnim izvorima u Republici Hrvatskoj.
|
|
Besides
survey data, the Croatian Bureau of Statistics publishes data on employment
and unemployment from administrative sources in the Republic of Croatia.
|
|
|
|
|
|
U
nastavku teksta iznose se metodološka obilježja zbog kojih se međusobno
razlikuju podaci o zaposlenosti.
|
|
The
following text provides methodological characteristics that cause mutual
differences between data on persons in employment:
|
|
|
|
|
|
Izvor i
obuhvat: podaci prema administrativnim izvorima temelje se na
statističkim istraživanjima, mjesečnome i godišnjem istraživanju (obrasci
RAD-1 i RAD-1G) kojima su obuhvaćeni zaposleni u pravnim osobama svih
oblika vlasništva, tijelima državne vlasti i tijelima jedinica lokalne i
područne samouprave na području Republike Hrvatske. Mjesečno istraživanje
obuhvaća 70% zaposlenih iz svakog odjeljka NKD-a 2007. Podaci o zaposlenima
u obrtu i slobodnim zanimanjima te zaposlenim osiguranicima
poljoprivrednicima preuzimaju se iz evidencije aktivnih osiguranika
Hrvatskog zavoda za mirovinsko osiguranje. Rezultati Ankete o radnoj snazi
procjenjuju se na temelju reprezentativnoga statističkog uzorka privatnih
kućanstava u Republici Hrvatskoj.
|
|
Source
and coverage: data from administrative sources are
based on monthly and annual statistical surveys (RAD-1 and RAD-1G forms)
covering persons in employment in legal entities of all types of ownership,
government bodies and bodies of local and regional self
-government units on the territory of the Republic of Croatia. The monthly
survey covers 70% of all persons in employment in each NKD 2007. division.
Data on persons in employment in crafts and trades and free-lances as well
as on employed insured persons – private farmers are taken over from the
records on active pension insurance beneficiaries kept by the Croatian
Institute for Pension Insurance. The Labour Force Survey results are
estimated on the basis of a representative statistical sample of private
households in the Republic of Croatia.
|
|
|
|
|
|
Referentno
razdoblje: administrativni podaci o zaposlenim osobama odnose se
na posljednji dan prethodnog mjeseca, dok se u Anketi prikupljaju podaci za
referentni tjedan.
|
|
Reference
period: administrative data on persons in
employment refer to the last day of the previous month, while the Labour
Force Survey data are related to a reference week.
|
|
|
|
|
|
Razdoblje
promatranja: administrativni podaci obrađuju se i objavljuju u
mjesečnoj dinamici, dok se rezultati Ankete o radnoj snazi odnose na
tromjesečno razdoblje.
|
|
Observation
period: administrative data are processed and
published in monthly dynamics, while the Labour Force Survey results are
related to a quarterly period.
|
|
|
|
|
|
Definicije
zaposlene osobe: administrativni izvori primjenjuju
formalnu definiciju zaposlenosti (zasnivanje radnog odnosa s poslodavcem,
na određeno ili neodređeno vrijeme, neovisno o duljini radnog vremena i
vlasništvu pravne osobe), dok su u Anketi o radnoj snazi kao zaposlene
iskazane sve osobe koje su u referentnom tjednu obavljale bilo kakav posao
za novac ili plaćanje u naturi te osobe koje su u referentnom tjednu bile
trenutačno odsutne s posla, a vratit će se na rad kod istog poslodavca ili
na istu aktivnost nakon prestanka razloga za odsutnost.
|
|
Definition
of persons in employment: administrative
sources apply the formal definition of employment (persons who have signed
the work contract with the employer for a fixed or unspecified period of
time, irrespective of type of ownership and of whether they work full time
or less than full time), while the Labour Force Survey shows persons in
employment as all persons who were, in the reference week, engaged in any
work for payment in cash or kind, as well as those who were absent from
work during the reference week, but had a job to return to with the same
employer after the reason for absence no longer existed.
|
|
|
|
|
|
Objavljivanje
podataka: administrativni podaci o zaposlenim osobama
objavljuju se u mjesečnoj dinamici u Priopćenju Zaposleni po djelatnostima,
u godišnjem priopćenju "Zaposleni prema djelatnostima i spolu –
konačni podaci" te u Mjesečnim statističkim izvješćima Državnog zavoda
za statistiku.
|
|
Publication: administrative data on persons in
employment are published monthly in the First Release titled Persons in
Paid Employment by Activity, annually in the First Release titled Persons
in Employment by Activity and by Sex – Final Data and in the Monthly
Statistical Reports of the Croatian Bureau of Statistics.
|
|
|
|
|
|
Priopćenje
i Statističko izvješće s rezultatima Ankete o radnoj snazi objavljuju
anketne podatke o zaposlenim osobama u tromjesečnoj dinamici. Rezultati
godišnjeg istraživanja RAD-1G objavljuju se i na nižim teritorijalnim
razinama, dok su podaci Ankete raspoloživi prema NKPJS-u 2012. – 2.
razina.
|
|
The
First Release and the Statistical Report containing the Labour Force Survey
results are the publications in which survey results on persons in
employment are published in the quarterly dynamics. The RAD-1G annual
survey data are also published at lower territorial levels, while the
Survey results are available at NUTS 2 level.
|
|
|
|
|
|
Državni
zavod za statistiku objavljuje podatke o nezaposlenim osobama iz
administrativnih izvora i anketne podatke. Ti podaci razlikuju se zbog
metodoloških obilježja koja se iznose u nastavku teksta.
|
|
The Croatian Bureau of Statistics of the
Republic of Croatia publishes data on unemployed persons taken over from
administrative sources as well as those obtained through the Labour Force
Survey. These data differ due to the following methodological
characteristics:
|
|
|
|
|
|
Izvor i
obuhvat: podaci o registriranoj nezaposlenosti dobiveni su iz
Registra nezaposlenih osoba, koji vodi Hrvatski zavod za zapošljavanje, dok
se anketni podaci prikupljaju anketnim intervjuom u privatnim kućanstvima.
Registar sadržava podatke o svim nezaposlenim osobama u Republici
Hrvatskoj, dok se rezultati Ankete o radnoj snazi procjenjuju na temelju
reprezentativnoga statističkog uzorka.
|
|
Source and coverage: data on registered unemployment are
obtained from the Register of Unemployed Persons kept by the Croatian
Employment Service, while the Labour Force Survey results are collected by
interviewing private households. Register contains data on all unemployed persons
in the Republic of Croatia, while the Labour Force Survey results are
estimated on the basis of the representative statistical sample.
|
|
|
|
|
|
Referentno
razdoblje: podaci iz Registra odnose se na posljednji dan
svakog mjeseca, dok se u Anketi prikupljaju podaci za referentni tjedan.
|
|
Reference period: the Register data refer to the last day
of each month, while the Labour Force Survey data are collected for each
reference week.
|
|
|
|
|
|
Razdoblje
promatranja: podaci iz Registra preuzimaju se u mjesečnoj dinamici,
dok se rezultati Ankete o radnoj snazi obrađuju i objavljuju za tromjesečno
razdoblje.
|
|
Observation period: the Register data are taken over in
monthly dynamics, while the Labour Force Survey results are processed and
published for a quarterly period.
|
|
|
|
|
|
Definicije
nezaposlene osobe: registrirana nezaposlena osoba jest
osoba prijavljena kod Hrvatskog zavoda za zapošljavanje, odnosno svaka
osoba koja zadovoljava kriterije koje definiraju Zakon o posredovanju pri
zapošljavanju i pravima za vrijeme nezaposlenosti i Hrvatski zavod za
zapošljavanje. U Anketi o radnoj snazi nezaposlene osobe jesu osobe koje
prema međunarodnoj definiciji u referentnom tjednu nisu obavljale posao za
plaćanje u novcu ili u naturi, aktivno su tražile posao u razdoblju od četiri
tjedna prije anketiranja, eventualni ponuđeni posao mogle bi početi
obavljati u sljedeća dva tjedna te osobe koje su pronašle posao na kojem će
početi raditi u skoroj budućnosti nakon anketiranja.
|
|
Definition of unemployed persons: a registered unemployed person is a
person who is registered with the Croatian Employment Service, that is,
each person who meets criteria defined by the Act on Job Placement and
Unemployment Insurance and the Croatian Employment Service. According to
the Labour Force Survey, an unemployed person is either a person who did
not perform any work for payment in cash or kind in the reference week, and
was actively seeking work in the course of four weeks before the interview
and is prepared to start an offered job in the following two weeks or a
person who has found a job and will start working shortly after the
interview.
|
|
|
|
|
|
Objavljivanje
podataka: podaci o broju registriranih nezaposlenih osoba i
registriranoj stopi nezaposlenosti objavljuju se u mjesečnoj dinamici u
Priopćenju "Zaposleni prema djelatnostima i spolu" te u Mjesečnim
statističkim izvješćima Državnog zavoda za statistiku. Priopćenje i
Statističko izvješće s rezultatima Ankete o radnoj snazi objavljuju
usporedbu anketne i registrirane stope nezaposlenosti u tromjesečnoj
dinamici prema spolu. Istodobno, administrativne podatke o nezaposlenosti
objavljuje i Hrvatski zavod za zapošljavanje na nižim teritorijalnim
razinama, dok su podaci Ankete raspoloživi prema NKPJS-u 2012. – 2.
razina.
|
|
Publication: data on registered unemployment and registered
unemployed rate are published monthly in the First Release titled Persons
in Employment by Activity and by Sex as well as in the Statistical Reports
of the Croatian Bureau of Statistics. The First Release and Statistical Report
containing the quarterly Labour Force Survey results are publications in
which the comparison of unemployment rate obtained from the Survey results
and the one from administrative sources are published. At the same time,
the Croatian Employment Service publishes administrative data on
unemployment at lower territorial levels, while the Survey data are
available at
NUTS 2 level.
|
|
|
|
|
|
Podaci
pokazuju da je stopa nezaposlenosti, prema podacima iz administrativnih
izvora, veća u odnosu na pokazatelj izračunan prema podacima Ankete o
radnoj snazi. S jedne strane, to je posljedica ekonomskih aktivnosti onih
kategorija stanovništva koje su prema formalnom statusu nezaposlene ili
neaktivne, a s druge strane, u podacima o nezaposlenima prema
administrativnim izvorima zastupljen je uz stvarno nezaposlene osobe i
velik udio osoba koje prema odrednicama Ankete nisu nezaposlene, ali preko
tog statusa ostvaruju neka socijalna ili materijalna prava.
|
|
The
data show that the unemployment rate based on the administrative data
sources is higher than the Labour Force Survey rate. This is, on one hand,
due to the fact that some categories of population formally classified as
unemployed or inactive are nevertheless active, and on the other,
administrative sources, besides really unemployed persons, include a
significant share of persons who are not classified as unemployed according
to the definition of the Survey, but are through this status entitled to
some social or economic rights and benefits.
|
|
|
|
|
|
Upotrijebljene
klasifikacije:
|
|
Classifications
used:
|
|
|
|
|
|
a)
|
Nacionalna
klasifikacija djelatnosti 2007., usporediva s međunarodnom klasifikacijom
djelatnosti NACE 2007. Rev. 2, upotrijebljena je pri šifriranju obilježja
djelatnosti.
|
|
a)
|
The
National Classification of Activities, 2007 version, comparable to the
international Statistical Classification of Economic Activities in the
European Community, NACE Rev. 2, was used in the coding of economic
activities.
|
|
|
|
|
|
b)
|
Nacionalna
klasifikacija zanimanja 2010. – NKZ 10., usporediva s međunarodnom
klasifikacijom zanimanja ISCO-08, upotrijebljena je pri šifriranju
obilježja zanimanja.
|
|
b)
|
The
National Classification of Occupations, NKZ 10., comparable to the
International Standard Classification of Occupations, ISCO-08, was used in
the coding of occupations.
|
|
|
|
|
|
|
|
|
|
Obuhvat
i usporedivost
|
|
Coverage and comparability
|
|
|
|
|
|
Kao
okvir za izbor uzorka od 1996. do 1999. poslužili su podaci iz Popisa
stanovništva, kućanstava i stanova 1991. godine. U tom razdoblju hrvatska
područja izravno zahvaćena ratom nije bilo moguće uključiti u okvir za
izbor jedinica uzorka.
|
|
The same sample frame was used in the
Labour Force Surveys which were carried out from 1996 to 1999: data from
the Census 1991. In this period, the parts of Croatian territory with still
ongoing war operations at the time when survey was prepared could not be
included in the sample frame.
|
|
|
|
|
|
U 2000.
i 2001. bio je primijenjen okvir za uzorak temeljen na bazi podataka
Hrvatske elektroprivrede koja sadržava adrese svih kućanstava s područja
Republike Hrvatske. Time se uzorak i podaci koji proizlaze iz Ankete
počevši od 2000. odnose na cijelu Republiku Hrvatsku.
|
|
The database of the Croatian Electrical
Utility containing data on households spread on the whole Croatian
territory was used as a sample frame for 2000 and 2001. Hence, for the
first time, the sample and the Survey results, since 2000, have related to
the whole Republic of Croatia.
|
|
|
|
|
|
Od
početka 2002. u provedbi Ankete o radnoj snazi primjenjuje se okvir za
uzorak temeljen na podacima iz Popisa stanovništva, kućanstava i stanova
2001., a od početka 2014. novi okvir za uzorak koji se temelji na podacima
iz Popisa stanovništva, kućanstava i stanova 2011.
|
|
Starting from the first half-year of
2002, the sample frame based on the Census 2001 data had been used for the
Labour Force Survey, while, since the beginning of 2014, the new sample
frame based on the data from the Census of Population, Households and
Dwellings in 2011 has been in use.
|
|
|
|
|
|
Prema
metodologiji Ankete ne obuhvaća se institucionalno stanovništvo (domovi,
samostani, bolnice za trajni smještaj osoba i slično).
|
|
The Survey methodology determines that
the population residing in institutions (such as homes, convents, hospitals
for long-term treatments, etc.) is not included in the sample frame.
|
|
|
|
|
|
|
|
|
|
Nacrt uzorka
|
|
Sample design
|
|
|
|
|
|
Anketa
o radnoj snazi provedena je na slučajnom uzorku privatnih kućanstava. Od
1996. do 2006. uzorak za Anketu bio je posebno definiran za svako
provedbeno razdoblje, tj. nije bilo ponovljenog anketiranja odnosno
panelnog dijela uzorka. Od 2007. uvedena je panelna komponenta u nacrt
uzorka te se kućanstva ponovljeno anketiraju četiri puta. Međutim, od
početka 2014. prekinuto je ponovljeno anketiranje do tada izabranih
kućanstava zbog promjena u metodologiji obrade i provedbe Ankete. S obzirom
na to da je kao novi okvir za izbor uzorka korišten Popis 2011., sva
kućanstva u prvom tromjesečju 2014. izabrana su prvi put, ali dinamika
anketiranja ostala je ista.
|
|
The Labour Force Survey is based on the
random sample of private households. In the period from 1996 to 2006, the
sample was separately defined for each period, that is, the interviews were
not rerpeated, which means that the sample did not have a panel component.
Since 2007, the panel component had been introduced in the sample design
and households were repeatedly interviewed four times. However, since the
beginning of 2014, the repeated interviewing of previously selected
households has been abandoned due to changes in the methodology of
processing and implementation of the Survey. Having in mind that the 2011
Census has been used as a new sample frame, all households in the first
quarter of 2014 were selected for the first time, but the interviewing
dynamics remained the same.
|
|
|
|
|
|
Dinamika
anketiranja jest sljedeća: kućanstva se anketiraju u dva uzastopna
tromjesečja, izostavljaju iz uzorka iduća dva tromjesečja te ponovno
anketiraju u još dva uzastopna tromjesečja. Tako se omogućuje vremensko
praćenje tijekova osoba na tržištu rada, i to u tromjesečnoj i godišnjoj
dinamici.
|
|
The interviewing dynamics is the
following: households are interviewed in two consecutive quarters, left out
in the following two quarters and interviewed again in two consecutive
quarters. In this way, it is possible to observe flows on the labour market
through time in quarterly and annual dynamics.
|
|
|
|
|
|
Utvrđen
je novi nacrt uzorka. Uzorak se sastoji od četiri nezavisno odabrana
poduzorka, rotacijske grupe ili panela. Nacrt uzorka je dvoetapni
stratificirani. Okvir za izbor uzorka je stratificiran u četiri stratuma
prema NKPJS-u 2012. – 2. razina te u njihovoj dodatnoj podjeli na urbani i
ruralni dio. Slučajan uzorak nastanjenih stanova izabran je u dvije etape,
a upotrijebljeni nacrt uzorka jest dvoetapno uzorkovanje grupa. Prije
izbora uzorka formirani su tzv. segmenti. Segmenti su teritorijalne
jedinice nastale grupiranjem jednoga ili nekoliko susjednih popisnih
krugova, a popisni krugovi jesu teritorijalne jedinice formirane za potrebe
Popisa stanovništva 2011.
|
|
Furthermore, the new sample design has
been determined. The sample consists of four separately selected
subsamples, rotation groups or panels. The sample design is two-stage and
stratified. The sample frame is stratified in four strata at NUTS 2 level
and further separated into urban and rural parts. The random sample of
occupied dwellings is selected in two stages and the sample design used is
a two-stage cluster sampling. Before selecting the sample, the so-called
segments are formed. Segments are territorial units formed by grouping of
one or several neighbouring enumeration districts, which were established
for the purpose of carrying out the 2011 Population Census.
|
|
|
|
|
|
U prvoj
etapi iz svakog stratuma izabran je slučajni uzorak segmenata, a u drugoj
etapi slučajni uzorak stanova nastanjenih privatnim kućanstvima u izabranim
segmentima. Anketirana su sva privatna kućanstva u izabranim stanovima.
|
|
In the first stage the random sample of
segments is chosen from each stratum and in the second one the random
sample of inhabited dwellings within the selected segments. All private
households living in the chosen dwellings are interviewed.
|
|
|
|
|
|
Prosječno
se u jednom tromjesečju u uzorak izabere oko 5 600 stambenih
jedinica. Anketiraju se svi članovi svih privatnih kućanstava koji u tim
stambenim jedinicama stalno žive. U četvrtom tromjesečju 2015. u 3 546
kućanstava bilo je anketirano 8 291 osoba starih 15 i više godina.
|
|
In an average quarter, the sample
consists of approximately 5 600 dwellings. All members of all
private households permanently living in these dwellings are interviewed.
In the fourth quarter of 2015, there were 8 291 persons
aged 15 years and over interviewed in 3 546
households.
|
|
|
|
|
|
|
|
|
|
Utežavanje
|
|
Weighting
|
|
|
|
|
|
Postupak
utežavanja provodi se radi izračuna procjena za cijelu populaciju
kućanstava. Tim postupkom kompenzira se utjecaj nacrta i veličine uzorka te
utjecaj neodgovora kućanstva na Anketu.
|
|
The weighting procedure is carried out
in order to calculate the estimate for the whole household population. This
procedure provides for the compensation of the design and sample size
impact as well as the impact of the non-response of households to the
Survey.
|
|
|
|
|
|
Od
početka 2014. utvrđen je novi proces utežavanja prikupljenih podataka. U
prvoj fazi utežavanja izračunate su težine izbora jedinica u uzorak iz obje
etape uzorkovanja (segmenti i stanovi), a u drugoj fazi težine zbog
prilagodbe neodgovoru jedinica iz uzorka. U posljednjoj fazi utežavanja,
konačne težine iz prve dvije faze kalibrirane su na procjene distribucija
stanovništva po dobnim skupinama, spolu i NKPJS-u prema Popisu 2011., koji
je ažuriran podacima o živorođenim i umrlim osobama te migracijama
stanovništva u Republici Hrvatskoj.
|
|
Since the beginning of 2014, the new
process of weighting the collected data has been determined. In the first
phase of the process, the calculation included the weights of the selection
of units into the sample taken over from both sampling stages (segments and
dwellings) and, in the second one, the weights due to the adjustment to the
non-response of units included in the samlple. In the last phase of
weighting, the final weights calculated in the first two phases were
calibrated at
the population distribution estimates by age groups, sex and statistical
spatial units at NKPJS level 2 according to the 2011 Census, which was
updated with data on live births and deaths as well as on population
migrations in the Republic of Croatia.
|
|
|
|
|
|
Kalibracija
je proces reutežavanja radi uravnoteženja procjena stanovništva po dobnim
skupinama, spolu i prema NKPJS-u 2012. ‒ 2.
razina iz Ankete, tako da te procjene na anketnim podacima točno odgovaraju
totalima cijele populacije, dakle distribuciji stanovništva RH prema dobnim
skupinama, spolu i NKPJS-u iz Popisa 2011.
|
|
The calibration can be described as a
process of reweighting aimed at balancing the population estimates by age
groups, sex and at the NUTS 2 level from the Survey, in other words, the
distribution of the population of the Republic of Croatia by age groups,
sex and statistical spatial units at NKPJS
level 2 from the 2011 Census.
|
|
|
|
|
|
Stopa
neodgovora za četvrto tromjesečje 2015. iznosila je 29,8%,
a stopa odbijanja 18,0%.
|
|
The overall non-response rate for the
fourth quarter of 2015 was 29.8% and the refusal rate was 18.0%.
|
|
|
|
|
|
Sljedeća
tablica prikazuje procjene, standardne pogreške procjena, intervale
pouzdanosti (95%) i koeficijente varijacije za stope aktivnosti,
zaposlenosti i nezaposlenosti.
|
|
The following table shows estimates,
standard errors of estimates,
95% confidence intervals and the variation coefficients for the activity
rate, employment/population ratio and the unemployment rate.
|
|
|
|
|
|
|
|
|
|
Procjene i
mjere preciznosti najvažnijih pokazatelja o ekonomskoj aktivnosti
stanovništva u četvrtom tromjesečju 2015.
Estimates
and precision measures for the most important indicators of economic activity
of population, fourth quarter of 2015
%
|
|
Procjena
Estimate
|
Standardna
pogreška procjene
Standard
estimation error
|
Interval
pouzdanosti (95%)
Confidence
interval (95%)
|
Koeficijent
varijacije
Variation
coefficient
|
|
|
|
|
|
|
|
Stopa
aktivnosti
Activity
rate
|
52,5
|
0,7
|
[51,2;
53,8]
|
1,3
|
|
|
|
|
|
|
|
Stopa
zaposlenosti
Employment rate
|
44,0
|
0,7
|
[42,7;
45,4]
|
1,5
|
|
|
|
|
|
|
|
Stopa
nezaposlenosti
Unemployment
rate
|
16,1
|
0,7
|
[14,7;
17,5]
|
4,6
|
Kratice
|
|
|
Abbreviations
|
|
|
|
|
|
|
ARS
|
Anketa o radnoj
snazi
|
|
CES
|
Croatian
Employment Service
|
|
HZZ
|
Hrvatski zavod za
zapošljavanje
|
|
Eurostat
|
Statistical Office
of the European Communities
|
|
NACE
|
Statistička
klasifikacija ekonomskih djelatnosti u Europskoj zajednici
|
|
ILO
ISCO
|
International
Labour Organisation
International
Standard Classification of Occupations
|
|
NN
NKD 2007.
|
Narodne novine
Nacionalna
klasifikacija djelatnosti, verzija 2007.
|
|
NACE
|
Statistical
Classification of Economic Activities in the European Community
|
|
NKPJS 2012.
NKZ 10.
tis.
|
Nacionalna
klasifikacija prostornih jedinica za statistiku 2012.
Nacionalna
klasifikacija zanimanja, verzija 2010.
tisuća
|
|
NKD 2007.
NKPJS
NKZ 10.
NN
|
National
Classification of Activities, 2007 version
Nomenclature of
Territorial Units for Statistics
National
Classification of Occupations, 2010 version
Narodne novine,
official gazette of the Republic of Croatia
|
|
|
|
|
NUTS
|
common
classification of territorial units for statistics
|
|
|
|
|
‘000
|
thousand
|
|
|
|
|
|
|
|
|
|
|
|
|
|
Znakovi
|
|
Symbols
|
|
|
|
|
|
|
|
-
|
nema pojave
|
|
-
|
no occurrence
|
|
.
|
podatak je
različit od nule, ali se ne objavljuje jer je procjena vrlo neprecizna
|
|
.
(( ))
|
not zero, but
extremely inaccurate estimation
inaccurate
estimation
|
|
(( ))
|
neprecizna
procjena
|
|
( )
|
less accurate
estimation
|
|
( )
|
manje precizna
procjena
|
|
|
|
|
|
|
|
|
|
|
|
|
|
|
|
|
|
|
|
|
|
|
|
Objavljuje
i tiska Državni zavod za statistiku Republike Hrvatske, Zagreb, Ilica 3, p.
p. 80.
Published and printed by the Croatian Bureau of
Statistics, Zagreb, Ilica 3, P. O. B. 80
Telefon/ Phone:
+385 (0) 1 4806-111, telefaks/ Fax: +385 (0) 1 4817-666
Odgovara
ravnatelj Marko Krištof.
Person
responsible: Marko Krištof, Director General
Priredili:
Marina Munitić, Martina Špundak, Radoslavka Buktenica, Mario Gavrić i Sandra
Truntić
Prepared
by:
Marina Munitić, Martina Špundak, Radoslavka Buktenica, Mario Gavrić and
Sandra Truntić
|
|
MOLIMO KORISNIKE DA PRI KORIŠTENJU
PODATAKA NAVEDU IZVOR.
USERS
ARE KINDLY REQUESTED TO STATE THE SOURCE
|
|
Naklada:
20 primjeraka
20 copies
printed
Podaci iz
ovog priopćenja objavljuju se i na internetu.
First Release data
are also published on the Internet
|