|

GODINA/ YEAR: LIII. ZAGREB,
27. SVIBNJA 2016./ 27 MAY, 2016 BROJ/
NUMBER: 2.1.4/3.
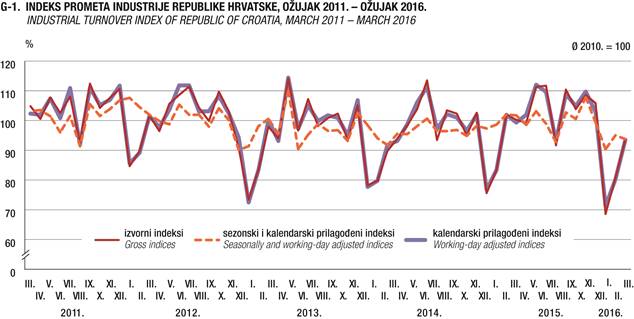
INDEKS PROMETA INDUSTRIJE U OŽUJKU
2016., PRVI REZULTATI
INDUSTRIAL TURNOVER INDEX IN INDUSTRY, MARCH 2016,
FIRST RESULTS
|
Ukupni
sezonski i kalendarski prilagođen promet industrije1) u Republici Hrvatskoj u ožujku 2016. u
usporedbi s veljačom 2016. bilježi
pad za 1,4%. Ako usporedimo tržišta, u istom razdoblju na domaćem tržištu
zabilježen je pad za 1,6%, a na stranom tržištu rast za 0,6%.
|
|
The
total seasonally and working-day adjusted industrial turnover1) in the Republic of Croatia in March
2016, as compared to February 2016, decreased by 1.4%. If compared by the
destination of markets, then, in the same period, it decreased by 1.6% on
the domestic market, while on the non-domestic market it increased by 0.6%.
|
|
|
|
|
|
U ožujku 2016. u
usporedbi s ožujkom 2015. ukupni promet industrije, kalendarski prilagođen2),
u Republici Hrvatskoj bilježi pad za 8,2%. Ako usporedimo tržišta, u istom razdoblju na domaćem
tržištu zabilježen je pad za 11,5% i na stranome za 4,0%.
|
|
In March
2016, as compared to March 2015, the total industrial turnover in the
Republic of Croatia, working-day adjusted2),
decreased by 8.2%. If compared by the destination of markets, then, in the
same period, it decreased by 11.5% on the domestic market and by 4.0% on
the non
-domestic market.
|
|
1)
|
Podaci koji se uspoređuju s podacima od prethodnog mjeseca
(tzv. mjesečna usporedba prema Eurostatovoj terminologiji i praksi) za
promet industrije su sezonski i kalendarski prilagođeni podaci u skladu s
Uredbom Vijeća (EZ-a) br. 1165/98 i preporukama o kratkoročnim statistikama
za objavljivanje podataka o kratkoročnim statistikama, posebno za
prezentaciju indeksa industrijske proizvodnje.
|
|
1)
|
Data compared to those of the previous month (the so-called
month-on-month comparison according to Eurostat’s terminology and practice)
for turnover received are seasonally and working-day adjusted data, in line
with the Council Regulation No. 1165/98 of the EU and the STS
recommendations for publishing of STS data, in particular referring to the
presentation of the industrial production indices.
|
|
|
|
|
|
|
|
2)
|
Podaci koji se uspoređuju s podacima od istog mjeseca
prethodne godine (tzv. godišnja usporedba prema Eurostatovoj terminologiji
i praksi) jesu za promet industrije kalendarski prilagođeni
podaci.
|
|
2)
|
Data compared to those of the same month or of the same period
of the previous year (the so
-called year-on-year comparison according to Eurostat’s terminology and
practice) are the following for
industrial turnover, working-day adjusted data.
|
|
MJESEČNA USPOREDBA
PREMA GIG-u 2009.
Sezonski i kalendarski prilagođeni indeksi1)
|
|
MONTHLY
COMPARISON, ACCORDING TO MIGs 2009.
Seasonally and working-day adjusted indices1)
|
|
|
|
|
|
PROMET INDUSTRIJE
|
|
INDUSTRIAL
TURNOVER
|
|
|
|
|
|
U ožujku
2016. u usporedbi s veljačom 2016. ukupna prodaja Energije manja je
za 13,8%,
Kapitalnih proizvoda za 3,9% i Intermedijarnih
proizvoda za 1,1%, dok je ukupna prodaja Trajnih proizvoda za široku
potrošnju veća za 6,1% i Netrajnih proizvoda za široku potrošnju za 0,5%.
|
|
In
March 2016, as compared to February 2016, the total turnover of Energy was
by 13.8%, of Capital goods by 3.9% and of Intermediate goods by 1.1% lower,
while that of Durable consumer goods was by 6.1% and of Non-durable
consumer goods by 0.5% higher.
|
|
|
|
|
|
|
|
|
|
GODIŠNJA USPOREDBA
NA RAZINI GIG-a 2009.
|
|
ANNUAL COMPARISON,
ACCORDING TO MIGs 2009.
|
|
PROMET INDUSTRIJE (kalendarski
prilagođeni indeksi)
|
|
INDUSTRIAL
TURNOVER (working-day adjusted indices)
|
|
|
|
|
|
U ožujku
2016. u usporedbi s ožujkom 2015. Energija je manja za 57,4%,
Intermedijarni proizvodi za 5,9% i Kapitalni proizvodi za 0,8%, a Trajni
proizvodi za široku potrošnju veći su za 24,8% i Netrajni proizvodi za
široku potrošnju za 4,1%.
|
|
In
March 2016, as compared to March 2015, Energy was by 57.4%, Intermediate
goods by 5.9% and Capital goods by 0.8% lower, while Durable consumer goods
were by 24.8% and Non-durable consumer goods by 4.1% higher.
|
1.1. PROMET
INDUSTRIJE – MJESEČNE STOPE PROMJENA IZRAČUNANE IZ SEZONSKI I KALENDARSKI
PRILAGOĐENIH INDEKSA
INDUSTRIAL
TURNOVER – MONTH-ON-MONTH GROWTH RATES CALCULATED ON BASIS OF SEASONALLY AND
WORKING-DAY
ADJUSTED INDICES
|
|
X. 2015.
IX. 2015.
|
XI. 2015.
X. 2015.
|
XII. 2015.
XI. 2015.
|
I. 2016.
XII. 2015.
|
II. 2016.
I. 2016.
|
III. 2016.
II. 2016.
|
|
|
|
|
|
|
|
|
|
|
|
|
|
|
|
Ukupno industrija
|
-2,1
|
7,3
|
-7,9
|
-9,0
|
5,2
|
-1,4
|
|
Total
industry
|
|
|
|
|
|
|
|
|
|
|
|
|
|
Prema GIG-u 2009.
|
|
|
|
|
|
|
|
According to MIGs 2009.
|
|
AI
|
Intermedijarni proizvodi
|
0,2
|
1,2
|
-2,1
|
0,4
|
1,2
|
-1,1
|
AI
|
Intermediate goods
|
|
AE
|
Energija
|
-1,6
|
-8,0
|
-0,8
|
-23,9
|
-28,4
|
-13,8
|
AE
|
Energy
|
|
BB
|
Kapitalni proizvodi
|
-11,4
|
29,0
|
-18,1
|
-4,4
|
14,1
|
-3,9
|
BB
|
Capital goods
|
|
CD
|
Trajni proizvodi za široku
potrošnju
|
3,7
|
-0,5
|
-2,1
|
0,7
|
5,5
|
6,1
|
CD
|
Consumer durables
|
|
CN
|
Netrajni proizvodi za široku
potrošnju
|
-4,0
|
2,8
|
-2,1
|
-13,6
|
13,9
|
0,5
|
CN
|
Consumer non-durables
|
|
|
|
|
|
|
|
|
|
|
|
|
|
Prema tržištima
|
|
|
|
|
|
|
|
According to markets
|
|
|
Prodaja na domaće tržište
|
-6,4
|
10,5
|
-1,0
|
-17,6
|
11,2
|
-1,6
|
|
Domestic industrial turnover
|
|
|
Prodaja na strano tržište
|
-2,4
|
6,5
|
-11,2
|
-7,4
|
2,2
|
0,6
|
|
Non-domestic industrial turnover
|
1.2. PROMET INDUSTRIJE – GODIŠNJE STOPE
PROMJENA IZRAČUNANE IZ KALENDARSKI PRILAGOĐENIH INDEKSA
INDUSTRIAL
TURNOVER – YEAR-ON-YEAR GROWTH RATES CALCULATED ON BASIS OF WORKING-DAY
ADJUSTED INDICES
|
|
X. 2015.
X. 2014.
|
XI. 2015.
XI. 2014.
|
XII. 2015.
XII. 2014.
|
I. 2016.
I. 2015.
|
II. 2016.
II. 2015.
|
III. 2016.
III. 2015.
|
I. - III. 2016.
I. - III. 2015.
|
|
|
|
|
|
|
|
|
|
|
|
|
|
|
|
|
Ukupno industrija
|
3,8
|
13,7
|
0,8
|
-7,2
|
-3,8
|
-8,2
|
-6,5
|
|
Total industry
|
|
|
|
|
|
|
|
|
|
|
|
|
|
Prema GIG-u 2009.
|
|
|
|
|
|
|
|
|
According to MIGs 2009.
|
|
AI
|
Intermedijarni proizvodi
|
4,8
|
9,7
|
-0,2
|
3,4
|
2,0
|
-5,9
|
-0,8
|
AI
|
Intermediate goods
|
|
AE
|
Energija
|
-15,5
|
-17,3
|
-18,1
|
-44,7
|
-62,2
|
-57,4
|
-55,4
|
AE
|
Energy
|
|
BB
|
Kapitalni proizvodi
|
6,0
|
40,9
|
-4,5
|
11,8
|
19,9
|
-0,8
|
8,8
|
BB
|
Capital goods
|
|
CD
|
Trajni proizvodi za široku
potrošnju
|
28,3
|
23,5
|
21,7
|
20,6
|
13,2
|
24,8
|
19,5
|
CD
|
Consumer durables
|
|
CN
|
Netrajni proizvodi za široku
potrošnju
|
1,2
|
5,5
|
1,7
|
-16,3
|
-3,1
|
4,1
|
-4,9
|
CN
|
Consumer non-durables
|
|
|
|
|
|
|
|
|
|
|
|
|
Prema tržištima
|
|
|
|
|
|
|
|
|
According to markets
|
|
Prodaja na domaće tržište
|
-6,2
|
8,4
|
8,6
|
-13,6
|
-4,0
|
-11,5
|
-9,8
|
|
Domestic industrial turnover
|
|
Prodaja na strano tržište
|
18,2
|
22,6
|
-3,3
|
0,0
|
-1,4
|
-4,0
|
-2,0
|
|
Non-domestic industrial turnover
|
1.3. PROMET INDUSTRIJE – IZVORNI
(NEPRILAGOĐENI) INDEKSI UKUPNO I PREMA GIG-u 2009. U OŽUJKU 2016.
INDUSTRIAL
TURNOVER – GROSS (UNADJUSTED) INDICES, TOTAL AND ACCORDING TO MIGs 2009., MARCH
2016
|
|
Struktura
Structure
|
III. 2016.
Ø 2015.
|
III. 2016.
III. 2015.
|
I. – III. 2016.
I. – III. 2015.
|
|
|
|
|
|
|
|
|
|
|
|
Ukupno industrija
|
100,00
|
93,3
|
91,8
|
93,1
|
|
Total industry
|
|
|
|
|
|
|
|
|
|
|
Prema GIG-u 2009.
|
|
|
|
|
|
According to MIGs 2009.
|
|
AI
|
Intermedijarni proizvodi
|
30,76
|
102,9
|
92,3
|
97,9
|
AI
|
Intermediate goods
|
|
AE
|
Energija
|
10,82
|
40,4
|
42,6
|
44,6
|
AE
|
Energy
|
|
BB
|
Kapitalni proizvodi
|
15,86
|
102,0
|
122,1
|
117,5
|
BB
|
Capital goods
|
|
CD
|
Trajni proizvodi za široku
potrošnju
|
2,26
|
119,2
|
115,1
|
109,2
|
CD
|
Consumer durables
|
|
CN
|
Netrajni proizvodi za široku
potrošnju
|
40,30
|
95,4
|
92,6
|
100,4
|
CN
|
Consumer non-durables
|
|
|
|
|
|
|
|
|
|
Prema tržištima
|
|
|
|
|
|
According to markets
|
|
Prodaja na domaće tržište
|
59,87
|
92,3
|
88,5
|
89,9
|
|
Domestic industrial turnover
|
|
Prodaja na strano tržište
|
40,13
|
94,9
|
96,0
|
98,1
|
|
Non-domestic industrial turnover
|
I. DODATAK – INDEKSI PROMETA INDUSTRIJE –
VREMENSKE SERIJE
ANNEX – INDUSTRIAL TURNOVER INDICES – TIME
SERIES
1. UKUPNO INDUSTRIJA I PREMA GIG-u 2009. –
IZVORNI INDEKSI I KALENDARSKI PRILAGOĐENI INDEKSI
TOTAL INDUSTRY AND ACCORDING TO MIGs 2009.
– GROSS AND WORKING-DAY ADJUSTED INDICES
Æ 2010. = 100
|
|
Izvorni indeksi
Gross indices
|
Kalendarski prilagođeni indeksi
Working-day adjusted indices
|
|
|
ukupno
Total
|
Intermedijarni proizvodi Intermediate goods
|
Energija
Energy
|
Kapitalni proizvodi
Capital
goods
|
Trajni proizvodi
za široku potrošnju Consumer
durables
|
Netrajni proizvodi
za široku potrošnju Consumer
non-durables
|
ukupno
Total
|
Intermedijarni proizvodi Intermediate goods
|
Energija
Energy
|
Kapitalni proizvodi
Capital
goods
|
Trajni proizvodi
za široku potrošnju Consumer
durables
|
Netrajni proizvodi
za široku potrošnju Consumer
non-durables
|
|
|
|
|
|
|
|
|
|
|
|
|
|
|
|
|
2014.
|
|
|
|
|
|
|
|
|
|
|
|
|
|
|
|
III.
|
89,7
|
118,4
|
88,0
|
65,4
|
85,6
|
89,0
|
91,7
|
117,4
|
88,0
|
65,4
|
88,1
|
90,6
|
|
IV.
|
93,9
|
113,1
|
112,5
|
69,1
|
76,4
|
93,4
|
93,1
|
115,4
|
112,5
|
69,1
|
75,5
|
92,2
|
|
V.
|
98,3
|
114,3
|
113,8
|
67,8
|
87,9
|
105,3
|
98,7
|
114,7
|
113,8
|
67,8
|
88,3
|
105,5
|
|
VI.
|
103,8
|
115,1
|
119,6
|
82,2
|
76,2
|
111,5
|
106,1
|
117,6
|
119,6
|
82,2
|
78,6
|
112,7
|
|
VII.
|
113,5
|
123,1
|
139,7
|
84,5
|
88,7
|
122,5
|
111,3
|
121,0
|
139,7
|
84,5
|
86,3
|
121,4
|
|
VIII.
|
93,4
|
95,8
|
129,1
|
57,5
|
57,4
|
108,0
|
97,1
|
100,1
|
129,1
|
57,5
|
60,5
|
110,0
|
|
IX.
|
103,4
|
117,5
|
107,7
|
87,8
|
88,1
|
109,1
|
102,1
|
116,1
|
107,7
|
87,8
|
86,5
|
108,5
|
|
X.
|
102,3
|
113,7
|
110,9
|
89,7
|
80,6
|
107,0
|
101,0
|
112,3
|
110,9
|
89,7
|
79,2
|
106,4
|
|
XI.
|
94,9
|
103,2
|
90,2
|
91,3
|
78,9
|
102,1
|
96,5
|
105,0
|
90,2
|
91,3
|
80,6
|
102,9
|
|
XII.
|
102,6
|
105,9
|
73,2
|
132,2
|
75,8
|
107,4
|
101,9
|
105,2
|
73,2
|
132,2
|
75,1
|
107,1
|
|
|
|
|
|
|
|
|
|
|
|
|
|
|
|
|
2015.
|
|
|
|
|
|
|
|
|
|
|
|
|
|
|
|
I.
|
75,5
|
84,2
|
54,1
|
57,1
|
61,0
|
89,8
|
76,7
|
86,0
|
54,1
|
57,1
|
62,3
|
90,5
|
|
II.
|
83,3
|
98,8
|
62,4
|
65,3
|
81,2
|
90,9
|
83,3
|
98,8
|
62,4
|
65,3
|
81,2
|
90,9
|
|
III.
|
102,0
|
125,1
|
83,0
|
93,6
|
85,4
|
95,7
|
101,9
|
126,6
|
83,0
|
93,6
|
85,3
|
95,4
|
|
IV.
|
100,2
|
120,2
|
111,8
|
75,0
|
95,4
|
101,7
|
99,3
|
117,6
|
111,8
|
75,0
|
94,2
|
101,6
|
|
V.
|
99,2
|
115,2
|
96,8
|
80,7
|
91,4
|
103,9
|
101,9
|
118,1
|
96,8
|
80,7
|
94,8
|
105,2
|
|
VI.
|
111,3
|
119,5
|
110,6
|
111,8
|
95,9
|
112,5
|
112,0
|
120,2
|
110,6
|
111,8
|
96,7
|
112,8
|
|
VII.
|
111,7
|
126,7
|
110,3
|
88,3
|
99,7
|
120,8
|
109,6
|
124,5
|
110,3
|
88,3
|
97,0
|
119,7
|
|
VIII.
|
91,6
|
96,2
|
101,0
|
66,6
|
68,0
|
108,0
|
93,1
|
98,0
|
101,0
|
66,6
|
69,5
|
108,8
|
|
IX.
|
110,4
|
121,2
|
93,5
|
103,7
|
101,1
|
116,6
|
108,9
|
119,8
|
93,5
|
103,7
|
99,4
|
115,9
|
|
X.
|
103,8
|
116,6
|
93,7
|
95,1
|
100,3
|
107,2
|
104,8
|
117,6
|
93,7
|
95,1
|
101,6
|
107,6
|
|
XI.
|
108,6
|
114,2
|
74,6
|
128,6
|
98,2
|
108,1
|
109,7
|
115,2
|
74,6
|
128,6
|
99,6
|
108,6
|
|
XII.
|
105,8
|
108,2
|
59,9
|
126,2
|
95,1
|
110,4
|
102,8
|
105,0
|
59,9
|
126,2
|
91,4
|
108,9
|
|
|
|
|
|
|
|
|
|
|
|
|
|
|
|
|
2016.
|
|
|
|
|
|
|
|
|
|
|
|
|
|
|
|
I.
|
68,5
|
84,7
|
29,9
|
63,9
|
71,3
|
74,4
|
71,2
|
89,0
|
29,9
|
63,9
|
75,2
|
75,7
|
|
II.
|
80,7
|
101,5
|
23,6
|
78,3
|
92,7
|
88,3
|
80,2
|
100,8
|
23,6
|
78,3
|
91,9
|
88,1
|
|
III.
|
93,6
|
115,4
|
35,4
|
92,8
|
106,6
|
100,6
|
93,5
|
119,1
|
35,4
|
92,8
|
106,4
|
99,3
|
2. INDEKSI PROMETA INDUSTRIJE, UKUPNO I PREMA
GIG-u 2009. – SEZONSKI I KALENDARSKI PRILAGOĐENI INDEKSI TE TREND
INDUSTRIAL TURNOVER
INDICES, TOTAL AND ACCORDING TO MIGs 2009. – SEASONALLY AND WORKING-DAY
ADJUSTED INDICES AND TREND
Æ 2010. = 100
|
|
Sezonski i kalendarski prilagođeni indeksi
Seasonally and working-day adjusted indices
|
Trend
Trend
|
|
|
ukupno
Total
|
Intermedijarni proizvodi Intermediate goods
|
Energija
Energy
|
Kapitalni proizvodi
Capital
goods
|
Trajni proizvodi
za široku potrošnju Consumer
durables
|
Netrajni proizvodi
za široku potrošnju Consumer
non-durables
|
ukupno
Total
|
Intermedijarni proizvodi Intermediate goods
|
Energija
Energy
|
Kapitalni proizvodi
Capital
goods
|
Trajni proizvodi
za široku potrošnju Consumer
durables
|
Netrajni proizvodi
za široku potrošnju Consumer
non-durables
|
|
|
|
|
|
|
|
|
|
|
|
|
|
|
|
|
2014.
|
|
|
|
|
|
|
|
|
|
|
|
|
|
|
|
III.
|
91,7
|
110,7
|
90,1
|
66,3
|
87,1
|
94,7
|
95,0
|
110,3
|
113,6
|
73,4
|
80,7
|
103,7
|
|
IV.
|
95,5
|
109,9
|
108,3
|
77,6
|
77,4
|
97,0
|
95,3
|
110,0
|
112,5
|
73,6
|
80,4
|
104,7
|
|
V.
|
95,4
|
107,0
|
109,9
|
70,5
|
82,2
|
103,0
|
96,1
|
109,7
|
111,9
|
74,3
|
79,5
|
105,5
|
|
VI.
|
98,1
|
111,6
|
112,7
|
75,3
|
76,2
|
104,5
|
96,9
|
109,3
|
111,6
|
75,3
|
78,4
|
106,1
|
|
VII.
|
100,6
|
109,7
|
116,9
|
84,7
|
78,7
|
105,6
|
97,5
|
109,1
|
110,9
|
76,5
|
77,2
|
106,2
|
|
VIII.
|
96,4
|
108,4
|
107,4
|
69,3
|
72,8
|
104,0
|
97,5
|
108,8
|
109,0
|
78,0
|
76,0
|
105,6
|
|
IX.
|
96,4
|
108,9
|
103,6
|
83,8
|
79,8
|
102,6
|
97,0
|
108,7
|
105,4
|
79,5
|
75,1
|
104,8
|
|
X.
|
96,8
|
107,1
|
103,9
|
80,8
|
72,8
|
103,8
|
96,5
|
108,8
|
100,1
|
81,0
|
74,9
|
104,2
|
|
XI.
|
94,8
|
103,4
|
93,3
|
79,5
|
75,8
|
102,3
|
96,5
|
109,2
|
94,5
|
82,5
|
75,6
|
104,2
|
|
XII.
|
98,2
|
112,2
|
91,4
|
94,9
|
75,5
|
104,2
|
97,1
|
109,8
|
89,9
|
83,8
|
77,2
|
104,8
|
|
|
|
|
|
|
|
|
|
|
|
|
|
|
|
|
2015.
|
|
|
|
|
|
|
|
|
|
|
|
|
|
|
|
I.
|
97,3
|
108,9
|
85,1
|
76,6
|
77,2
|
109,6
|
98,1
|
110,5
|
87,7
|
85,0
|
79,7
|
105,6
|
|
II.
|
98,6
|
111,8
|
81,8
|
81,4
|
87,0
|
107,7
|
99,3
|
111,2
|
88,2
|
86,0
|
82,8
|
106,1
|
|
III.
|
102,0
|
119,9
|
84,8
|
95,5
|
83,7
|
100,3
|
100,1
|
111,7
|
90,3
|
86,9
|
85,9
|
106,1
|
|
IV.
|
101,7
|
111,7
|
105,8
|
84,7
|
95,5
|
107,0
|
100,6
|
112,0
|
92,6
|
87,8
|
88,2
|
105,6
|
|
V.
|
98,5
|
111,0
|
93,0
|
84,7
|
88,4
|
102,8
|
100,7
|
112,3
|
93,9
|
88,7
|
89,4
|
104,7
|
|
VI.
|
103,1
|
113,8
|
101,5
|
101,7
|
93,5
|
104,1
|
100,7
|
112,6
|
93,4
|
89,8
|
90,0
|
104,0
|
|
VII.
|
98,9
|
113,2
|
85,9
|
88,8
|
88,5
|
103,7
|
100,8
|
112,7
|
90,9
|
90,9
|
90,3
|
103,8
|
|
VIII.
|
92,7
|
106,1
|
80,1
|
80,6
|
84,3
|
103,0
|
101,0
|
112,8
|
87,4
|
92,1
|
90,7
|
104,1
|
|
IX.
|
102,7
|
112,6
|
88,5
|
96,9
|
91,3
|
109,7
|
101,4
|
112,9
|
84,3
|
93,5
|
91,5
|
104,8
|
|
X.
|
100,5
|
112,8
|
87,1
|
85,9
|
94,7
|
105,3
|
101,8
|
113,0
|
83,2
|
94,7
|
92,4
|
105,6
|
|
XI.
|
107,8
|
114,1
|
80,1
|
110,7
|
94,2
|
108,2
|
102,2
|
113,2
|
84,0
|
95,9
|
93,5
|
106,4
|
|
XII.
|
99,3
|
111,7
|
79,5
|
90,7
|
92,2
|
105,9
|
102,5
|
113,5
|
86,2
|
97,0
|
94,3
|
106,8
|
|
|
|
|
|
|
|
|
|
|
|
|
|
|
|
2016.
|
|
|
|
|
|
|
|
|
|
|
|
|
|
|
|
I.
|
90,3
|
112,2
|
60,5
|
86,7
|
92,8
|
91,5
|
1)
|
1)
|
1)
|
1)
|
1)
|
1)
|
|
II.
|
95,0
|
113,5
|
43,4
|
98,9
|
97,9
|
104,3
|
1)
|
1)
|
1)
|
1)
|
1)
|
1)
|
|
III.
|
93,7
|
112,3
|
37,4
|
95,1
|
103,9
|
104,8
|
1)
|
1)
|
1)
|
1)
|
1)
|
1)
|
1) Vremenske
serije trend-indeksa objavljuju se tri puta na godinu.
1) Time series of trend indices are
released three times a year.
|
METODOLOŠKA
OBJAŠNJENJA
|
|
NOTES
ON METHODOLOGY
|
|
|
|
|
|
|
|
|
|
Državni
zavod za statistiku u ovom priopćenju objavljuje indeks prometa industrije
na međumjesečnoj i međugodišnjoj lančanoj osnovi na stalnoj baznoj godini
2010. = 100 u skladu s Uredbom Vijeća EU-a o kratkoročnim
statistikama (Short-Term Statistics) br. 1165/98. i njezinim
izmjenama i dopunama. Spomenutim uredbama EU-a propisana je obvezatna
primjena nove bazne godine 2010. za sve države članice pri objavljivanju i
diseminaciji indeksa prometa industrije od izvještajnog mjeseca siječnja
2014.
|
|
The
Croatian Bureau of Statistics is issuing, in this first release, the
industrial turnover index on a month-on-month and interannual chain basis
and on the fixed base year 2010 = 100 in line with the Council
Regulation (EC) concerning Short-Term Statistics No. 1165/98 and its
amendments. These EU regulations prescribe the implementation of the new
base year 2010, which has been mandatory for all Member States in
publishing and disseminating industrial turnover index since the reference
month January 2014.
|
|
|
|
|
|
Kratkoročni
poslovni pokazatelji industrije (indeks industrijske proizvodnje i indeks
prometa industrije) mogu se koristiti kao pokazatelji razvoja tržišta
industrijskih proizvoda i usluga proizvedenih unutar industrije.
|
|
Short-term
business indicators on industry – the
industrial production index and the industrial turnover index – can be used
to show the monthly market evolution of the products and services produced
within industry.
|
|
|
|
|
|
Indeksima
prometa industrije na domaćem tržištu mjeri se mjesečno kretanje
industrijskog prometa/prodaje koji su ostvarila industrijska
poduzeća/industrijske lokalne jedinice na teritoriju Republike Hrvatske,
dok se indeksima prometa industrije na stranom tržištu mjeri
kretanje industrijskog prometa/prodaje koji su ostvarila industrijska
poduzeća/ industrijske lokalne jedinice sa stranog tržišta, tj. izvan
teritorija Republike Hrvatske.
|
|
Additionally,
industrial turnover indices on domestic market serve to measure
monthly movements in industrial turnover/production sold realised by
industrial enterprises/industrial local units on the territory of the
Republic of Croatia, while on the other hand, industrial turnover indices
on non-domestic market serve to measure monthly movements in
turnover/production sold realised by industrial enterprises/industrial
local units on the non-domestic market, that is, outside the territory of
the Republic of Croatia.
|
|
|
|
|
|
Priopćenje
br. 2.1.4./2016. objavljuje se, po pravilu, 27. u sljedećemu mjesecu za
indekse iz prethodnoga izvještajnog mjeseca. Točni datumi navedeni su u
Kalendaru objavljivanja statističkih podataka 2016., koji se može naći,
osim u tiskanom obliku, i na internetskim stranicama Državnog zavoda za
statistiku www.dzs.hr.
|
|
The
first release No. 2.1.4./2016 is usually published on the 27th
day in the next month for indices from the previous reference month and
accurate dissemination dates are listed in the Calendar of Statistical Data
Issues for 2016, which are available, besides in the printed form, on the
web site of the Croatian Bureau of Statistics: www.dzs.hr.
|
|
|
|
|
|
|
|
|
|
Pravna
i metodološka osnova
|
|
Legal
and methodological framework
|
|
|
|
|
|
Mjesečno
istraživanje o prometu industrije (IND-2/KPS/M) u 2016. provodi Državni
zavod za statistiku na temelju Zakona o službenoj statistici (NN, br.
103/03., 75/09. i 59/12.).
|
|
The
Monthly Survey on Industrial Turnover (IND-2/KPS/M form) is carried out in
2016 by the Croatian Bureau of Statistics on the basis of the Official
Statistics Act (NN, Nos 103/03, 75/09 and 59/12).
|
|
|
|
|
|
Koncepti
i definicije koji se primjenjuju u istraživanju IND-2/KPS/M usklađeni su s
konceptima i definicijama iz Metodologije za kratkoročne poslovne
statistike EU-a (Tema 4, ISSN 1725-0099, Europska zajednica, 2006.) i
Uredbe Komisije (EZ-a) br. 1503/2006. o definicijama varijabla, popisu
varijabla i učestalosti prikupljanja podataka.
|
|
Concepts
and definitions used in the IND-2/KPS/M Survey are harmonised with the EU
Methodology of Short-Term Business Statistics (Theme 4, ISSN 1725-0099;
European Communities, 2006) as well as with the Commission Regulation (EC)
No 1503/2006 on definitions of variables, list of variables and frequency
of data compilation.
|
|
|
|
|
|
Pokrivenost
i obuhvat
|
|
Scope
and coverage
|
|
|
|
|
|
Istraživanjem
IND-2/KPS/M obuhvaćena su sva poduzeća i njihovi dijelovi s 20 i više
zaposlenih osoba koji se bave jednom ili više industrijskih djelatnosti
prema definiciji pokrivenosti djelatnosti NKD-a 2007. (NN, br. 58/07. i
72/07.) za svaki pokazatelj posebno jer je pokrivenost različita prema
propisima EU-a.
|
|
The
IND-2/KPS/M Survey covers enterprises and parts thereof
employing 20 or more persons employed and performing one or several
industrial activities by definitions of activity coverage of the NKD 2007.
(NN, Nos 58/07 and 72/07) for each indicator separately due to the
differences in coverage according to legislation of EU.
|
|
|
|
|
Indeks
prometa industrije pokriva samo dva industrijska područja
NKD-a 2007., i to područja B Rudarstvo i vađenje i C Prerađivačka
industrija te njihove odjeljke 05 – 33. U istraživanju IND-2/KPS/M za 2016.
obuhvaćeno je 3019 poduzeća (pravne osobe i obrtnici). U ožujku 2016. stopa
odgovora je 99,2%, a stopa procijenjenih obrazaca 0,8%.
|
|
Industrial
turnover index covers only two industrial sections of the NKD 2007., that
is, sections B Mining and quarrying and C Manufacturing, and their
divisions 05 – 33. The IND-2/KPS/M Survey for 2016 covers 3019 enterprises
(legal entities and tradesmen). In March2016, the response rate was 99.2%,
while the estimation of non-responded forms was 0.8%.
|
|
|
|
|
|
|
|
|
Izvještajno
razdoblje
|
|
Reference
period
|
|
|
|
|
|
Izvještajno
razdoblje jest mjesec dana i poklapa se s kalendarskim mjesecom. Metoda
prikupljanja podataka za IND-2/KPS/M u 2016. promijenjena je radi smanjenja
tereta izvješćivanja za mala i srednja poduzeća te povećanja kvalitete
rezultata.
|
|
The
reference period for data collection is one month and is identical to a
calendar month. The data collection method used in 2016 has changed in order
to reduce the reporting burden for small and medium size enterprises and to
increase the quality of the results.
|
|
|
|
|
|
Stoga se za
prikupljanje podataka u 2016. primjenjuje kombinirana metoda korištenja
dvaju izvora podataka: administrativni izvor (97,7% jedinica) i statistički
izvor neposrednim prikupljanjem podataka od izvještajnih jedinica (2,3%
jedinica), uglavnom samo velikih poduzeća, gdje se primjenjuje izvještajna
metoda putem internetske aplikacija (tzv. CAWI), tj. izvještajne jedinice
neposredno ispunjavaju podatke na e-obrascu IND-2/KPS/M, koji se nalazi na
internetskim stranicama DZS-a http://www.dzs.hr/App/eUpitnik/default.aspx.
Rok prikupljanja podataka za izvještajne jedinice svakog se mjeseca po
pravilu kreće od 1. do 15. u mjesecu za podatke iz prethodnoga izvještajnog
mjeseca. Podaci izvještajnih jedinica koji se preuzimaju iz
administrativnog izvora (PDV) prikupljaju se 45 dana nakon izvještajnog
mjeseca, kada su raspoloživi u Poreznoj upravi i obrađuju u DZS-u za
statističke potrebe.
|
|
Therefore,
in 2016, a combined method of using two data sources has been used to
gather data: administrative source (97.7% of units) and statistical source
(2.3% of units), mostly large size enterprises where the reporting method
via a web-based application (the so-called CAWI) is used, i.e. where
reporting units fill in data directly on the IND
-2/KPS/M e-form, which is available on the web site of the CBS http://www.dzs.hr/App/eUpitnik/default.aspx.
The
time schedule for data collection for reporting units each month ranges, as
a rule, from 1st to 15th day in a month for data from
the previous reference month. Data on reporting units which are taken over
from administrative source (VAT) are collected 45 days after a reference
month, at which point they are available to the Tax authorities and for
further processing in the CBS for statistical purposes.
|
|
|
|
|
|
Definicije
varijabli
|
|
Definitions
of variables
|
|
|
|
|
|
Indeksi
prometa industrije jesu verižni indeksi izračunani iz vrijednosnih podataka
o prometu/prodaji industrije na razini glavne djelatnosti industrijskih
lokalnih jedinica koju je utvrdio Državni zavod za statistiku.
|
|
Industrial
turnover indices are chain indices calculated according to value data of
the industrial turnover/sales at the level of main activity of industrial
local units defined by the Croatian Bureau of Statistics.
|
|
|
|
|
|
Indeksi
su izračunani iz agregiranih podataka o vrijednosti prometa/ prodaje
industrije u izvještajnome mjesecu.
|
|
Indices
are calculated by aggregation of industrial turnover value data/ sales in
reporting month.
|
|
|
|
|
|
Metoda
kalkulacije
|
|
Calculation
method
|
|
|
|
|
|
Indeksi
prometa industrije za različite razine NKD-a 2007. izračunavaju se za
indekse skupina i više razine ponderiranjem s udjelom u vrijednosti prometa
(prodaje) industrije za utvrđene djelatnosti industrije prema NKD-u 2007.
za svaki pojedinačni pokazatelj. Tako se izračunavaju indeksi za agregate
GIG-a 2009.1) te indeksi za domaće i strano tržište, a prikazuju
se u nastavku teksta.
|
|
Indices
of industrial turnover for the different levels of NKD 2007 are calculated
for indices on group levels and higher by weighting with the share in value
of turnover (sales) for defined industrial activities according to NKD
2007. in respect with each indicator. Indices for MIGs 2009. aggregates1)
are calculated in the same way as well as indices for domestic and
non-domestic market. They are presented below.
|
|
|
|
|
|
Promet
industrije
|
|
Industrial
turnover
|
|
|
|
|
|
Vrijednost ukupnog
prometa,
tj. prihoda od prodaje, jest fakturirana vrijednost koju su ostvarile
industrijske lokalne jedinice tijekom izvještajnog mjeseca na temelju
prodaje proizvoda i usluga u izvještajnome mjesecu. Podudara se s tržišnom
vrijednosti prodanih dobara i usluga isporučenih trećim osobama na domaćemu
i stranom tržištu.
|
|
The
value of total industrial turnover that is, income
from sales is the invoiced value of reporting local units for the products
and services sold during the reference month. It corresponds to the market
value of goods and services sold and delivered to third parties on domestic
and non-domestic market in the reporting month.
|
|
|
|
|
|
U vrijednost
prihoda od prodaje (prometa) industrije uključeni su svi troškovi
transporta i pakiranja te svi porezi na fakturirana dobra i usluge
izvještajne jedinice osim poreza na dodanu vrijednost (PDV). Isključeni su
svi popusti i sniženja cijena te vrijednost vraćenih pakiranih
industrijskih proizvoda osim gotovinskih popusta. Također su isključeni
popusti, sniženja i bonusi koji se poslije odobravaju kupcima (npr. krajem
godine).
|
|
The
value of income from sales (turnover) in industry includes all transport
and packing costs as well as taxes on invoiced goods and services of the
reporting units except the value added tax (VAT). Excluded are all
reductions in prices, rebates and discounts as well as the value of
returned packed goods, except cash price reductions. Price reductions,
rebates and bonuses granted to customers later (e.g., at the end of the
year) are also excluded.
|
|
|
|
|
|
Vrijednost prometa
na domaćemu i stranom tržištu
|
|
The value of turnover on domestic and non-domestic market
|
|
|
|
|
|
Prihodom od
prodaje (prometa) proizvoda ili usluga trećim osobama koje su iz iste
države, tj. rezidenti Republike Hrvatske, smatra se prodaja na domaćem
tržištu. Prihodom od prodaje na stranom tržištu smatra se prodaja
nerezidentima Republike Hrvatske. Utvrđuje se prema kriteriju prve
destinacije proizvoda ili usluga te promjeni vlasništva (bez obzira na
fizički prelazak ili neprelazak granice proizvoda ili usluga za koje je
izdana faktura).
|
|
The
income from sales (turnover) of products and services to third parties
residing in the same country, that is, to residents of the Republic of
Croatia, is considered sale on domestic market, while sales on non-domestic
market is considered sales to non-residents of the Republic of Croatia
according to the criterion of the first destination of products or services
and change of owner (irrespective of whether the goods or services for
which the invoice was issued actually crossed the border or not).
|
|
|
|
|
|
Agregati
GIG-a 2009.
|
|
MIGs 2009. aggregates
|
|
|
|
|
|
Obračunavanje
agregata GIG-a 2009. za indekse prometa industrije izvršeno je grupiranjem
skupina ili odjeljaka NKD-a 2007. iz područja djelatnosti B i C (05.1 –
33.2) prema abecednim oznakama kratica na sljedeći način:
|
|
The
calculation of the MIGs 2009. aggregates was done by grouping of the NKD
2007. activities at the level of groups or divisions within sections B and
C (05.1 – 33.2) as follows, using alphabetic marks of abbreviations, was
done as follows:
|
|
|
|
|
|
Al
|
Intermedijarni proizvodi: odjeljci i skupine
NKD-a 2007.: 07 – 09, 10.6, 10.9, 13.1 – 13.3, 16, 17, 20.1 – 20.3, 20.5,
20.6, 22 – 24, 25.5 – 25.7, 25.9, 26.1, 26.8, 27.1 – 27.4 i 27.9
|
|
AI
|
Intermediate
goods: the NKD 2007. divisions and groups: 07 – 09, 10.6, 10.9, 13.1 –
13.3, 16, 17, 20.1 – 20.3, 20.5, 20.6, 22 – 24, 25.5 – 25.7, 25.9, 26.1,
26.8, 27.1 – 27.4 and 27.9
|
|
|
|
|
|
|
|
AE
|
Energija: odjeljci NKD-a 2007.: 05, 06 i 19
|
|
AE
|
Energy:
the NKD 2007. divisions: 05, 06 and 19
|
|
|
|
|
|
|
|
BB
|
Kapitalni proizvodi: odjeljci i skupine
NKD-a 2007.: 25.1 – 25.4, 26.2, 26.3, 26.5, 26.6, 28, 29, 30.1 – 30.4,
32.5 i 33
|
|
BB
|
Capital
goods: the NKD 2007. divisions and groups: 25.1 – 25.4, 26.2, 26.3, 26.5,
26.6, 28, 29, 30.1 – 30.4, 32.5 and 33
|
|
|
|
|
|
|
|
CD
|
Trajni
proizvodi za široku potrošnju: odjeljci i skupine NKD-a 2007.: 26.4, 26.7,
27.5, 30.9, 31, 32.1 i 32.2
|
|
CD
|
Consumer
durables: the NKD 2007. divisions and groups: 26.4, 26.7, 27.5, 30.9, 31,
32.1 and 32.2
|
|
|
|
|
|
|
|
CN
|
Netrajni proizvodi za široku potrošnju:
odjeljci i skupine NKD-a 2007.: 10.1 – 10.5, 10.7, 10.8, 11, 12, 13.9, 14,
15, 18, 20.4, 21, 32.3, 32.4 i 32.9.
|
|
CN
|
Consumer
non-durables: the NKD 2007. divisions and groups: 10.1 – 10.5, 10.7, 10.8,
11, 12, 13.9, 14, 15, 18, 20.4, 21, 32.3, 32.4 and 32.9.
|
|
|
|
|
|
Struktura
djelatnosti prema NKD-u 2007.
|
|
Weighting
activities structure by NKD 2007.
|
|
|
|
|
|
Za
Republiku Hrvatsku struktura industrijskih djelatnosti (struktura
odjeljaka) izračunana je za indeks prometa industrije iz vrijednosti
prodaje (prometa) industrije prema načelu čistih djelatnosti u 2014.
Izračunana je na temelju godišnjih statističkih rezultata Strukturno-
-poslovnog istraživanja za 2014. Državnog zavoda za statistiku obradom
godišnjih administrativnih podataka Fine – Godišnji računi industrijskih
poduzeća za 2014. te je ispravljena PRODCOM istraživanjem o industrijskoj
proizvodnji za 2014. i indeksima prometa industrije za 2015. Za
izračunavanje indeksa domaćega i stranog tržišta upotrebljava se struktura
izračunana na temelju PRODCOM istraživanja o industrijskoj proizvodnji za
2014. Struktura odjeljaka ažurira se na početku svake godine za
obračunavanje indeksa tekuće godine.
|
|
The
structure of industrial activities (division structure) has been calculated
or industrial turnover index on the basis of the value of turnover (sales)
by pure activity principle for the Republic of Croatia in 2014. It was
calculated on the basis of the 2014 annual statistical results of the
Structural Business Survey carried out by the Croatian Bureau of Statistics
by processing annual results taken over from administrative data of Fina –
the Annual Accounts of Industrial Enterprises in 2014. It was further
corrected by the results of the PRODCOM Survey on Industrial Production for
2014 and by industrial turnover indices for 2015. For the calculation of
domestic and non
-domestic market indices, the structure calculated on the basis of the
PRODCOM Survey on Industrial Production for 2014 is used. The division
structure is updated at the beginning of every year for the calculation of
indices of a current year.
|
|
|
|
|
|
Prezentacija
serija indeksa
|
|
Indices series presentation
|
|
|
|
|
|
Sezonsko i kalendarsko prilagođavanje provedeno je metodom X13
ARIMA na mjesečnoj seriji indeksa koja počinje indeksom za siječanj 2000.
za industriju ukupno i GIG 2009. prema posebnim grupacijama u odnosu na
pokrivenost NKD-a 2007. za svaki od pokazatelja. U
sezonskoj prilagodbi vremenskih serija indeksa isključen je utjecaj
slučajne sastavnice.
|
|
Seasonal and working-day adjustment has been done by
using the X13 ARIMA method on the monthly index series, which starts with
the January
2000 index for the total industry and for the MIGs 2009. in respect of NKD
2007. activity coverage of each of indicators. The
effect of a random component in the seasonal adjustment process of time
series of indices has been excluded.
|
|
|
|
|
|
Produljivanje serije indeksa dodavanjem novih mjesečnih
opažanja za svaki idući mjesec može zbog svojstava primijenjene metode
sezonske prilagodbe prouzročiti naknadne ispravke već objavljenih sezonski
i kalendarski prilagođenih indeksa te trenda za nekoliko mjeseci unatrag.
|
|
Due to the character of the implemented seasonal adjustment
method, the extension of the index series by adding new monthly
observations for each new month could cause subsequent corrections of the
already published seasonally and working-day adjusted indices and trend for
several previous months.
|
|
|
|
|
|
Sezonski
i kalendarski prilagođeni indeksi
|
|
Seasonally
and working-day adjusted indices
|
|
|
|
|
|
Pod pojmom "sezonski i kalendarski prilagođeni
indeksi" podrazumijeva se da su izvorni indeksi prilagođeni za sezonu
i kalendarske dane, u skladu sa zahtjevima Eurostata za kratkoročne
poslovne pokazatelje. Podaci koji se uspoređuju s podacima iz prethodnog
mjeseca (tj. mjesečna usporedba) prikazuju se u sezonski i kalendarski
prilagođenom obliku indeksa prometa industrije ili iz njih izračunanih
stopa rasta.
|
|
The term "seasonally and working-day adjusted"
indices is used to indicate that gross indices are adjusted for both
seasonal and working-day effects. In line with Eurostat’s requirements for
short-term business indicators, the data that are compared to those of the
previous month (that is, monthly comparison) are presented in a seasonally
and working-day adjusted form of industrial
turnover indices or theirs grows rates.
|
|
|
|
|
|
Kalendarski
prilagođeni indeksi
|
|
Working-day
adjusted indices
|
|
|
|
|
|
Pod
pojmom "kalendarski prilagođeni indeksi" podrazumijeva se da su
podaci prilagođeni za kalendarske dane. U skladu s Eurostatovim preporukama
i Uredbom Vijeća (EZ-a) br. 1165/98. podaci koji se uspoređuju s podacima
iz istog mjeseca prethodne godine (tzv. godišnja usporedba prema
Eurostatovoj terminologiji i praksi) prezentiraju se u kalendarski
prilagođenom obliku indeksa prometa industrije ili stopa rasta izračunanih
iz tih indeksa.
|
|
The
term working day adjusted indices indicate that data are adjusted only for
working-day effects. In line with the Eurostat’s Recommendations and the
Council Regulation No 1165/98, data that are compared to those of the same
month of a previous year (the so-
-called annual comparison according to the Eurostat’s terminology and
practice) are presented in a working-day adjusted form of industrial turnover indices or its grows rates.
|
|
|
|
|
|
Napomena korisnicima podataka
|
|
Note to users
|
|
|
|
|
|
Državni
zavod za statistiku promijenio je paket i metodu sezonske prilagodbe
vremenskih serija indeksa prometa industrije i drugih kratkoročnih
pokazatelja. Dosad se priimjenjivala metoda TRAMO-SEATS u programskom
paketu Demetra (verzija 2.2.). Od siječnja
2016. primjenjuje se nova metoda X13 ARIMA u novome programskom paketu
JDemetra+ (verzija 2.0.0. ili novije verzije nakon što budu službeno
dostupne). Zbog toga je nastala promjena već objavljenih sezonski i
kalendarski prilagođenih vrijednosti i pripadajućih stopa promjena na
cijelim vremenskim serijama.
|
|
The
Croatian Bureau of Statistics has changed the package and the method of
seasonal adjustment of industrial turnover time series of indices and other
short-term indicators. Up until now, the TRAMO-SEATS method was used in the
Demetra (version 2.2.) package. Since January 2016, the new X13 ARIMA
method in the new JDemetra+ (version 2.0.0. or newer version after they
have been officially available) package has been used. Due to this, there
was a change in the already published seasonal and working-day adjusted
values and corresponding change rates on whole time series.
|
|
|
|
|
|
Dodatne
informacije potražite u priopćenju za javnost u povodu uvođenja novog
načina sezonske prilagodbe vremenskih serija Državnog zavoda za statistiku,
koje je objavljeno na internetskim stranicama Državnog zavoda za statistiku
www.dzs.hr.
|
|
Additional
information can be found in the press release of the Croatian Bureau of
Statistics concerning the introduction of a new method of seasonal
adjustment of time series, which was published on the web pages of the
Croatian Bureau of Statistics at www.dzs.hr.
|
|
|
|
|
|
|
|
|
|
1)
|
Uredba Komisije (EZ-a) br. 656/07. od 14. lipnja
2007. o provedbi Uredbe Vijeća (EZ-a)
br. 1165/98. o kratkoročnim statistikama u vezi s definicijama Glavnih
industrijskih grupacija (GIG)
|
|
1)
|
Commission
Regulation (EC) No 656/07 of 14 June 2007 on Implementing Council
Regulation (EC) No 1165/98 concerning short-term statistics as regards to
the definitions of Main Industrial Groupings (MIGs).
|
|
|
|
|
|
|
|
|
|
Kratice
|
|
Abbreviations
|
|
|
|
|
|
CAWI
|
razmjena
podataka internetom uz računalnu podršku
|
|
CAWI
|
computer-assisted
web interviewing
|
|
Eurostat
|
Statistički
ured Europske unije
|
|
EC
|
European Community
|
|
EU
|
Europska
unija
|
|
EU
|
European Union
|
|
EZ
|
Europska
zajednica
|
|
Eurostat
|
Statistical Office
of the European Communities
|
|
Fina
|
Financijska
agencija
|
|
Fina
|
Financial Agency
|
|
GIG
2009.
|
Glavne
industrijske grupacije, verzija 2009.
|
|
MIGs
2009.
|
Main Industrial
Groupings, 2009 version
|
|
NKD
2007.
NN
|
Nacionalna
klasifikacija djelatnosti, verzija 2007.
Narodne
novine
|
|
NKD 2007.
NN
|
National Classification of Activities, 2007 version
Narodne novine, official gazette of
the Republic of Croatia
|
|
|
|
|
|
|
|
|
|
|
|
|
|
|
|
|
|
|
|

|
|
|
|
|
U ovom Priopćenju
objavljuju se podaci istraživanja koje je provedeno uz financijsku pomoć
Europske unije. Za njegov sadržaj odgovoran je isključivo Državni zavod za
statistiku te ni u kojem slučaju ne izražava stav Europske unije.
|
|
The survey whose
data are published in this First Release has been conducted with the
financial assistance of the European Union. The contents of this document
are the sole responsibility of the Croatian Bureau of Statistics and can
under no circumstances be regarded as reflecting the position of the
European Union.
|
Objavljuje
i tiska Državni zavod za statistiku Republike Hrvatske, Zagreb, Ilica 3, p.
p. 80.
Published and printed by the Croatian
Bureau of Statistics, Zagreb, Ilica 3, P. O. B. 80
Telefon/ Phone:
+385 (0) 1 4806-111, telefaks/ Fax: +385 (0) 1 4817-666
Odgovara
ravnatelj Marko Krištof.
Person
responsible: Marko Krištof, Director General
Priredili:
Jasna Pugar, Ivana Zoroja i Mustafa Elezović
Prepared
by: Jasna Pugar, Ivana Zoroja and Mustafa Elezović
Sezonska
i kalendarska prilagodba – priredio: Mladen Krulik
Seasonal
and working-day adjustment – prepared by: Mladen Krulik
|
|
MOLIMO KORISNIKE DA PRI
KORIŠTENJU PODATAKA NAVEDU IZVOR.
USERS
ARE KINDLY REQUESTED TO STATE THE SOURCE.
|
|
Naklada:
20 primjeraka
20 copies
printed
Podaci iz
ovog priopćenja objavljuju se i na internetu.
First
Release data are also published on the Internet.
|