|

GODINA/ YEAR: LVI. ZAGREB,
24. SVIBNJA 2019./ 24 MAY, 2019 BROJ/
NUMBER: 4.2.2.
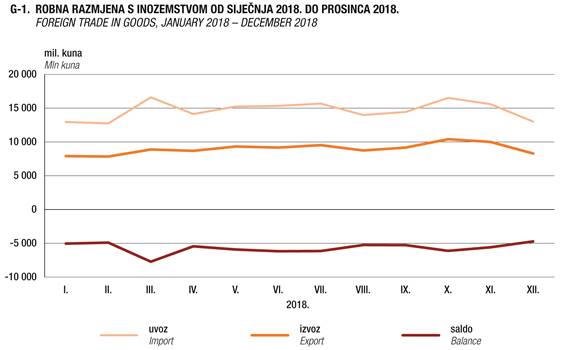
ROBNA RAZMJENA REPUBLIKE HRVATSKE S INOZEMSTVOM U 2018.
KONAČNI PODACI
FOREIGN TRADE IN GOODS OF
THE REPUBLIC OF CROATIA, 2018
FINAL DATA
|
Konačni
podaci Državnog zavoda za statistiku o robnoj razmjeni s inozemstvom u
2018. i dalje pokazuju porast izvoza i uvoza Republike Hrvatske.
|
|
Final
results of the Croatian Bureau of Statistics on foreign trade in goods
continue to show an increase in both export and import of the Republic of
Croatia in 2018.
|
|
|
|
|
|
Porast
izvoza, uvoza i vanjskotrgovinskog deficita, dok je pokrivenost uvoza
izvozom u padu
|
|
Increase
in export, import and foreign trade deficit, while coverage of import by
export falls
|
|
|
|
|
|
Prema
konačnim podacima robne razmjene Republike Hrvatske s inozemstvom, u 2018.
u usporedbi s 2017. zabilježen je daljnji
porast izvoza i uvoza kao i vanjskotrgovinskog deficita te pad pokrivenosti
uvoza izvozom.
|
|
Final
data on the foreign trade in goods in the Republic of Croatia show that
export and import as well as foreign trade deficit kept increasing and
coverage of import by export decreased in 2018, as compared to 2017.
|
|
|
|
|
|
Ukupan
izvoz Republike Hrvatske u 2018. iznosio je oko 108 milijardi kuna, što je
u usporedbi s 2017. povećanje za oko 3 milijarde kuna, odnosno za oko 3%.
Ukupan je uvoz istodobno iznosio oko 176 milijardi kuna i povećao se za oko
13 milijardi kuna, odnosno veći je za oko 8% u usporedbi s 2017.
|
|
Total
export of the Republic of Croatia amounted to approximately 108 billion kuna in 2018, which was a
growth of about 3 billion kuna, or 3%, compared to 2017. At the same time,
total import was approximately 176 billion kuna, which was a growth of
about 13 billion kuna, or about 8%, compared to 2017.
|
|
|
|
|
|
Deficit robne razmjene s inozemstvom u 2018. iznosio
je oko 68 milijardi kuna te je porastao za oko 16%, odnosno veći je za
oko 10 milijardi kuna u odnosu na 2017. Zbog snažnijeg rasta uvoza u
odnosu na izvoz pokrivenost uvoza izvozom iznosila je oko 61% u 2018. te
je smanjena u odnosu na 2017., kad je iznosila 64%.
|
|
Foreign
trade deficit amounted in 2018 to approximately 68 billion kuna, which was
10 billion kuna, or 16%, more than in 2017. Due to the substantial increase
in import compared to export, the coverage of import by export accounted
for 61% in 2018, which was a decrease in relation to the year before, when
it had accounted for 64%.
|
|
Najveći
utjecaj na porast izvoza i uvoza imala Prerađivačka industrija
|
|
Manufacturing
contributed most to the increase of export and import
|
|
|
|
|
|
Prerađivačka
industrija, s udjelom u ukupnom izvozu od oko 90% u 2018. ostvarila je
porast izvoza za oko 4% i time je najviše utjecala na porast ukupnog izvoza
Republike Hrvatske.
|
|
Manufacturing,
which participated with 90% in total export in 2018, realised a growth of
about 4% of export and thus contributed most to the increase in the total
export of the Republic of Croatia.
|
|
|
|
|
|
Proizvodnja
koksa i rafiniranih naftnih proizvoda, kao dio Prerađivačke industrije,
sudjelovala je u ukupnom izvozu s oko 8% i ostvarila je najveći doprinos
porastu izvoza, i to s oko 18%.
|
|
Manufacture
of coke and refined petroleum products, as a part of Manufacturing,
participated in total export with about 8% and contributed most to the
increase in export, with as much as 18%.
|
|
|
|
|
|
Na
povećanje izvoza znatan utjecaj imala je i Proizvodnja motornih vozila,
prikolica i poluprikolica, s udjelom od oko 5% u ukupnom izvozu i porastom
izvoza za oko 22%.
|
|
In
addition, Manufacture of motor vehicles, trailers and semi-trailers had
also a significant impact on the growth of export, with approximately 5% in
total export and with 22% of export increase.
|
|
|
|
|
|
Porastu
uvoza u 2018. isto tako najviše je pridonijela Prerađivačka industrija, s
udjelom od oko 87% u ukupnom uvozu i povećanjem uvoza za oko 8% u odnosu na
2017.
|
|
Manufacturing,
with the participation of about 87% in total import and with import
increase of about 8%, also contributed most to an increase in import in
2018, as compared to the year before.
|
|
|
|
|
|
Proizvodnja
motornih vozila, prikolica i poluprikolica, kao dio Prerađivačke
industrije, s udjelom od oko 8% u ukupnom uvozu, najviše je pridonijela
povećanju uvoza, i to za oko 18% u odnosu na 2017.
|
|
Manufacture
of motor vehicles, trailers and semi-trailers, as a part of Manufacturing,
with a share of about 8% in total import, contributed most to an increase
in import, by as much as about 18% compared to 2017.
|
|
|
|
|
|
Znatan
doprinos povećanju uvoza imala je i Proizvodnja kemikalija i kemijskih
proizvoda, s udjelom od oko 8% u ukupnom uvozu i porastom za oko 13%.
|
|
In
addition, Manufacture of chemicals and chemical products also had a
substantial impact on the increase in import, with a share of approximately
8% in total import and with about 13% of import increase.
|
|
|
|
|
|
Strojevi
i prijevozna sredstva već uobičajeno ostvaruju gotovo četvrtinu vrijednosti
ukupnog izvoza i uvoza
|
|
Machinery
and transport equipment sector keeps generating almost a quarter of total
export and import value
|
|
|
|
|
|
Sektor
Strojevi i prijevozna sredstva ostvaruju najveću vrijednost odnosno čine
gotovo četvrtinu ukupnog izvoza i uvoza Republike Hrvatske prema
Standardnoj međunarodnoj trgovinskoj klasifikaciji (SMTK-u). U 2018. izvoz
tog sektora iznosio je nešto više od
25 milijardi kuna i činio je nešto više od 23% ukupnoga hrvatskog izvoza.
Uvoz je u istom razdoblju iznosio oko 47 milijardi kuna odnosno više od 26%
ukupnog uvoza Republike Hrvatske.
|
|
According
to the Standard International Trade Classification (SITC), the highest
value of export and import, i.e. almost a quarter of the total export and
import of the Republic of Croatia, was generated in the Machinery and
transport equipment sector. In 2018, export in that sector amounted to a
little more than 25 billion kuna, which slightly exceeds 23% of the total
Croatian export. In the same period, import amounted to approximately 47
billion kuna, i.e. more than 26% of the total Croatian import.
|
|
|
|
|
|
Njemačka,
Italija i Slovenija standardno najvažniji trgovinski partneri iz EU-a
|
|
Germany,
Italy and Slovenia remain the most important foreign trade partners within
EU
|
|
|
|
|
|
Robna
razmjena Republike Hrvatske s tržištem EU-a znatno raste svake godine te je
u 2018. činila gotovo 69% ukupnog izvoza, koji je u odnosu na 2017.
porastao za oko 9%, te oko 78% ukupnog uvoza, koji je porastao za 8% u
odnosu na 2017.
|
|
The
trade in goods of the Republic of Croatia with EU Member States keeps
growing every year and in 2018 it accounted for almost 69% of the total
export, which grew by approximately 9% compared to the year before, and for
about 78% of the total import, which grew by 8% compared to 2017.
|
|
|
|
|
|
Najveći
su vanjskotrgovinski partneri iz EU-a u 2018. bili Njemačka, Italija i
Slovenija.
|
|
Italy,
Germany and Slovenia were the biggest foreign trade partners within EU in
2018.
|
|
|
|
|
|
S
udjelom od gotovo 15% ukupnog izvoza, Italija je zemlja partner u koju je
izvezeno najviše robe u 2018., i to oko 10% više u odnosu na 2017.
|
|
Italy,
participating with a share of almost 15% of total export, is a partner
country with which the biggest export in 2018 was realised, about 10% more
compared to 2017.
|
|
|
|
|
|
U
ukupnome hrvatskom uvozu u 2018. udio uvoza robe iz Njemačke iznosio je više
od 15%, što je porast od oko 7% u odnosu na 2017. Njemačka je za većinu
država članica EU-a, prema privremenim podacima Eurostata, država u koju se
u 2018. najviše izvozilo, ali i iz koje se najviše uvozilo robe.
|
|
Within
the total Croatian import in 2018, the share of the import from Germany
exceeded 15%, which represented an increase of about 7% compared to 2017.
For the majority EU Member States, according to Eurostat’s provisional
data, Germany was a country with the largest percentage of export and
import in 2018.
|
|
|
|
|
|
Slovenija
je redovito jedna od najvažnijih zemalja partnera u ukupnoj robnoj razmjeni
Republike Hrvatske, pa je tako u 2018. izvoz kao i uvoz iz susjedne nam
države činio gotovo 11% ukupnog izvoza i uvoza. U 2018. izvoz u Sloveniju
porastao je za oko 6%, a uvoz je bio oko 12% veći u odnosu na 2017.
|
|
Slovenia
remained one of the most important partner countries in the total trade in
goods of the Republic of Croatia in 2018 as well, with a share of almost
11% in both total export and total import. In 2018, export to Slovenia
increased by about 6% and import by about 12% compared to the year before.
|
|
|
|
|
|
Bosna i Hercegovina i dalje najvažnije izvozno
tržište izvan EU-a
|
|
Bosnia
and Herzegovina remained the most important export market outside EU
|
|
|
|
|
|
Robna
razmjena s trećim zemljama u 2018. činila je oko 31% ukupnog
izvoza, koji je zabilježio pad za oko 8%, i gotovo 22% ukupnog uvoza, koji
je porastao za oko 8% u usporedbi s 2017.
|
|
The
foreign trade in goods with non-EU Member States accounted for
approximately 31% of total export in 2018, which fell by around 8%, and for
almost 22% of total import, which grew by approximately 8%, as compared to
2017.
|
|
|
|
|
|
Najveći
vanjskotrgovinski partneri izvan EU-a s kojima je Republika Hrvatska ostvarila robnu
razmjenu u 2018. i nadalje su bili Bosna i Hercegovina, Srbija te Kina. U
2018. oko 9% ukupnoga hrvatskog izvoza ostvareno je u Bosni i
Hercegovini koji je na razini 2017., dok je uvoz porastao za oko 6%.
|
|
The
biggest partner countries in foreign trade in goods outside EU, with whom
the Republic of Croatia realised trade in goods in 2018, were again Bosnia
and Herzegovina, Serbia and China. Almost 9% of the total Croatian export
in 2018 was realised with Bosnia and Herzegovina, which remained at the
same level as in 2017, while import went up by about 6%.
|
|
|
|
|
|
Gdje je
Republika Hrvatska u EU?
|
|
What is the position of the Republic of Croatia in
EU?
|
|
|
|
|
|
Republika Hrvatska nalazi se među prvih pet država
članica EU-a koje realiziraju više od tri četvrtine svog uvoza iz drugih
država članica EU-a.
|
|
The Republic of Croatia is among first five EU Member
States that generate more than three quarters of their import from other EU
Member States.
|
1. ROBNA RAZMJENA REPUBLIKE HRVATSKE S
INOZEMSTVOM
FOREIGN
TRADE IN GOODS OF THE REPUBLIC OF CROATIA
|
|
Izvoz
Export
|
Uvoz
Import
|
Saldo robne razmjene
Balance
of foreign trade in goods
|
Pokrivenost
uvoza
izvozom, %
Coverage
of import
by export, %
|
|
|
tis. kuna
Thousand
kuna
|
tis. eura
Thousand
euros
|
tis. USD
Thousand
US
$
|
tis. kuna
Thousand
kuna
|
tis. eura
Thousand
euros
|
tis. USD
Thousand
US
$
|
tis. kuna
Thousand
kuna
|
tis. eura
Thousand
euros
|
tis. USD
Thousand
US
$
|
|
|
|
|
|
|
|
|
|
|
|
|
|
2017.
|
|
|
|
|
|
|
|
|
|
|
|
I.
|
7 563 629
|
1 002 133
|
1 047 557
|
11 346 647
|
1 502 280
|
1 572 256
|
-3 783 018
|
-500 148
|
-524 699
|
66,7
|
|
II.
|
8 220 089
|
1 096 978
|
1 173 274
|
12 556 849
|
1 677 773
|
1 794 877
|
-4 336 760
|
-580 795
|
-621 603
|
65,5
|
|
III.
|
9 561 337
|
1 285 875
|
1 371 668
|
15 264 303
|
2 053 747
|
2 194 723
|
-5 702 967
|
-767 872
|
-823 055
|
62,6
|
|
IV.
|
7 359 269
|
990 393
|
1 061 108
|
13 369 848
|
1 798 020
|
1 923 605
|
-6 010 579
|
-807 627
|
-862 497
|
55,0
|
|
V.
|
8 924 641
|
1 196 827
|
1 299 849
|
14 888 800
|
1 995 420
|
2 172 266
|
-5 964 160
|
-798 593
|
-872 417
|
59,9
|
|
VI.
|
8 652 719
|
1 166 395
|
1 304 503
|
13 935 989
|
1 879 080
|
2 101 937
|
-5 283 270
|
-712 685
|
-797 434
|
62,1
|
|
VII.
|
8 559 950
|
1 155 485
|
1 307 217
|
14 312 554
|
1 932 065
|
2 192 188
|
-5 752 605
|
-776 580
|
-884 971
|
59,8
|
|
VIII.
|
8 140 521
|
1 098 602
|
1 280 470
|
12 789 488
|
1 726 167
|
2 017 336
|
-4 648 967
|
-627 564
|
-736 866
|
63,7
|
|
IX.
|
8 971 646
|
1 211 959
|
1 434 982
|
14 331 619
|
1 935 713
|
2 294 130
|
-5 359 973
|
-723 754
|
-859 149
|
62,6
|
|
X.
|
9 750 362
|
1 302 091
|
1 545 421
|
14 160 570
|
1 890 216
|
2 238 576
|
-4 410 209
|
-588 125
|
-693 155
|
68,9
|
|
XI.
|
10 150 256
|
1 351 581
|
1 577 764
|
13 845 975
|
1 843 331
|
2 148 755
|
-3 695 720
|
-491 751
|
-570 991
|
73,3
|
|
XII.
|
8 746 539
|
1 158 626
|
1 367 178
|
12 510 483
|
1 657 836
|
1 958 082
|
-3 763 944
|
-499 210
|
-590 904
|
69,9
|
|
I. – XII.
|
104 600 956
|
14 016 945
|
15 770 991
|
163 313 126
|
21 891 649
|
24 608 732
|
-58 712 170
|
-7 874 704
|
-8 837 741
|
64,0
|
|
|
|
|
|
|
|
|
|
|
|
|
|
2018.
|
|
|
|
|
|
|
|
|
|
|
|
I.
|
7 905 897
|
1 051 124
|
1 255 484
|
12 950 722
|
1 722 326
|
2 058 992
|
-5 044 826
|
-671 202
|
-803 509
|
61,0
|
|
II.
|
7 839 060
|
1 056 405
|
1 310 967
|
12 740 071
|
1 717 366
|
2 133 553
|
-4 901 011
|
-660 962
|
-822 586
|
61,5
|
|
III.
|
8 882 877
|
1 193 551
|
1 462 241
|
16 603 428
|
2 230 615
|
2 730 404
|
-7 720 551
|
-1 037 064
|
-1 268 163
|
53,5
|
|
IV.
|
8 682 962
|
1 168 619
|
1 439 828
|
14 128 143
|
1 901 311
|
2 342 179
|
-5 445 181
|
-732 692
|
-902 351
|
61,5
|
|
V.
|
9 323 238
|
1 257 535
|
1 533 634
|
15 243 620
|
2 055 982
|
2 502 159
|
-5 920 382
|
-798 448
|
-968 525
|
61,2
|
|
VI.
|
9 162 944
|
1 241 650
|
1 450 856
|
15 337 822
|
2 078 072
|
2 423 240
|
-6 174 878
|
-836 422
|
-972 384
|
59,7
|
|
VII.
|
9 528 611
|
1 291 654
|
1 500 282
|
15 675 295
|
2 124 667
|
2 469 842
|
-6 146 684
|
-833 013
|
-969 560
|
60,8
|
|
VIII.
|
8 733 158
|
1 182 604
|
1 386 696
|
13 985 310
|
1 893 577
|
2 220 090
|
-5 252 152
|
-710 973
|
-833 395
|
62,4
|
|
IX.
|
9 164 702
|
1 234 398
|
1 434 802
|
14 436 363
|
1 944 154
|
2 261 378
|
-5 271 661
|
-709 757
|
-826 576
|
63,5
|
|
X.
|
10 404 427
|
1 401 834
|
1 630 922
|
16 520 866
|
2 225 907
|
2 588 788
|
-6 116 440
|
-824 073
|
-957 866
|
63,0
|
|
XI.
|
9 995 946
|
1 346 085
|
1 531 493
|
15 585 163
|
2 098 679
|
2 385 504
|
-5 589 217
|
-752 594
|
-854 011
|
64,1
|
|
XII.
|
8 289 618
|
1 117 968
|
1 273 265
|
13 008 923
|
1 754 900
|
1 996 960
|
-4 719 305
|
-636 932
|
-723 695
|
63,7
|
|
I. – XII.
|
107 913 440
|
14 543 427
|
17 210 469
|
176 215 726
|
23 747 557
|
28 113 089
|
-68 302 286
|
-9 204 130
|
-10 902 620
|
61,2
|
I. ROBNA RAZMJENA REPUBLIKE HRVATSKE S
INOZEMSTVOM U KUNAMA
FOREIGN
TRADE IN GOODS OF THE REPUBLIC OF CROATIA, KUNA
1. IZVOZ I UVOZ PREMA NKD-u 2007.
EXPORT
AND IMPORT, ACCORDING TO NKD 2007.
tis.
kuna
Thousand
kuna
|
|
|
|
Izvoz
Export
|
Uvoz
Import
|
|
|
|
|
|
|
|
I. – XII. 2017.
|
I. – XII. 2018.
|
indeksi
Indices
I. – XII. 2018.
I. – XII. 2017.
|
I. – XII. 2017.
|
I. – XII. 2018.
|
indeksi
Indices
I. – XII. 2018.
I. – XII. 2017.
|
|
|
|
|
|
|
|
|
|
|
|
|
|
|
|
|
|
|
|
Ukupno
|
104 600 956
|
107 913 440
|
103,2
|
163 313 126
|
176 215 726
|
107,9
|
|
|
Total
|
|
|
|
|
|
|
|
|
|
|
|
|
|
|
A
|
|
Poljoprivreda,
šumarstvo i
ribarstvo
|
4 958 413
|
5 167 797
|
104,2
|
4 709 425
|
5 008 582
|
106,4
|
A
|
|
Agriculture,
forestry and fishing
|
|
|
|
|
|
|
|
|
|
|
|
|
|
|
B
|
|
Rudarstvo i
vađenje
|
668 678
|
711 904
|
106,5
|
10 453 202
|
12 678 736
|
121,3
|
B
|
|
Mining and quarrying
|
|
|
|
|
|
|
|
|
|
|
|
|
|
|
C
|
|
Prerađivačka
industrija
|
93 087 620
|
96 928 511
|
104,1
|
142 321 310
|
153 143 772
|
107,6
|
C
|
|
Manufacturing
|
|
|
10
|
Proizvodnja prehrambenih
proizvoda
|
8 060 096
|
8 502 191
|
105,5
|
15 203 557
|
15 521 781
|
102,1
|
|
10
|
Manufacture of food products
|
|
|
11
|
Proizvodnja
pića
|
1 144 217
|
1 194 617
|
104,4
|
1 488 348
|
1 687 760
|
113,4
|
|
11
|
Manufacture of beverages
|
|
|
12
|
Proizvodnja
duhanskih proizvoda
|
667 618
|
911 673
|
136,6
|
561 196
|
568 114
|
101,2
|
|
12
|
Manufacture of tobacco products
|
|
|
13
|
Proizvodnja
tekstila
|
1 253 826
|
1 325 777
|
105,7
|
3 284 625
|
3 346 270
|
101,9
|
|
13
|
Manufacture of textiles
|
|
|
14
|
Proizvodnja
odjeće
|
5 108 763
|
5 146 483
|
100,7
|
7 412 844
|
7 935 010
|
107,0
|
|
14
|
Manufacture of wearing apparel
|
|
|
15
|
Proizvodnja
kože i srodnih proizvoda
|
3 258 103
|
3 238 081
|
99,4
|
4 801 192
|
4 586 721
|
95,5
|
|
15
|
Manufacture of leather and related products
|
|
|
16
|
Prerada
drva i proizvoda od drva
i pluta, osim namještaja;
proizvodnja proizvoda od
slame i pletarskih materijala
|
4 815 108
|
5 246 861
|
109,0
|
2 259 116
|
2 508 355
|
111,0
|
|
16
|
Manufacture of wood and of products of wood and cork, except
furniture; manufacture of articles of straw and plaiting materials
|
|
|
17
|
Proizvodnja
papira i proizvoda
od papira
|
1 801 659
|
1 949 342
|
108,2
|
3 621 464
|
3 884 741
|
107,3
|
|
17
|
Manufacture of paper and paper products
|
|
|
18
|
Tiskanje i
umnožavanje snimljenih zapisa
|
13 047
|
14 902
|
114,2
|
20 232
|
14 011
|
69,3
|
|
18
|
Printing and reproduction of recorded media
|
|
|
19
|
Proizvodnja
koksa i rafiniranih naftnih proizvoda
|
7 612 605
|
8 963 613
|
117,7
|
6 716 012
|
7 131 114
|
106,2
|
|
19
|
Manufacture of coke and refined petroleum products
|
|
|
20
|
Proizvodnja
kemikalija i kemijskih proizvoda
|
5 434 258
|
5 904 507
|
108,7
|
12 354 915
|
13 947 931
|
112,9
|
|
20
|
Manufacture of chemicals and chemical products
|
|
|
21
|
Proizvodnja osnovnih farmaceutskih
proizvoda i farmaceutskih pripravaka
|
8 587 160
|
6 915 770
|
80,5
|
8 371 515
|
8 919 380
|
106,5
|
|
21
|
Manufacture
of basic pharmaceutical products and pharmaceutical preparations
|
|
|
22
|
Proizvodnja proizvoda od gume i
plastike
|
2 966 231
|
3 295 890
|
111,1
|
6 670 649
|
7 221 890
|
108,3
|
|
22
|
Manufacture
of rubber and plastic products
|
|
|
23
|
Proizvodnja ostalih nemetalnih
mineralnih proizvoda
|
3 368 145
|
3 656 486
|
108,6
|
2 934 783
|
3 312 059
|
112,9
|
|
23
|
Manufacture
of other non-metallic mineral products
|
|
|
24
|
Proizvodnja metala
|
2 947 624
|
3 760 508
|
127,6
|
9 124 671
|
9 780 012
|
107,2
|
|
24
|
Manufacture
of basic metals
|
|
|
25
|
Proizvodnja gotovih metalnih
proizvoda, osim strojeva i opreme
|
7 122 585
|
7 068 512
|
99,2
|
6 064 049
|
6 254 235
|
103,1
|
|
25
|
Manufacture
of fabricated metal products, except machinery and equipment
|
|
|
26
|
Proizvodnja računala te
elektroničkih i optičkih proizvoda
|
3 452 122
|
3 535 078
|
102,4
|
9 855 683
|
10 384 513
|
105,4
|
|
26
|
Manufacture
of computer, electronic and optical products
|
|
|
27
|
Proizvodnja električne opreme
|
7 132 827
|
7 097 337
|
99,5
|
7 620 705
|
9 041 372
|
118,6
|
|
27
|
Manufacture
of electrical equipment
|
|
|
28
|
Proizvodnja strojeva i uređaja,
d. n.
|
7 317 701
|
7 570 217
|
103,5
|
13 334 455
|
13 643 648
|
102,3
|
|
28
|
Manufacture
of machinery and equipment n. e. c.
|
|
|
29
|
Proizvodnja motornih vozila,
prikolica i poluprikolica
|
4 020 239
|
4 916 063
|
122,3
|
11 626 428
|
13 677 210
|
117,6
|
|
29
|
Manufacture
of motor vehicles, trailers and semi-trailers
|
|
|
30
|
Proizvodnja ostalih prijevoznih
sredstava
|
2 927 632
|
2 888 722
|
98,7
|
1 983 385
|
2 489 245
|
125,5
|
|
30
|
Manufacture
of other transport equipment
|
|
|
31
|
Proizvodnja namještaja
|
2 449 172
|
1 999 177
|
81,6
|
2 306 252
|
2 590 386
|
112,3
|
|
31
|
Manufacture
of furniture
|
|
|
32
|
Ostala prerađivačka industrija
|
1 626 880
|
1 826 709
|
112,3
|
4 705 233
|
4 698 016
|
99,8
|
|
32
|
Other
manufacturing
|
|
|
|
|
|
|
|
|
|
|
|
|
|
|
D
|
|
Opskrba
električnom energijom, plinom, parom i klimatizacija
|
3 112 688
|
1 931 594
|
62,1
|
4 739 494
|
4 098 109
|
86,5
|
D
|
|
Electricity, gas, steam and air conditioning supply
|
|
|
|
|
|
|
|
|
|
|
|
|
|
|
E
|
|
Opskrba vodom;
uklanjanje otpadnih voda, gospodarenje otpadom te djelatnosti sanacije
okoliša
|
2 096 958
|
2 234 106
|
106,5
|
493 800
|
648 094
|
131,2
|
E
|
|
Water supply; sewerage, waste management and remediation activities
|
|
|
|
|
|
|
|
|
|
|
|
|
|
|
J
|
|
Informacije
i komunikacije
|
482 100
|
504 086
|
104,6
|
569 402
|
612 131
|
107,5
|
J
|
|
Information and communication
|
|
|
|
|
|
|
|
|
|
|
|
|
|
|
M
|
|
Stručne,
znanstvene i tehničke djelatnosti
|
233
|
152
|
65,0
|
779
|
576
|
74,0
|
M
|
|
Professional, scientific and technical activities
|
|
|
|
|
|
|
|
|
|
|
|
|
|
|
R
|
|
Umjetnost,
zabava i rekreacija
|
2 681
|
4 776
|
178,2
|
2 579
|
2 614
|
101,4
|
R
|
|
Arts, entertainment and recreation
|
|
|
|
|
|
|
|
|
|
|
|
|
|
|
|
|
Neraspoređeno
|
191 585
|
430 513
|
224,7
|
23 134
|
23 110
|
99,9
|
|
|
Not classified
|
2. IZVOZ I UVOZ PO SEKTORIMA SMTK
EXPORT
AND IMPORT, ACCORDING TO SITC SECTIONS
tis.
kuna
Thousand
kuna
|
|
|
Izvoz
Export
|
Uvoz
Import
|
|
|
|
|
|
I. – XII. 2017.
|
I. – XII. 2018.
|
indeksi
Indices
I. – XII. 2018.
I. – XII. 2017.
|
I. – XII. 2017.
|
I. – XII. 2018.
|
indeksi
Indices
I. – XII. 2018.
I. – XII. 2017.
|
|
|
|
|
|
|
|
|
|
|
|
|
|
|
|
Ukupno
|
104 600 956
|
107 913 440
|
103,2
|
163 313 126
|
176 215 726
|
107,9
|
|
Total
|
|
|
|
|
|
|
|
|
|
|
|
|
0
|
Hrana i žive životinje
|
10 431 116
|
11 268 684
|
108,0
|
17 962 278
|
18 393 407
|
102,4
|
0
|
Food and
live animals
|
|
1
|
Pića i duhan
|
1 866 995
|
2 216 318
|
118,7
|
2 220 340
|
2 501 576
|
112,7
|
1
|
Beverages
and tobacco
|
|
2
|
Sirove materije, osim goriva
|
7 987 139
|
8 149 835
|
102,0
|
2 933 600
|
3 402 849
|
116,0
|
2
|
Crude materials,
except fuels
|
|
3
|
Mineralna goriva i maziva
|
11 115 835
|
11 408 612
|
102,6
|
21 612 335
|
23 910 044
|
110,6
|
3
|
Mineral
fuels and lubricants
|
|
4
|
Životinjska i biljna ulja i masti
|
449 721
|
483 180
|
107,4
|
740 024
|
705 812
|
95,4
|
4
|
Animal and
vegetable oils and fats
|
|
5
|
Kemijski proizvodi
|
14 760 103
|
13 669 774
|
92,6
|
22 639 326
|
24 533 705
|
108,4
|
5
|
Chemical
products
|
|
6
|
Proizvodi svrstani prema materijalu
|
16 899 324
|
18 276 655
|
108,2
|
29 185 373
|
30 675 846
|
105,1
|
6
|
Manufactured
goods classified chiefly by material
|
|
7
|
Strojevi i prijevozna sredstva
|
24 435 771
|
25 344 318
|
103,7
|
41 955 409
|
46 686 563
|
111,3
|
7
|
Machinery
and transport equipment
|
|
8
|
Razni gotovi proizvodi
|
16 213 182
|
16 381 206
|
101,0
|
23 934 382
|
25 257 465
|
105,5
|
8
|
Miscellaneous
manufactured articles
|
|
9
|
Proizvodi i transakcije,
d. n.
|
250 185
|
284 345
|
113,7
|
106 926
|
125 348
|
117,2
|
9
|
Commodities
and transactions,
n. e. s.
|
|
|
Neraspoređeno
|
191 585
|
430 513
|
224,7
|
23 134
|
23 110
|
99,9
|
|
Not
classified
|
3. IZVOZ I UVOZ PREMA EKONOMSKIM GRUPACIJAMA
ZEMALJA
EXPORT
AND IMPORT, ACCORDING TO ECONOMIC CLASSIFICATION OF COUNTRIES
tis.
kuna
Thousand
kuna
|
|
Izvoz
Export
|
Uvoz
Import
|
|
|
|
I. – XII. 2017.
|
I. – XII. 2018.
|
indeksi
Indices
I. – XII. 2018.
I. – XII. 2017.
|
I. – XII. 2017.
|
I. – XII. 2018.
|
indeksi
Indices
I. – XII. 2018.
I. – XII. 2017.
|
|
|
|
|
|
|
|
|
|
|
|
Ukupno
|
104 600 956
|
107 913 440
|
103,2
|
163 313 126
|
176 215 726
|
107,9
|
Total
|
|
|
|
|
|
|
|
|
|
|
Države članice EU-a
|
67 866 858
|
74 188 818
|
109,3
|
127 496 309
|
137 652 204
|
108,0
|
EU member
states
|
|
|
|
|
|
|
|
|
|
|
Austrija
|
6 552 044
|
6 958 129
|
106,2
|
12 358 923
|
12 142 938
|
98,3
|
Austria
|
|
Belgija
|
1 793 966
|
1 935 200
|
107,9
|
3 501 322
|
2 890 099
|
82,5
|
Belgium
|
|
Bugarska
|
563 355
|
770 193
|
136,7
|
1 009 785
|
1 399 925
|
138,6
|
Bulgaria
|
|
Cipar
|
386 967
|
63 225
|
16,3
|
46 313
|
48 036
|
103,7
|
Cyprus
|
|
Češka
|
1 844 742
|
1 823 507
|
98,8
|
4 012 930
|
4 839 296
|
120,6
|
Czech
Republic
|
|
Danska
|
349 389
|
390 473
|
111,8
|
1 479 309
|
963 267
|
65,1
|
Denmark
|
|
Estonija
|
106 429
|
68 437
|
64,3
|
31 131
|
31 278
|
100,5
|
Estonia
|
|
Finska
|
247 530
|
410 661
|
165,9
|
246 993
|
224 486
|
90,9
|
Finland
|
|
Francuska
|
2 587 200
|
2 800 554
|
108,2
|
4 020 316
|
4 560 002
|
113,4
|
France
|
|
Grčka
|
472 930
|
452 907
|
95,8
|
643 436
|
988 326
|
153,6
|
Greece
|
|
Irska
|
325 731
|
199 980
|
61,4
|
457 431
|
528 329
|
115,5
|
Ireland
|
|
Italija
|
14 289 812
|
15 769 856
|
110,4
|
20 977 217
|
23 235 090
|
110,8
|
Italy
|
|
Letonija
|
103 050
|
76 418
|
74,2
|
69 019
|
57 407
|
83,2
|
Latvia
|
|
Litva
|
198 710
|
352 417
|
177,4
|
192 807
|
202 043
|
104,8
|
Lithuania
|
|
Luksemburg
|
250 365
|
981 316
|
392,0
|
101 315
|
107 249
|
105,9
|
Luxembourg
|
|
Mađarska
|
3 517 265
|
3 694 502
|
105,0
|
12 412 507
|
13 513 108
|
108,9
|
Hungary
|
|
Malta
|
533 695
|
716 357
|
134,2
|
37 281
|
44 462
|
119,3
|
Malta
|
|
Nizozemska
|
1 241 064
|
1 256 285
|
101,2
|
6 338 117
|
6 559 522
|
103,5
|
Netherlands
|
|
Njemačka
|
12 877 057
|
14 300 055
|
111,1
|
25 081 967
|
26 880 421
|
107,2
|
Germany
|
|
Poljska
|
1 492 551
|
1 638 682
|
109,8
|
5 803 840
|
6 580 519
|
113,4
|
Poland
|
|
Portugal
|
435 693
|
403 765
|
92,7
|
220 194
|
270 277
|
122,7
|
Portugal
|
|
Rumunjska
|
1 122 876
|
1 793 830
|
159,8
|
1 323 181
|
1 695 261
|
128,1
|
Romania
|
|
Slovačka
|
1 231 686
|
1 180 171
|
95,8
|
3 067 116
|
3 255 338
|
106,1
|
Slovakia
|
|
Slovenija
|
11 247 370
|
11 949 006
|
106,2
|
17 557 286
|
19 698 145
|
112,2
|
Slovenia
|
|
Španjolska
|
1 621 272
|
1 764 945
|
108,9
|
3 578 137
|
3 746 946
|
104,7
|
Spain
|
|
Švedska
|
898 837
|
786 426
|
87,5
|
949 633
|
996 615
|
104,9
|
Sweden
|
|
Ujedinjena Kraljevina
|
1 565 438
|
1 620 928
|
103,5
|
1 978 547
|
2 193 741
|
110,9
|
United
Kingdom
|
|
Neraspoređeno
|
9 835
|
30 592
|
311,0
|
256
|
76
|
29,7
|
Not
classified
|
|
|
|
|
|
|
|
|
|
|
Zemlje Efte
|
1 700 313
|
1 905 308
|
112,1
|
1 446 225
|
1 743 192
|
120,5
|
EFTA
countries
|
|
Island
|
16 856
|
19 748
|
117,2
|
9 423
|
3 653
|
38,8
|
Iceland
|
|
Lihtenštajn
|
9 410
|
10 567
|
112,3
|
425
|
1 441
|
339,0
|
Liechtenstein
|
|
Norveška
|
497 990
|
543 452
|
109,1
|
154 302
|
453 358
|
293,8
|
Norway
|
|
Švicarska
|
1 176 057
|
1 331 541
|
113,2
|
1 282 075
|
1 284 739
|
100,2
|
Switzerland
|
|
|
|
|
|
|
|
|
|
|
Zemlje Cefte
|
18 234 030
|
18 185 221
|
99,7
|
10 076 539
|
10 652 397
|
105,7
|
CEFTA countries
|
|
Albanija
|
412 509
|
447 500
|
108,5
|
46 045
|
52 142
|
113,2
|
Albania
|
|
Bosna i Hercegovina
|
10 201 845
|
10 101 795
|
99,0
|
5 111 649
|
5 436 709
|
106,4
|
Bosnia and
Herzegovina
|
|
Crna Gora
|
1 247 475
|
1 398 414
|
112,1
|
38 055
|
37 489
|
98,5
|
Montenegro
|
|
Kosovo
|
460 426
|
553 434
|
120,2
|
13 122
|
18 693
|
142,5
|
Kosovo
|
|
Moldavija
|
16 080
|
12 428
|
77,3
|
16 143
|
16 423
|
101,7
|
Moldova
|
|
Sjeverna Makedonija1)
|
896 574
|
949 783
|
105,9
|
564 152
|
638 846
|
113,2
|
North Macedonia1)
|
|
Srbija
|
4 999 120
|
4 721 867
|
94,5
|
4 287 374
|
4 452 095
|
103,8
|
Serbia
|
|
|
|
|
|
|
|
|
|
|
Zemlje OPEC-a
|
1 604 236
|
1 795 565
|
111,9
|
3 654 385
|
4 388 457
|
120,1
|
OPEC countries
|
|
Alžir
|
209 550
|
461 867
|
220,4
|
29 122
|
22 698
|
77,9
|
Algeria
|
|
Angola
|
1 948
|
360
|
18,5
|
-
|
-
|
-
|
Angola
|
|
Ekvador
|
1 510
|
905
|
59,9
|
91 925
|
90 226
|
98,2
|
Ecuador
|
|
Ekvatorska Gvineja
|
-
|
288
|
-
|
-
|
-
|
-
|
Equatorial Guinea
|
|
Gabon
|
2 807
|
2 289
|
81,6
|
-
|
-
|
-
|
Gabon
|
|
Irak
|
54 317
|
270 858
|
498,7
|
1 649 647
|
2 952 275
|
179,0
|
Iraq
|
|
Iran, Islamska Republika
|
39 709
|
47 387
|
119,3
|
399 194
|
446 268
|
111,8
|
Iran, Islamic Republic of
|
|
Katar
|
425 609
|
226 193
|
53,1
|
6 823
|
1 128
|
16,5
|
Qatar
|
|
Kongo
|
1 244
|
8 090
|
650,1
|
144
|
58
|
40,5
|
Congo
|
|
Kuvajt
|
44 984
|
58 455
|
129,9
|
36
|
47
|
129,2
|
Kuwait
|
|
Libija
|
22 909
|
19 430
|
84,8
|
871 273
|
525 364
|
60,3
|
Libya
|
|
Nigerija
|
13 934
|
32 582
|
233,8
|
739
|
4 629
|
626,1
|
Nigeria
|
|
Saudijska Arabija
|
580 655
|
490 100
|
84,4
|
566 282
|
335 355
|
59,2
|
Saudi Arabia
|
|
Ujedinjeni Arapski Emirati
|
196 088
|
176 695
|
90,1
|
6 780
|
9 037
|
133,3
|
United Arab Emirates
|
|
Bolivarijanska Republika
Venezuela
|
8 971
|
66
|
0,7
|
32 419
|
1 371
|
4,2
|
Venezuela, Bolivarian
Republic of
|
|
|
|
|
|
|
|
|
|
|
Ostale
europske zemlje
|
3 590 098
|
3 293 047
|
91,7
|
4 602 099
|
5 477 729
|
119,0
|
Other
countries in Europe
|
|
Bjelorusija
|
64 360
|
65 171
|
101,3
|
59 814
|
83 484
|
139,6
|
Belarus
|
|
Rusija
|
1 341 505
|
1 092 856
|
81,5
|
2 255 802
|
2 807 185
|
124,4
|
Russian
Federation
|
|
Turska
|
1 133 406
|
768 674
|
67,8
|
2 101 885
|
2 372 090
|
112,9
|
Turkey
|
|
Ukrajina
|
215 726
|
268 094
|
124,3
|
177 961
|
198 377
|
111,5
|
Ukraine
|
|
Ostale zemlje
|
835 100
|
1 098 251
|
131,5
|
6 638
|
16 593
|
250,0
|
Other countries
|
|
|
|
|
|
|
|
|
|
|
Ostale
azijske zemlje
|
3 566 873
|
3 737 799
|
104,8
|
12 107 634
|
13 311 689
|
109,9
|
Other countries in Asia
|
|
Azerbajdžan
|
5 210
|
6 083
|
116,8
|
1 674 462
|
2 557 100
|
152,7
|
Azerbaijan
|
|
Bangladeš
|
26 899
|
7 378
|
27,4
|
100 092
|
104 124
|
104,0
|
Bangladesh
|
|
Filipini
|
64 878
|
79 139
|
122,0
|
15 565
|
27 086
|
174,0
|
Philippines
|
|
Hong Kong, Kina
|
268 745
|
257 559
|
95,8
|
90 519
|
114 463
|
126,5
|
Hong Kong, China
|
|
Indija
|
114 433
|
81 688
|
71,4
|
939 798
|
937 857
|
99,8
|
India
|
|
Indonezija
|
111 676
|
68 412
|
61,3
|
175 730
|
149 538
|
85,1
|
Indonesia
|
|
Izrael
|
382 295
|
212 136
|
55,5
|
106 438
|
183 888
|
172,8
|
Israel
|
|
Japan
|
383 085
|
401 466
|
104,8
|
204 022
|
275 392
|
135,0
|
Japan
|
|
Kazahstan
|
106 545
|
71 306
|
66,9
|
1 097 743
|
497 189
|
45,3
|
Kazakhstan
|
|
Kina
|
835 822
|
989 448
|
118,4
|
5 178 171
|
5 959 742
|
115,1
|
China
|
|
Koreja, Republika
|
422 237
|
632 969
|
149,9
|
1 398 365
|
1 446 435
|
103,4
|
Korea, Republic of
|
|
Libanon
|
93 201
|
251 464
|
269,8
|
3 139
|
721
|
23,0
|
Lebanon
|
|
Malezija
|
76 023
|
16 289
|
21,4
|
75 017
|
76 269
|
101,7
|
Malaysia
|
|
Oman
|
55 046
|
9 491
|
17,2
|
2 802
|
1 954
|
69,7
|
Oman
|
|
Pakistan
|
47 664
|
37 007
|
77,6
|
95 028
|
86 567
|
91,1
|
Pakistan
|
|
Singapur
|
69 310
|
55 862
|
80,6
|
36 039
|
135 841
|
376,9
|
Singapore
|
|
Tajland
|
40 405
|
92 939
|
230,0
|
231 642
|
153 288
|
66,2
|
Thailand
|
|
Tajvan, Kina
|
32 057
|
19 057
|
59,4
|
227 793
|
311 333
|
136,7
|
Taiwan, China
|
|
Vijetnam
|
181 687
|
206 070
|
113,4
|
235 266
|
211 336
|
89,8
|
Viet Nam
|
|
Ostale zemlje
|
249 656
|
242 036
|
96,9
|
220 003
|
81 567
|
37,1
|
Other countries
|
|
|
|
|
|
|
|
|
|
|
Ostale afričke zemlje
|
2 212 041
|
1 088 032
|
49,2
|
328 464
|
372 551
|
113,4
|
Other countries in Africa
|
|
Egipat
|
1 019 807
|
469 874
|
46,1
|
81 332
|
95 710
|
117,7
|
Egypt
|
|
Etiopija
|
94 339
|
22 958
|
24,3
|
4 576
|
4 129
|
90,2
|
Ethiopia
|
|
Južnoafrička
Republika
|
112 546
|
84 866
|
75,4
|
60 559
|
37 430
|
61,8
|
South Africa
|
|
Maroko
|
610 294
|
79 313
|
13,0
|
108 346
|
91 410
|
84,4
|
Morocco
|
|
Tunis
|
218 649
|
266 990
|
122,1
|
25 902
|
30 834
|
119,0
|
Tunisia
|
|
Ostale zemlje
|
156 407
|
164 031
|
104,9
|
47 749
|
113 038
|
236,7
|
Other countries
|
|
|
|
|
|
|
|
|
|
|
Ostale
američke zemlje
|
5 448 867
|
3 461 899
|
63,5
|
1 843 983
|
2 168 858
|
117,6
|
Other countries in America
|
|
Argentina
|
7 648
|
94 625
|
2)
|
57 786
|
51 729
|
89,5
|
Argentina
|
|
Brazil
|
55 327
|
75 833
|
137,1
|
286 905
|
215 432
|
75,1
|
Brazil
|
|
Čile
|
8 676
|
23 273
|
268,2
|
13 247
|
12 548
|
94,7
|
Chile
|
|
Kanada
|
373 498
|
536 947
|
143,8
|
121 050
|
432 386
|
357,2
|
Canada
|
|
Kolumbija
|
1 375
|
3 257
|
236,9
|
50 078
|
43 378
|
86,6
|
Colombia
|
|
Meksiko
|
100 113
|
90 033
|
89,9
|
46 269
|
38 135
|
82,4
|
Mexico
|
|
Peru
|
7 039
|
3 757
|
53,4
|
1 614
|
2 126
|
131,8
|
Peru
|
|
SAD
|
4 079 835
|
2 529 804
|
62,0
|
1 072 999
|
1 334 574
|
124,4
|
United
States
|
|
Ostale zemlje
|
815 356
|
104 370
|
12,8
|
194 034
|
38 551
|
19,9
|
Other countries
|
|
|
|
|
|
|
|
|
|
|
Oceanijske zemlje
|
265 219
|
149 288
|
56,3
|
146 410
|
31 660
|
21,6
|
Countries of
Oceania
|
|
Australija
|
143 376
|
134 465
|
93,8
|
30 431
|
17 292
|
56,8
|
Australia
|
|
Maršalovi
Otoci
|
105 736
|
1 041
|
1,0
|
96 658
|
51
|
0,1
|
Marshall
Islands
|
|
Novi Zeland
|
12 577
|
11 168
|
88,8
|
17 525
|
13 473
|
76,9
|
New Zealand
|
|
Ostale zemlje
|
3 529
|
2 613
|
74,0
|
1 796
|
845
|
47,0
|
Other countries
|
|
|
|
|
|
|
|
|
|
|
Neraspoređeno
|
112 421
|
108 464
|
96,5
|
1 611 078
|
416 987
|
25,9
|
Not classified
|
1) Republika
Hrvatska od 15. veljače 2019. godine u svim oblicima službene komunikacije
upotrebljava ime Republika Sjeverna Makedonija.
2) Indeks
je veći od 999.
1) As of 15 February 2019, the Republic
of Croatia uses the name Republic of North Macedonia in all forms of public
communication.
2) The
index exceeds 999.
II. ROBNA RAZMJENA REPUBLIKE HRVATSKE S
INOZEMSTVOM U EURIMA
FOREIGN
TRADE IN GOODS OF THE REPUBLIC OF CROATIA, EURO
1. PROSJEČNA VRIJEDNOST EURA ZA REPUBLIKU
HRVATSKU
AVERAGE
EXCHANGE RATE OF EURO IN THE REPUBLIC OF CROATIA
|
|
Izvoz
Export
|
Uvoz
Import
|
|
|
|
I. – XII. 2017.
|
I. – XII. 2018.
|
indeksi
Indices
I. – XII. 2018.
I. – XII. 2017.
|
I. – XII. 2017.
|
I. – XII. 2018.
|
indeksi
Indices
I. – XII. 2018.
I. – XII. 2017.
|
|
|
|
|
|
|
|
|
|
|
|
Prosječan tečaj 1 eura u kunama
|
7,4625
|
7,4201
|
99,4
|
7,4601
|
7,4204
|
99,5
|
Average
exchange rate for 1 euro in kuna
|
2. IZVOZ I UVOZ PREMA NKD-u 2007.
EXPORT
AND IMPORT, ACCORDING TO NKD 2007.
tis. eura
Thousand
euros
|
|
|
|
Izvoz
Export
|
Uvoz
Import
|
|
|
|
|
|
|
|
I. – XII. 2017.
|
I. – XII. 2018.
|
indeksi
Indices
I. – XII. 2018.
I. – XII. 2017.
|
I. – XII. 2017.
|
I. – XII. 2018.
|
indeksi
Indices
I. – XII. 2018.
I. – XII. 2017.
|
|
|
|
|
|
|
|
|
|
|
|
|
|
|
|
|
|
|
|
Ukupno
|
14
016 945
|
14
543 427
|
103,8
|
21
891 649
|
23
747 557
|
108,5
|
|
|
Total
|
|
|
|
|
|
|
|
|
|
|
|
|
|
|
A
|
|
Poljoprivreda,
šumarstvo i ribarstvo
|
664
188
|
696
521
|
104,9
|
631
140
|
674
827
|
106,9
|
A
|
|
Agriculture,
forestry and fishing
|
|
|
|
|
|
|
|
|
|
|
|
|
|
|
B
|
|
Rudarstvo i
vađenje
|
89
620
|
95
926
|
107,0
|
1
401 640
|
1
709 863
|
122,0
|
B
|
|
Mining and quarrying
|
|
|
|
|
|
|
|
|
|
|
|
|
|
|
C
|
|
Prerađivačka
industrija
|
12
475 211
|
13
063 201
|
104,7
|
19
078 266
|
20
637 081
|
108,2
|
C
|
|
Manufacturing
|
|
|
10
|
Proizvodnja
prehrambenih proizvoda
|
1
080 343
|
1
145 906
|
106,1
|
2
038 861
|
2
092 294
|
102,6
|
|
10
|
Manufacture of food products
|
|
|
11
|
Proizvodnja
pića
|
153
507
|
161
114
|
105,0
|
199
776
|
227
669
|
114,0
|
|
11
|
Manufacture of beverages
|
|
|
12
|
Proizvodnja
duhanskih proizvoda
|
89
603
|
122
933
|
137,2
|
75
284
|
76
603
|
101,8
|
|
12
|
Manufacture of tobacco products
|
|
|
13
|
Proizvodnja
tekstila
|
168
053
|
178
633
|
106,3
|
440
216
|
450
827
|
102,4
|
|
13
|
Manufacture of textiles
|
|
|
14
|
Proizvodnja
odjeće
|
684
321
|
693
406
|
101,3
|
993
858
|
1
069 079
|
107,6
|
|
14
|
Manufacture of wearing apparel
|
|
|
15
|
Proizvodnja
kože i srodnih proizvoda
|
436
651
|
436
183
|
99,9
|
643
670
|
617
893
|
96,0
|
|
15
|
Manufacture of leather and related products
|
|
|
16
|
Prerada
drva i proizvoda od drva i pluta, osim namještaja; proizvodnja proizvoda od
slame i pletarskih materijala
|
645
255
|
706
988
|
109,6
|
302
831
|
338
001
|
111,6
|
|
16
|
Manufacture of wood and of products of wood and cork, except
furniture; manufacture of articles of straw and plaiting materials
|
|
|
17
|
Proizvodnja
papira i proizvoda od papira
|
241
466
|
262
658
|
108,8
|
485
335
|
523
499
|
107,9
|
|
17
|
Manufacture of paper and paper products
|
|
|
18
|
Tiskanje i
umnožavanje snimljenih zapisa
|
1
749
|
2
008
|
114,8
|
2
712
|
1
886
|
69,5
|
|
18
|
Printing and reproduction of recorded media
|
|
|
19
|
Proizvodnja
koksa i rafiniranih naftnih proizvoda
|
1
020 270
|
1
208 570
|
118,5
|
900
394
|
961
053
|
106,7
|
|
19
|
Manufacture of coke and refined petroleum products
|
|
|
20
|
Proizvodnja
kemikalija i kemijskih proizvoda
|
728
477
|
795
550
|
109,2
|
1
655 916
|
1
879 369
|
113,5
|
|
20
|
Manufacture of chemicals and chemical products
|
|
|
21
|
Proizvodnja
osnovnih farmaceutskih proizvoda i farmaceutskih pripravaka
|
1
150 066
|
931
798
|
81,0
|
1
122 006
|
1
201 907
|
107,1
|
|
21
|
Manufacture of basic pharmaceutical products and pharmaceutical
preparations
|
|
|
22
|
Proizvodnja
proizvoda od gume i plastike
|
397
573
|
444
146
|
111,7
|
894
299
|
973
263
|
108,8
|
|
22
|
Manufacture of rubber and plastic products
|
|
|
23
|
Proizvodnja
ostalih nemetalnih mineralnih proizvoda
|
451
718
|
492
883
|
109,1
|
393
399
|
446
326
|
113,5
|
|
23
|
Manufacture of other non-metallic mineral products
|
|
|
24
|
Proizvodnja
metala
|
395
118
|
506
777
|
128,3
|
1
223 213
|
1
317 902
|
107,7
|
|
24
|
Manufacture of basic metals
|
|
|
25
|
Proizvodnja
gotovih metalnih proizvoda, osim strojeva i opreme
|
954
988
|
952
673
|
99,8
|
812
928
|
842
724
|
103,7
|
|
25
|
Manufacture of fabricated metal products, except machinery and
equipment
|
|
|
26
|
Proizvodnja
računala te elektroničkih i optičkih proizvoda
|
462
475
|
476
386
|
103,0
|
1
320 048
|
1
399 052
|
106,0
|
|
26
|
Manufacture of computer, electronic and optical products
|
|
|
27
|
Proizvodnja
električne opreme
|
955
955
|
956
420
|
100,0
|
1
021 382
|
1
218 368
|
119,3
|
|
27
|
Manufacture of electrical equipment
|
|
|
28
|
Proizvodnja
strojeva i uređaja,
d. n.
|
980
866
|
1
020 278
|
104,0
|
1
787 663
|
1
838 857
|
102,9
|
|
28
|
Manufacture of machinery and equipment n. e. c.
|
|
|
29
|
Proizvodnja
motornih vozila, prikolica i poluprikolica
|
538
278
|
662
343
|
123,0
|
1
558 344
|
1
843 013
|
118,3
|
|
29
|
Manufacture of motor vehicles, trailers and semi-trailers
|
|
|
30
|
Proizvodnja
ostalih prijevoznih sredstava
|
392
163
|
389
983
|
99,4
|
266
191
|
335
511
|
126,0
|
|
30
|
Manufacture of other transport equipment
|
|
|
31
|
Proizvodnja
namještaja
|
328
269
|
269
315
|
82,0
|
309
083
|
349
096
|
112,9
|
|
31
|
Manufacture of furniture
|
|
|
32
|
Ostala
prerađivačka industrija
|
218
047
|
246
249
|
112,9
|
630
857
|
632
886
|
100,3
|
|
32
|
Other manufacturing
|
|
|
|
|
|
|
|
|
|
|
|
|
|
|
D
|
|
Opskrba
električnom energijom, plinom, parom i klimatizacija
|
416
163
|
260
033
|
62,5
|
634
500
|
552
376
|
87,1
|
D
|
|
Electricity, gas, steam and air conditioning supply
|
|
|
|
|
|
|
|
|
|
|
|
|
|
|
E
|
|
Opskrba vodom;
uklanjanje otpadnih voda, gospodarenje otpadom te djelatnosti sanacije
okoliša
|
280
980
|
300
999
|
107,1
|
66
183
|
87
352
|
132,0
|
E
|
|
Water supply; sewerage, waste management and remediation activities
|
|
|
|
|
|
|
|
|
|
|
|
|
|
|
J
|
|
Informacije
i komunikacije
|
64
625
|
67
918
|
105,1
|
76
363
|
82
509
|
108,0
|
J
|
|
Information and communication
|
|
|
|
|
|
|
|
|
|
|
|
|
|
|
M
|
|
Stručne,
znanstvene i tehničke djelatnosti
|
31
|
20
|
65,5
|
105
|
78
|
74,4
|
M
|
|
Professional, scientific and technical activities
|
|
|
|
|
|
|
|
|
|
|
|
|
|
|
R
|
|
Umjetnost,
zabava i rekreacija
|
358
|
645
|
180,1
|
345
|
353
|
102,3
|
R
|
|
Arts, entertainment and recreation
|
|
|
|
|
|
|
|
|
|
|
|
|
|
|
|
|
Neraspoređeno
|
25
770
|
58
164
|
225,7
|
3
106
|
3
118
|
100,4
|
|
|
Not classified
|
3. IZVOZ I UVOZ PO SEKTORIMA SMTK
EXPORT
AND IMPORT, ACCORDING TO SITC SECTIONS
tis. eura
Thousand
euros
|
|
|
Izvoz
Export
|
Uvoz
Import
|
|
|
|
|
|
I. – XII. 2017.
|
I. – XII. 2018.
|
indeksi
Indices
I. – XII. 2018.
I. – XII. 2017.
|
I. – XII. 2017.
|
I. – XII. 2018.
|
indeksi
Indices
I. – XII. 2018.
I. – XII. 2017.
|
|
|
|
|
|
|
|
|
|
|
|
|
|
|
|
Ukupno
|
14
016 945
|
14
543 427
|
103,8
|
21
891 649
|
23
747 557
|
108,5
|
|
Total
|
|
|
|
|
|
|
|
|
|
|
|
|
0
|
Hrana i žive životinje
|
1
397 857
|
1
518 745
|
108,6
|
2
408 519
|
2
479 199
|
102,9
|
0
|
Food and
live animals
|
|
1
|
Pića i duhan
|
250
532
|
298
869
|
119,3
|
298
016
|
337
380
|
113,2
|
1
|
Beverages
and tobacco
|
|
2
|
Sirove materije, osim goriva
|
1
070 234
|
1
098 274
|
102,6
|
393
135
|
458
530
|
116,6
|
2
|
Crude
materials, except fuels
|
|
3
|
Mineralna goriva i maziva
|
1
488 765
|
1
537 763
|
103,3
|
2
896 828
|
3
223 649
|
111,3
|
3
|
Mineral
fuels and lubricants
|
|
4
|
Životinjska i biljna ulja i masti
|
60
293
|
65
113
|
108,0
|
99
220
|
95
124
|
95,9
|
4
|
Animal and
vegetable oils and fats
|
|
5
|
Kemijski proizvodi
|
1
977 589
|
1
841 871
|
93,1
|
3
034 349
|
3
305 749
|
108,9
|
5
|
Chemical
products
|
|
6
|
Proizvodi svrstani prema
materijalu
|
2
265 532
|
2
462 887
|
108,7
|
3
912 120
|
4
133 447
|
105,7
|
6
|
Manufactured
goods classified chiefly by material
|
|
7
|
Strojevi i prijevozna sredstva
|
3
274 246
|
3
416 040
|
104,3
|
5
623 311
|
6
291 249
|
111,9
|
7
|
Machinery
and transport equipment
|
|
8
|
Razni gotovi proizvodi
|
2
172 635
|
2
207 381
|
101,6
|
3
208 727
|
3
403 214
|
106,1
|
8
|
Miscellaneous
manufactured articles
|
|
9
|
Proizvodi i transakcije,
d. n.
|
33
493
|
38
319
|
114,4
|
14
318
|
16
897
|
118,0
|
9
|
Commodities
and transactions,
n. e. s.
|
|
|
Neraspoređeno
|
25
770
|
58
164
|
225,7
|
3
106
|
3
118
|
100,4
|
|
Not
classified
|
4. IZVOZ I UVOZ PREMA EKONOMSKIM GRUPACIJAMA
ZEMALJA
EXPORT
AND IMPORT, ACCORDING TO ECONOMIC CLASSIFICATION OF COUNTRIES
tis. eura
Thousand
euros
|
|
Izvoz
Export
|
Uvoz
Import
|
|
|
|
I. – XII. 2017.
|
I. – XII. 2018.
|
indeksi
Indices
I. – XII. 2018.
I. – XII. 2017.
|
I. – XII. 2017.
|
I. – XII. 2018.
|
indeksi
Indices
I. – XII. 2018.
I. – XII. 2017.
|
|
|
|
|
|
|
|
|
|
|
|
Ukupno
|
14
016 945
|
14
543 427
|
103,8
|
21
891 649
|
23
747 557
|
108,5
|
Total
|
|
|
|
|
|
|
|
|
|
|
Države članice EU-a
|
9 093 104
|
9 996 835
|
109,9
|
17 087 954
|
18 548 677
|
108,5
|
EU member
states
|
|
Austrija
|
878 015
|
937 421
|
106,8
|
1 656 321
|
1 636 164
|
98,8
|
Austria
|
|
Belgija
|
240 594
|
260 688
|
108,4
|
469 338
|
389 477
|
83,0
|
Belgium
|
|
Bugarska
|
75 537
|
103 802
|
137,4
|
135 357
|
188 665
|
139,4
|
Bulgaria
|
|
Cipar
|
51 512
|
8 530
|
16,6
|
6 201
|
6 470
|
104,3
|
Cyprus
|
|
Češka
|
247 350
|
245 733
|
99,3
|
537 948
|
652 037
|
121,2
|
Czech
Republic
|
|
Danska
|
46 747
|
52 603
|
112,5
|
198 653
|
129 779
|
65,3
|
Denmark
|
|
Estonija
|
14 263
|
9 220
|
64,6
|
4 171
|
4 216
|
101,1
|
Estonia
|
|
Finska
|
33 181
|
55 530
|
167,4
|
33 134
|
30 235
|
91,3
|
Finland
|
|
Francuska
|
346 373
|
377 189
|
108,9
|
538 821
|
614 375
|
114,0
|
France
|
|
Grčka
|
63 383
|
61 007
|
96,3
|
86 247
|
133 208
|
154,4
|
Greece
|
|
Irska
|
43 525
|
26 990
|
62,0
|
61 290
|
71 212
|
116,2
|
Ireland
|
|
Italija
|
1 914 751
|
2 124 915
|
111,0
|
2 811 864
|
3 130 787
|
111,3
|
Italy
|
|
Letonija
|
13 807
|
10 293
|
74,6
|
9 244
|
7 732
|
83,6
|
Latvia
|
|
Litva
|
26 643
|
47 500
|
178,3
|
25 833
|
27 227
|
105,4
|
Lithuania
|
|
Luksemburg
|
33 613
|
132 819
|
395,1
|
13 580
|
14 462
|
106,5
|
Luxembourg
|
|
Mađarska
|
471 279
|
497 812
|
105,6
|
1 662 723
|
1 820 830
|
109,5
|
Hungary
|
|
Malta
|
71 435
|
96 628
|
135,3
|
4 996
|
5 987
|
119,8
|
Malta
|
|
Nizozemska
|
166 211
|
169 249
|
101,8
|
849 393
|
883 874
|
104,1
|
Netherlands
|
|
Njemačka
|
1 725 259
|
1 926 600
|
111,7
|
3 361 607
|
3 622 216
|
107,8
|
Germany
|
|
Poljska
|
199 970
|
220 780
|
110,4
|
777 926
|
886 725
|
114,0
|
Poland
|
|
Portugal
|
58 367
|
54 401
|
93,2
|
29 525
|
36 424
|
123,4
|
Portugal
|
|
Rumunjska
|
150 510
|
241 803
|
160,7
|
177 404
|
228 432
|
128,8
|
Romania
|
|
Slovačka
|
165 099
|
159 009
|
96,3
|
411 045
|
438 617
|
106,7
|
Slovakia
|
|
Slovenija
|
1 506 951
|
1 609 970
|
106,8
|
2 352 991
|
2 654 489
|
112,8
|
Slovenia
|
|
Španjolska
|
217 057
|
237 796
|
109,6
|
479 711
|
504 922
|
105,3
|
Spain
|
|
Švedska
|
120 494
|
105 993
|
88,0
|
127 227
|
134 272
|
105,5
|
Sweden
|
|
Ujedinjena Kraljevina
|
209 862
|
218 427
|
104,1
|
265 369
|
295 832
|
111,5
|
United
Kingdom
|
|
Neraspoređeno
|
1 318
|
4 127
|
313,1
|
34
|
10
|
29,9
|
Not classified
|
|
|
|
|
|
|
|
|
|
|
Zemlje Efte
|
227 794
|
256 827
|
112,7
|
193 954
|
235 096
|
121,2
|
EFTA
countries
|
|
Island
|
2 265
|
2 664
|
117,6
|
1 264
|
491
|
38,8
|
Iceland
|
|
Lihtenštajn
|
1 260
|
1 425
|
113,1
|
57
|
194
|
340,0
|
Liechtenstein
|
|
Norveška
|
66 682
|
73 358
|
110,0
|
20 698
|
61 278
|
296,1
|
Norway
|
|
Švicarska
|
157 587
|
179 379
|
113,8
|
171 935
|
173 134
|
100,7
|
Switzerland
|
|
|
|
|
|
|
|
|
|
|
Zemlje Cefte
|
2 444 742
|
2 451 675
|
100,3
|
1 351 079
|
1 436 042
|
106,3
|
CEFTA
countries
|
|
Albanija
|
55 301
|
60 353
|
109,1
|
6 175
|
7 032
|
113,9
|
Albania
|
|
Bosna i Hercegovina
|
1 367 917
|
1 361 900
|
99,6
|
685 174
|
732 933
|
107,0
|
Bosnia and
Herzegovina
|
|
Crna Gora
|
167 338
|
188 608
|
112,7
|
5 103
|
5 057
|
99,1
|
Montenegro
|
|
Kosovo
|
61 752
|
74 616
|
120,8
|
1 763
|
2 521
|
143,0
|
Kosovo
|
|
Moldavija
|
2 153
|
1 678
|
78,0
|
2 168
|
2 215
|
102,2
|
Moldova
|
|
Sjeverna Makedonija1)
|
120 213
|
128 052
|
106,5
|
75 638
|
86 080
|
113,8
|
North
Macedonia1)
|
|
Srbija
|
670 067
|
636 468
|
95,0
|
575 059
|
600 204
|
104,4
|
Serbia
|
|
|
|
|
|
|
|
|
|
|
Zemlje
OPEC-a
|
215 016
|
241 949
|
112,5
|
489 595
|
591 704
|
120,9
|
OPEC
countries
|
|
Alžir
|
28 059
|
62 108
|
221,3
|
3 903
|
3 057
|
78,3
|
Algeria
|
|
Angola
|
262
|
48
|
18,5
|
-
|
-
|
-
|
Angola
|
|
Ekvador
|
202
|
122
|
60,4
|
12 337
|
12 165
|
98,6
|
Ecuador
|
|
Ekvatorska Gvineja
|
-
|
39
|
-
|
-
|
-
|
-
|
Equatorial
Guinea
|
|
Gabon
|
377
|
308
|
81,9
|
-
|
-
|
-
|
Gabon
|
|
Irak
|
7 291
|
36 559
|
501,4
|
221 927
|
397 896
|
179,3
|
Iraq
|
|
Iran, Islamska Republika
|
5 322
|
6 388
|
120,0
|
52 803
|
60 214
|
114,0
|
Iran,
Islamic Republic of
|
|
Katar
|
56 958
|
30 493
|
53,5
|
914
|
152
|
16,6
|
Qatar
|
|
Kongo
|
167
|
1 084
|
649,3
|
19
|
8
|
40,8
|
Congo
|
|
Kuvajt
|
6 028
|
7 874
|
130,6
|
5
|
6
|
130,7
|
Kuwait
|
|
Libija
|
3 065
|
2 620
|
85,5
|
116 669
|
70 932
|
60,8
|
Libya
|
|
Nigerija
|
1 856
|
4 391
|
236,6
|
100
|
625
|
627,6
|
Nigeria
|
|
Saudijska Arabija
|
77 919
|
66 081
|
84,8
|
75 640
|
45 245
|
59,8
|
Saudi Arabia
|
|
Ujedinjeni Arapski Emirati
|
26 299
|
23 825
|
90,6
|
908
|
1 219
|
134,3
|
United Arab
Emirates
|
|
Bolivarijanska Republika Venezuela
|
1 213
|
9
|
0,7
|
4 369
|
185
|
4,2
|
Venezuela,
Bolivarian Republic of
|
|
|
|
|
|
|
|
|
|
|
Ostale europske zemlje
|
481
192
|
444
177
|
92,3
|
617
071
|
739
153
|
119,8
|
Other
countries in Europe
|
|
Bjelorusija
|
8
639
|
8
784
|
101,7
|
8
003
|
11
243
|
140,5
|
Belarus
|
|
Rusija
|
179
714
|
147
418
|
82,0
|
302
552
|
379
195
|
125,3
|
Russian
Federation
|
|
Turska
|
152 088
|
103 623
|
68,1
|
281 760
|
319 721
|
113,5
|
Turkey
|
|
Ukrajina
|
28 924
|
36 177
|
125,1
|
23 863
|
26 758
|
112,1
|
Ukraine
|
|
Ostale zemlje
|
111 826
|
148 176
|
132,5
|
892
|
2 236
|
250,8
|
Other
countries
|
|
|
|
|
|
|
|
|
|
|
Ostale
azijske zemlje
|
478 019
|
503 792
|
105,4
|
1 624 999
|
1 793 962
|
110,4
|
Other
countries in Asia
|
|
Azerbajdžan
|
698
|
819
|
117,3
|
225 371
|
344 264
|
152,8
|
Azerbaijan
|
|
Bangladeš
|
3 609
|
995
|
27,6
|
13 426
|
14 037
|
104,5
|
Bangladesh
|
|
Filipini
|
8 704
|
10 644
|
122,3
|
2 087
|
3 655
|
175,1
|
Philippines
|
|
Hong Kong, Kina
|
36 052
|
34 734
|
96,3
|
12 113
|
15 401
|
127,1
|
Hong Kong,
China
|
|
Indija
|
15 362
|
11 015
|
71,7
|
126 142
|
126 337
|
100,2
|
India
|
|
Indonezija
|
14 969
|
9 241
|
61,7
|
23 562
|
20 102
|
85,3
|
Indonesia
|
|
Izrael
|
51 386
|
28 542
|
55,5
|
14 264
|
24 765
|
173,6
|
Israel
|
|
Japan
|
51 071
|
53 968
|
105,7
|
27 395
|
37 116
|
135,5
|
Japan
|
|
Kazahstan
|
14 297
|
9 619
|
67,3
|
147 358
|
67 370
|
45,7
|
Kazakhstan
|
|
Kina
|
112 050
|
133 379
|
119,0
|
694 532
|
803 048
|
115,6
|
China
|
|
Koreja, Republika
|
56 604
|
85 378
|
150,8
|
187 491
|
195 152
|
104,1
|
Korea, Republic of
|
|
Libanon
|
12 481
|
33 949
|
272,0
|
423
|
97
|
23,0
|
Lebanon
|
|
Malezija
|
10 201
|
2 197
|
21,5
|
10 074
|
10 277
|
102,0
|
Malaysia
|
|
Oman
|
7 363
|
1 274
|
17,3
|
373
|
263
|
70,5
|
Oman
|
|
Pakistan
|
6 397
|
5 005
|
78,2
|
12 749
|
11 665
|
91,5
|
Pakistan
|
|
Singapur
|
9 255
|
7 522
|
81,3
|
4 827
|
18 339
|
379,9
|
Singapore
|
|
Tajland
|
5 382
|
12 529
|
232,8
|
31 126
|
20 639
|
66,3
|
Thailand
|
|
Tajvan, Kina
|
4 297
|
2 572
|
59,9
|
30 524
|
41 984
|
137,5
|
Taiwan, China
|
|
Vijetnam
|
24 344
|
27 787
|
114,1
|
31 544
|
28 459
|
90,2
|
Viet Nam
|
|
Ostale zemlje
|
33 497
|
32 623
|
97,4
|
29 615
|
10 990
|
37,1
|
Other countries
|
|
|
|
|
|
|
|
|
|
|
Ostale
afričke zemlje
|
296 649
|
146 794
|
49,5
|
43 960
|
50 205
|
114,2
|
Other
countries in Africa
|
|
Egipat
|
137 110
|
63 354
|
46,2
|
10 883
|
12 885
|
118,4
|
Egypt
|
|
Etiopija
|
12 675
|
3 088
|
24,4
|
614
|
555
|
90,4
|
Ethiopia
|
|
Južnoafrička
Republika
|
15 017
|
11 431
|
76,1
|
8 135
|
5 045
|
62,0
|
South Africa
|
|
Maroko
|
81 789
|
10 688
|
13,1
|
14 468
|
12 343
|
85,3
|
Morocco
|
|
Tunis
|
29 084
|
36 103
|
124,1
|
3 456
|
4 150
|
120,1
|
Tunisia
|
|
Ostale zemlje
|
20 974
|
22 128
|
105,5
|
6 405
|
15 227
|
237,7
|
Other countries
|
|
|
|
|
|
|
|
|
|
|
Ostale
američke zemlje
|
729 775
|
466 619
|
63,9
|
247 332
|
292 170
|
118,1
|
Other
countries in America
|
|
Argentina
|
1 025
|
12 761
|
2)
|
7 753
|
6 969
|
89,9
|
Argentina
|
|
Brazil
|
7 436
|
10 212
|
137,3
|
38 540
|
29 020
|
75,3
|
Brazil
|
|
Čile
|
1 160
|
3 136
|
270,4
|
1 775
|
1 693
|
95,4
|
Chile
|
|
Kanada
|
50 100
|
72 272
|
144,3
|
16 217
|
58 335
|
359,7
|
Canada
|
|
Kolumbija
|
184
|
439
|
239,2
|
6 702
|
5 758
|
85,9
|
Colombia
|
|
Meksiko
|
13 394
|
12 150
|
90,7
|
6 212
|
5 149
|
82,9
|
Mexico
|
|
Peru
|
943
|
507
|
53,7
|
216
|
287
|
132,5
|
Peru
|
|
SAD
|
546 308
|
341 043
|
62,4
|
143 754
|
179 767
|
125,1
|
United
States
|
|
Ostale zemlje
|
109 226
|
14 099
|
12,9
|
26 164
|
5 192
|
19,8
|
Other countries
|
|
|
|
|
|
|
|
|
|
|
Oceanijske zemlje
|
35 570
|
20 126
|
56,6
|
19 709
|
4 267
|
21,6
|
Countries of
Oceania
|
|
Australija
|
19 210
|
18 133
|
94,4
|
4 102
|
2 328
|
56,8
|
Australia
|
|
Maršalovi
Otoci
|
14 196
|
140
|
1,0
|
13 010
|
7
|
0,1
|
Marshall
Islands
|
|
Novi Zeland
|
1 690
|
1 502
|
88,9
|
2 357
|
1 818
|
77,2
|
New Zealand
|
|
Ostale
zemlje
|
475
|
351
|
73,9
|
240
|
114
|
47,3
|
Other countries
|
|
|
|
|
|
|
|
|
|
|
Neraspoređeno
|
15
084
|
14
632
|
97,0
|
215
995
|
56
282
|
26,1
|
Not classified
|
1) Republika
Hrvatska od 15. veljače 2019. godine u svim oblicima službene komunikacije
upotrebljava ime Republika Sjeverna Makedonija.
2) Indeks
je veći od 999.
1) As
of 15 February 2019, the Republic of Croatia uses the name Republic of North
Macedonia in all forms of public communication.
2) The index exceeds 999.
|
METODOLOŠKA
OBJAŠNJENJA
|
|
NOTES
ON METHODOLOGY
|
|
|
|
|
|
Izvori
i metode prikupljanja podataka
|
|
Sources
and methods of data collection
|
|
|
|
|
|
Izvor
podataka za statistiku robne razmjene s državama članicama EU-a jest
Intrastatov obrazac kojim izvještajne jedinice izvješćuju o primicima i/ili
otpremama na mjesečnoj osnovi, tj. u mjesecu u kojem roba fizički ulazi ili
napušta teritorij Republike Hrvatske. Izvještajne jedinice jesu svi
poslovni subjekti, obveznici poreza na dodanu vrijednost, čija vrijednost
robne razmjene s državama članicama EU-a prelazi prag uključivanja
određenoga za izvještajnu godinu. Za 2018. određena je vrijednost praga
uključivanja za primitke od 1,9 milijuna kuna, a za otpreme 1,0 milijuna
kuna. Radi potpunog usklađivanja s metodologijom i zakonodavstvom EU-a u
podatke o robnoj razmjeni s inozemstvom uključena je vrijednost trgovine
ispod praga uključivanja, procijenjena na osnovi podataka o isporukama i
stjecanjima dobara u države članice/iz država članica EU-a, dobivenih od
Porezne uprave Republike Hrvatske.
|
|
The data source for statistics on trading in goods
with EU Member States is the Intrastat form used by the reporting units to
report on arrivals and/or dispatches on a monthly basis, that is, for each
month in which goods physically enter or leave the territory of the
Republic of Croatia. The reporting units are all business entities, value
added tax payers whose value of trading in goods with EU Member States
exceeds the exemption threshold determined for the reference year. For
2018, an exemption threshold of 1.9 million kuna for arrivals and of 1.0
million kuna for dispatches has been determined. In order to achieve
complete harmonisation with EU methodology and legislation, data on foreign
trade in goods have been supplemented with trade value below the exemption
threshold after being estimated on the basis of data on supplies and
acquisitions of goods in/from EU Member States provided by the Tax
Administration Office of the Republic of Croatia.
|
|
|
|
|
|
Izvor
podataka za statistiku robne razmjene s trećim zemljama, odnosno državama
nečlanicama EU-a, jesu Jedinstvene carinske deklaracije o izvozu i uvozu
robe. Državni zavod za statistiku Republike Hrvatske dobiva od Carinske
uprave Republike Hrvatske kontrolirane Jedinstvene carinske deklaracije u
obliku slogova.
|
|
The
data source for statistics on trading in goods with third countries, that
is, non-EU countries, are Single Administrative Documents on export and
import of goods. The Croatian Bureau of Statistics receives the reviewed
Single Administrative Documents from the Customs Administration of the
Republic of Croatia in the form of data records.
|
|
|
|
|
|
Poštujući
osnovne metodološke preporuke Statističkog ureda UN-a i Eurostata, Državni
zavod za statistiku prikupljene podatke Intrastata i Extrastata statistički
obrađuje i objavljuje kao jedinstveni podatak robne razmjene Republike
Hrvatske s inozemstvom.
|
|
Following
basic methodological recommendations of the UN Statistical Office and
Eurostat, the Croatian Bureau of Statistics statistically processes and
disseminates collected Intrastat and Extrastat data as unique information
on foreign trade in goods of the Republic of Croatia.
|
|
|
|
|
|
|
|
|
|
Pravna
osnova
|
|
Legal
basis
|
|
|
|
|
|
Pravna
osnova za provođenje istraživanja Intrastat jest europsko zakonodavstvo za
statistiku robne razmjene između država članica
EU-a (Uredba (EZ) br. 638/2004 i dopune navedene uredbe br. 222/2009 i
659/2014 Europskog parlamenta i Vijeća te provedbena Uredba Komisije br.
1982/2004 i dopune Uredbe Komisije br. 1915/2005, 91/2010, 96/2010 i
1093/2013), Zakon o službenoj statistici (NN, br. 103/03., 75/09., 59/12. i
12/13. – pročišćeni tekst), Godišnji provedbeni plan statističkih
aktivnosti Republike Hrvatske 2018. godine (NN, br. 33/18.)
i Zakon o carinskoj službi (NN, br. 68/13., 30/14., 115/16. i 39/19).
Opširnija metodološka objašnjenja za ovo istraživanje objavljena su na
internetskim stranicama Državnog zavoda za statistiku http://www.dzs.hr/Hrv/intrastat/intrastat.htm.
|
|
The
legal basis for the conduct of the Intrastat survey is the European
legislation related to statistics on trading in goods between EU Member
States (Regulation (EC) No. 638/2004 and amending regulations Nos 222/2009
and 659/2014 of the European Parliament and of the Council as well as the
Commission Implementing Regulation No. 1982/2004 and the Commission
amending regulations Nos 1915/2005, 91/2010, 96/2010 and 1093/2013), the
Official Statistics Act (NN, Nos 103/03, 75/09, 59/12 and 12/13 –
consolidated text), the Annual Implementation Plan of Statistical
Activities of the Republic of Croatia 2018 (NN, No. 33/18), and the Customs
Administration Act (NN, Nos 68/13, 30/14, 115/16 and 39/19). More detailed
notes on the methodology for this survey are published on the web site of
the Croatian Bureau of Statistics http://www.dzs.hr/Eng/intrastat/intrastat.htm.
|
|
|
|
|
|
Pravna
osnova za Extrastat jest europsko zakonodavstvo za statistiku robne
razmjene s trećim zemljama (Uredba (EZ) br. 471/2009 i izmjene navedene
uredbe br. 2016/1724 i 2016/2119 Europskog parlamenta i Vijeća, Uredba
Komisije (EU) br. 92/2010 i izmjena navedene uredbe br. 2016/1253 i Uredba
Komisije (EU) br. 113/2010), Zakon o provedbi carinskog zakonodavstva
Europske unije (NN, br. 40/16.), Zakon o službenoj statistici (NN, br.
103/03., 75/09., 59/12. i 12/13. – pročišćeni tekst), Godišnji provedbeni
plan statističkih aktivnosti Republike Hrvatske 2018. godine (NN,
br. 33/18.), Zakon o carinskoj službi (NN, br. 68/13., 30/14., 115/16. i
39/19) i Pravilnik o popunjavanju Jedinstvene carinske deklaracije (NN, br.
77/13.).
|
|
The legal basis for Extrastat is the European
legislation related to statistics on trading in goods with third countries
(the Regulation (EC) No. 471/2009 and the amending regulations Nos
2016/1724 and 2016/2119 of the European Parliament and of the Council, the
Commission Regulation (EU) No. 92/2010 and the amending Regulation No.
2016/1253 as well as the Commission Regulation (EU) No. 113/2010), the EU
Customs Legislations Implementation Act (NN, No. 40/16), the Official
Statistics Act (NN, Nos 103/03, 75/09, 59/12 and 12/13 – consolidated text), the Annual
Implementation Plan of Statistical Activities of the Republic of Croatia
2018 (NN, No. 33/18), the Customs Administration Act (NN, Nos 68/13, 30/14,
115/16 and 39/19) and the Ordinance on Filling in the Single Administrative
Document (NN, No. 77/13).
|
|
|
|
|
|
|
|
|
|
Obuhvat
i usporedivost
|
|
Coverage
and comparability
|
|
|
|
|
|
Statistika
robne razmjene s inozemstvom obuhvaća svu robu koja se izvozi iz zemlje
odnosno uvozi u zemlju. U podatke o robnoj razmjeni s inozemstvom uključeni
su i izvoz i uvoz prema osnovi unutarnje i vanjske proizvodnje na bruto
osnovi.
|
|
Statistics
on foreign trade in goods include all goods exported from or imported into
the country. Data on foreign trade in goods include both export and import
based on gross inward and outward processing.
|
|
|
|
|
|
Statistička vrijednost robe jest vrijednost robe na
hrvatskoj granici. Kod izvoza, odnosno otprema, vrijednosti su prikazane
prema paritetu fob, a kod uvoza, odnosno primitaka, vrijednosti se
prikazuju prema paritetu cif.
|
|
Statistical
value of goods is the value of goods at the Croatian border. Values for
exports, i. e. dispatches, are shown as an FOB-type value, while values for
imports, i. e. arrivals, are shown as a CIF-type value.
|
|
|
|
|
|
Iznosi
u stranim valutama preračunani su u kune, eure i američke dolare primjenom
mjesečnih tečajnih lista određenih za izvještajni mjesec. Primjenjuje se
srednji valutni tečaj Hrvatske narodne banke.
|
|
Amounts
expressed in foreign currencies are converted into kuna, euros and American
dollars according to the monthly exchange rate lists determined for the
reporting month. The mean exchange rate of the Croatian National Bank is
used.
|
|
|
|
|
|
U
pojedinim tablicama može se dogoditi da ukupni zbroj ne odgovara zbroju
pojedinačnih stavki zbog zaokruživanja na tisuće.
|
|
In
certain tables, the sum total may not equal the sum of individual figures
due to the rounding to thousands.
|
|
|
|
|
|
U prikazivanju podataka po djelatnostima primjenjuje
se NKD 2007. (NN, br. 58/07. i 72/07.), koji je stupio na snagu 1. siječnja
2008. Utemeljen je na europskoj klasifikaciji NACE, Rev. 2, koja je
obvezatna za države članice Europske unije. Podaci se iskazuju prema
proizvodnom načelu kod kojeg se podaci za izvoz i uvoz dobivaju prema
djelatnosti koja proizvodi dotični proizvod, odnosno iz koje proizvod
potječe.
|
|
Data by type of activities have been presented
according to the NKD 2007. (NN,
Nos 58/07 and 72/07), which entered into force on 1 January
2008 and is based on the European classification NACE, Rev. 2, which is
obligatory in EU Member States. Data are presented using a production
approach by which export and import data are reported according to the
manufacturing activity from which the product originates.
|
|
|
|
|
|
Roba
koja se pojavljuje u izvozu i uvozu za potrebe statistike razvrstava se
prema Standardnoj međunarodnoj trgovinskoj klasifikaciji (SMTK, Rev. 4).
|
|
Goods
listed under export and import are classified, for statistical needs,
according to the Standard International Trade Classification (SITC, Rev.
4).
|
|
|
|
|
|
Podaci
se iskazuju kod izvoza robe prema zemljama namjene, a kod uvoza robe
primjenjuju se dva metodološka kriterija iskazivanja podataka uvoza prema
zemljama. U Extrastatu se kod uvoza robe podaci iskazuju prema zemljama
podrijetla robe, dok se kod primitaka robe u Intrastatu iskazuju prema
zemljama otpreme.
|
|
Data on
export are shown by countries of destination, while two methodological
criterions has been applied, by which data on import are shown by
countries. In Extrastat, data on import are shown by countries of origin of
goods, while, in Intrastat, data on arrivals of goods are presented by
countries of dispatch.
|
|
|
|
|
|
Članstvo
u OPEC-u podložno je čestim promjenama. Detaljnije informacije o državama
članicama OPEC-a objavljuju se na internetskim stranicama
https://www.opec.org/.
|
|
OPEC
membership is subject to frequent changes. More detailed information about
Member Countries are published on the web site https://www.opec.org/.
|
|
|
|
|
Za
određeni mjesec obrađuju se samo Jedinstvene carinske deklaracije koje
imaju datum prihvaćanja u carinarnici/ispostavi iz tog mjeseca i
Intrastatovi obrasci dostavljeni za izvještajni mjesec. U tekućoj godini
mijenjaju se već objavljeni podaci za prijašnje mjesece radi razvrstavanja naknadno
pristiglih i/ili ispravljenih Intrastatovih obrazaca i Jedinstvenih
carinskih deklaracija koje se odnose na prijašnja razdoblja.
|
|
Only
Single Administrative Documents containing the date of acceptance in a
customs office in a particular month are processed for that month as well
as Intrastat forms submitted for the reporting month. Already issued data
for previous months are changed during the current year in order to
classify subsequently received and/or corrected Intrastat forms and Single
Administrative Documents for earlier periods.
|
|
|
|
|
|
Mjesečni
podaci ispravljaju se sve dok se ne zaključi konačna obrada tekuće godine
(sredinom sljedeće godine). Mjesečni rezultati sve do konačne obrade tekuće
godine i objavljivanja konačnih podataka smatraju se privremenima. Podaci
za mjesece u 2018. u ovom Priopćenju smatraju se konačnima.
|
|
Monthly
data are corrected until final data processing for the current year is done
(the middle of the next year). Monthly data are considered provisional
until the final processing of the current year and dissemination of final
data is done. Monthly data for 2018 issued in this Release are considered
final.
|
|
|
|
|
|
Podaci
robne razmjene s inozemstvom dostupni su u vremenskim serijama objavljenim
na internetskim stranicama Državnog zavoda za statistiku na poveznici
Statistika u nizu pod naslovom Gospodarstvo – osnovni pokazatelji (podaci
od 2000.) i pod naslovom Robna razmjena s inozemstvom (podaci od 2010.).
|
|
Data on foreign trade in goods are
available in the time series published on the website of the Croatian
Bureau of Statistics under Statistics in Line; Economy –
Basic Indicators (data from 2000) and Foreign Trade in Goods (data from
2010).
|
|
|
|
|
|
|
|
|
|
Kratice
|
|
Abbreviations
|
|
|
|
|
|
Cefta
|
Sporazum o slobodnoj trgovini srednjoeuropskih
zemalja
|
|
CEFTA
|
Central European Free Trade Agreement
|
|
cif
|
cijena s osiguranjem i vozarinom
|
|
CIF
|
cost, insurance and freight
|
|
d. n.
|
drugdje nespomenuto
|
|
EC
|
European Community
|
|
Efta
|
Europsko udruženje za slobodnu trgovinu
|
|
EFTA
|
European Free Trade Association
|
|
EU
|
Europska unija
|
|
EU
|
European Union
|
|
Eurostat
|
Statistički ured Europske unije
|
|
Eurostat
|
Statistical Office of the European Communities
|
|
EZ
|
Europska zajednica
|
|
FOB
|
free on board
|
|
fob
|
franko brod
|
|
NACE
|
Statistical Classification of Economic Activities
|
|
NACE
|
Statistička klasifikacija ekonomskih djelatnosti u
|
|
|
in the European Community
|
|
|
Europskoj zajednici
|
|
n. e. c.
|
not elsewhere classified
|
|
NKD 2007.
|
Nacionalna klasifikacija djelatnosti, verzija 2007.
|
|
n. e. s.
|
not elsewhere specified
|
|
NN
|
Narodne novine
|
|
NKD 2007.
|
National Classification of Activities, 2007 version
|
|
OPEC
|
Organizacija zemalja izvoznica nafte
|
|
NN
|
Narodne novine, official gazette of the Republic of
Croatia
|
|
SAD
|
Sjedinjene Američke Države
|
|
OPEC
|
Organization of Petroleum Exporting Countries
|
|
SMTK
|
Standardna međunarodna trgovinska klasifikacija
|
|
SITC
|
Standard International Trade Classification
|
|
tis.
|
tisuća
|
|
UN
|
United Nations
|
|
UN
|
Ujedinjeni narodi
|
|
US $
|
American dollar
|
|
USD
|
američki dolar
|
|
|
|
|
|
|
|
|
|
|
|
|
Znakovi
|
|
Symbols
|
|
|
|
|
|
-
|
nema
pojave
|
|
-
|
no
occurrence
|
|
0
|
podatak
je manji od 0,5 upotrijebljene mjerne jedinice
|
|
0
|
value
not zero but less than 0.5 of the unit of measure used
|
|
|
|
|
|
|
|
Objavljuje
i tiska Državni zavod za statistiku Republike Hrvatske, Zagreb, Ilica 3, p.
p. 80.
Published
and printed by the Croatian Bureau of Statistics, Zagreb, Ilica 3, P. O. B.
80
Telefon/ Phone:
+385 (0) 1 4806-111, telefaks/ Fax: +385 (0) 1 4817-666
Odgovorne
osobe:
Persons
responsible:
Darko
Jukić, načelnik Sektora poslovnih statistika
Darko
Jukić, Director of Business Statistics Directorate
Lidija
Brković, ravnateljica
Lidija
Brković, Director General
Priredili:
Boro Žderić i Dubravka Drempetić
Prepared
by:
Boro Žderić and Dubravka Drempetić
|
|
MOLIMO
KORISNIKE DA PRI KORIŠTENJU PODATAKA NAVEDU IZVOR.
USERS
ARE KINDLY REQUESTED TO STATE THE SOURCE.
|
|
Naklada:
20 primjeraka
20 copies
printed
Podaci iz
ovog Priopćenja objavljuju se i na internetu.
First
Release data are also published on the Internet.
Služba za
komunikaciju s korisnicima
User
Communication Department
|
· Informacije
i korisnički zahtjevi
Information
and user requests
|
· Pretplata
publikacija
Subscription
|
· Novinarski
upiti
Press corner
|
|
Telefon/ Phone:
+385 (0) 1 4806-138, 4806-154
Elektronička
pošta/ E-mail:
stat.info@dzs.hr
Telefaks/ Fax:
+385 (0) 1 4806-148
|
Telefon/ Phone:
+385 (0) 1 4806-115
Elektronička
pošta/ E-mail:
prodaja@dzs.hr
Telefaks/ Fax:
+385 (0) 1 4806-148
|
Telefon/ Phone:
+385 (0) 1 4806-121, 4806-168
Elektronička
pošta/ E-mail:
press@dzs.hr
Telefaks/ Fax:
+385 (0) 1 4806-148
|
|