|

GODINA/ YEAR: LVI. ZAGREB,
13. PROSINCA 2019./ 13 DECEMBER, 2019 BROJ/
NUMBER: 12.1.5.
BRUTO DOMAĆI PROIZVOD I STVARNA INDIVIDUALNA
POTROŠNJA U STANDARDU KUPOVNE MOĆI U 2018.
GROSS DOMESTIC PRODUCT AND
ACTUAL INDIVIDUAL CONSUMPTION IN PURCHASING POWER STANDARD, 2018
|
Eurostat
13. prosinca 2019. objavljuje podatke o bruto domaćem proizvodu (BDP)
i stvarnoj individualnoj potrošnji (SIP) po stanovniku za 2018., iskazane standardom
kupovne moći (SKM).
|
|
On 13
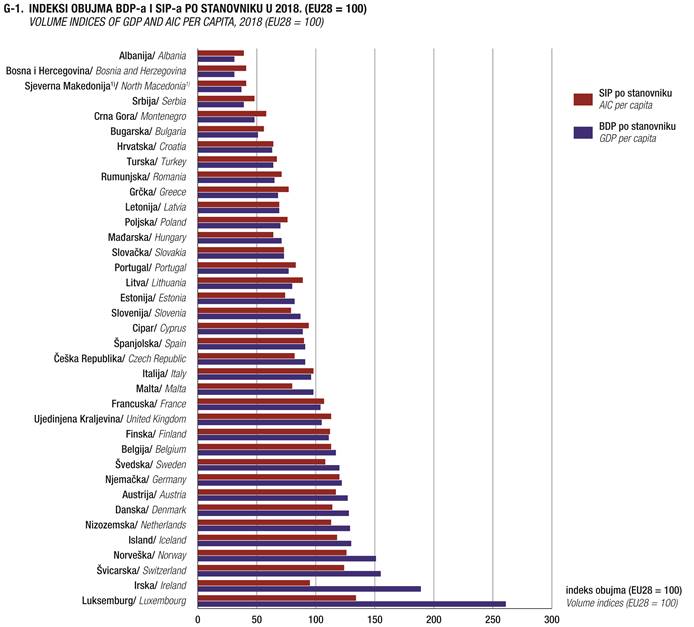
December 2019, Eurostat publishes data on gross domestic product (GDP) and
actual individual consumption (AIC) per capita for 2018, expressed in the
purshasing power standard (PPS).
|
|
1)
|
Republika
Hrvatska od 15. veljače 2019. godine u svim oblicima službene
komunikacije upotrebljava ime Republika Sjeverna Makedonija.
|
|
1)
|
As of 15 February 2019, the Republic of
Croatia uses the name Republic of North Macedonia in all forms of public
communication.
|
|
Državni zavod za
statistiku zajedno sa statističkim uredima ostalih europskih zemalja
sudjeluje u Europskom programu usporedbe s ciljem međunarodnog
uspoređivanja fizičkog obujma svih kategorija finalne potrošnje
BDP-a svih zemalja sudionica projekta.
|
|
The
Croatian Bureau of Statistics participates in the European comparison
programme together with the statistical offices of other European countries
with the aim of internationally comparing the volume of all categories of
final consumption of GDP of all countries participating in the project.
|
|
|
|
|
|
Ovdje predstavljamo
najnovije analize pariteta kupovne moći (PKM) i s njima povezanih
ekonomskih pokazatelja (BDP i SIP) po stanovniku za razdoblje od 2016. do
2018. s naglaskom na posljednju referentnu godinu.
|
|
This
First Release presents the most recent analyses of purchasing power
parities (PPPs) and related economic indicators (GDP and AIC) per capita
for the period 2016 ‒ 2018, focusing on the latest reference year.
|
|
|
|
|
|
Rezultati
Europskog programa usporedbe cijena i BDP-a pokazuju da BDP po stanovniku u
Republici Hrvatskoj izražen u paritetu kupovne moći za 2018. iznosi
63% prosjeka 28 zemalja članica EU-a, dok SIP po stanovniku u istoj
godini iznosi 64% prosjeka EU-28.
|
|
The
results of the European comparison programme of prices and GDP show that
GDP per capita in the Republic of Croatia expressed in the purchasing power
standard for 2018 amounted to 63% of the average of 28 EU Member States,
while AIC per capita in the same year amounted to 64% of the EU-28 average.
|
|
|
|
|
|
|
|
|
|
Luksemburg, zemlja s najvećim
BDP-om prema SKM-u
|
|
Luxembourg,
country with the highest GDP expressed in PPS
|
|
|
|
|
|
Od zemalja
članica EU-a, najveći BDP po stanovniku prema SKM-u ima
Luksemburg i njegova je razina više od dva i pol puta viša od prosjeka EU-28
te iznosi 261%, dok najnižu razinu BDP-a ima Bugarska i ona iznosi 51%
prosjeka EU-28.
|
|
Among
the EU Member States, the highest GDP per capita in PPS is recorded in
Luxembourg and its level is more than two and a half times above the EU-28
average, amounting to 261% of the EU-28 average, while Bulgaria has the
lowest GDP level, amounting to 51% of the EU-28 average.
|
|
|
|
|
|
Najveća
razina BDP-a po stanovniku u Luksemburgu dijelom je posljedica velikog
udjela prekograničnih radnika u ukupnom broju zaposlenih. Iako
prekogranični radnici sudjeluju u BDP-u, oni ne čine dio
rezidentnog stanovništva koji je uključen u izračunavanje BDP-a
po stanovniku.
|
|
The
highest level of GDP per capita in Luxembourg is partly due to the large
share of cross-border workers in the total employment. Although
cross-border workers contribute to GDP, they are not taken into consideration
as part of the resident population that is included in the calculation of GDP
per capita.
|
|
|
|
|
|
Uobičajeno je
da se BDP po stanovniku koristi kao pokazatelj razine blagostanja u
zemljama, ali on nije jedini takav pokazatelj. Pokazatelj koji bolje
odražava stanje blagostanja u kućanstvima jest SIP po stanovniku i
homogenija je kategorija od razine BDP-a. No bez obzira na homogenost te
kategorije još uvijek postoje značajne razlike među zemljama
članicama.
|
|
While
GDP per capita is mainly used as an indicator of a country’s level of
welfare, it is not the only such indicator. AIC per capita is an
alternative indicator better adapted to describe the material welfare
situation of households. Generally, it is a more homogeneous category than the
level of GDP, but there are still substantial differences across the Member
States.
|
|
|
|
|
|
|
|
|
|
SIP je najmanji u
Albaniji
|
|
AIC is
the lowest in Albania
|
|
|
|
|
|
SIP po stanovniku
prema SKM-u među zemljama članicama EU-a u 2018. kretao se od 44%
ispod prosjeka EU-28 u Bugarskoj do 34% iznad prosjeka EU-28 u Luksemburgu.
|
|
AIC per
capita in PPS among the EU Member States in 2018 ranged from 44% below the
EU-28 average in Bulgaria to 34% above the EU-28 average in Luxembourg.
|
|
|
|
|
|
Osim Luksemburga,
najveći SIP po stanovniku prema SKM-u ostvarile su Njemačka, Austrija,
Danska, Belgija, Nizozemska, Ujedinjena Kraljevina i Finska, i to u rasponu
između 10% i 20% iznad prosjeka EU-28.
|
|
In
addition to Luxembourg, the highest AIC per capita in PPS was recorded in Germany,
Austria, Denmark, Belgium, the Netherlands, the United Kingdom and Finland,
ranging between 10% and 20% above the EU-28 average.
|
|
|
|
|
|
Zatim slijede
Švedska i Francuska, čiji je SIP po stanovniku u SKM-u iznosio oko 10%
iznad prosjeka EU-28.
|
|
These
were followed by Sweden and France, which had AIC per capita in PPS of about
10% above the EU-28 average.
|
|
|
|
|
|
Skupinu zemalja
čija je razina SIP-a po stanovniku ispod prosjeka EU-28 čine Italija,
Irska, Cipar, Španjolska, Litva, Portugal, Češka Republika i Malta te
se on kreće u rasponu od 2% do 20%.
|
|
Italy,
Ireland, Cyprus, Spain, Lithuania, Portugal, Czech Republic and Malta
constitute a group of countries whose level of AIC per capita is below the
EU-28 average, ranging from 2% to 20%.
|
|
|
|
|
|
Između 20% i
30% ispod prosjeka EU-28 su Slovenija, Grčka, Poljska, Estonija,
Slovačka i Rumunjska.
|
|
Slovenia,
Greece, Poland, Estonia, Slovakia and Romania are between 20% and 30%
below the EU-28 average.
|
|
|
|
|
|
Najnižu razinu SIP-a
po stanovniku ima skupina zemalja koju čine Letonija, Hrvatska,
Mađarska i Bugarska, čiji je prosjek između 30% i 50% ispod
prosjeka EU-28.
|
|
The
lowest level of AIC per capita was recorded in the group of countries
consisting of Latvia, Croatia, Hungary and Bulgaria, whose average is
between 30% and 50% below the EU-28 average.
|
|
|
|
|
|
Uz 28 zemalja
članica EU-a u analizu su uključene i zemlje članice EFTA-e
(Norveška, Švicarska i Island), zemlje kandidatkinje za članstvo u EU
(Turska, Crna Gora, Srbija, Sjeverna Makedonija1) i Albanija) te
zemlja potencijalna kandidatkinja za članstvo u EU (Bosna i
Hercegovina).
|
|
In
addition to 28 EU Member States, the analysis includes three EFTA Member
States (Norway, Switzerland and Iceland), the EU Candidate Countries
(Turkey, Montenegro, Serbia, North Macedonia1) and Albania) and a
Potential Candidate Country (Bosnia and Herzegovina).
|
|
|
|
|
|
U zemljama EFTA-e
u 2018. SIP se kretao između 18% i 26% iznad prosjeka EU-28, dok se u
zemljama kandidatkinjama kretao između 30% i 60% ispod prosjeka EU-28,
a u zemlji potencijalnoj kandidatkinji iznosio je 59% ispod prosjeka EU-28.
|
|
In 2018
in EFTA countries, SIP ranged between 18% and 26% above the EU-28 average, in
Candidate Countries it ranged between 30% and 60% below the EU-28 average,
while in the Potential Candidate Country it amounted to 59% below the EU-28
average.
|
|
1)
|
Republika Hrvatska
od 15. veljače 2019. godine u svim oblicima službene komunikacije
upotrebljava ime Republika Sjeverna Makedonija.
|
|
1)
|
As of 15 February 2019, the Republic of Croatia uses
the name Republic of North Macedonia in all forms of public communication.
|
|
|
|
|
1. BDP
I SIP PO STANOVNIKU U SKM-U, INDEKSI OBUJMA (EU28 = 100) U 2016., 2017. I
2018., PREGLED PO ZEMLJAMA SUDIONICAMA
GDP
AND AIC IN PPS, VOLUME INDICES (EU28 = 100), 2016, 2017 AND 2018, OVERVIEW BY
PARTICIPATING COUNTRIES
Indeksi
obujma (EU28 = 100)
Volume
indices (EU28 = 100)
|
Zemlje1)
|
BDP po stanovniku
GDP per capita
|
SIP po stanovniku
AIC per capita
|
Countries1)
|
|
2016.
|
2017.
|
2018.
|
2016.
|
2017.
|
2018.
|
|
|
|
|
|
|
|
|
|
|
EU-28
|
100
|
100
|
100
|
100
|
100
|
100
|
EU-28
|
|
EA-19
|
106
|
106
|
106
|
105
|
104
|
104
|
EA-19
|
|
|
|
|
|
|
|
|
|
|
Države članice EU-a
|
|
|
|
|
|
|
EU Member States
|
|
Luksemburg
|
269
|
261
|
261
|
135
|
133
|
134
|
Luxembourg
|
|
Njemačka
|
123
|
123
|
122
|
121
|
121
|
120
|
Germany
|
|
Austrija
|
128
|
127
|
127
|
119
|
118
|
117
|
Austria
|
|
Danska
|
127
|
127
|
128
|
113
|
114
|
114
|
Denmark
|
|
Belgija
|
119
|
118
|
117
|
114
|
113
|
113
|
Belgium
|
|
Nizozemska
|
127
|
128
|
129
|
111
|
112
|
113
|
Netherlands
|
|
Ujedinjena Kraljevina
|
108
|
106
|
105
|
115
|
114
|
113
|
United Kingdom
|
|
Finska
|
110
|
110
|
111
|
112
|
111
|
112
|
Finland
|
|
Švedska
|
123
|
122
|
120
|
112
|
111
|
108
|
Sweden
|
|
Francuska
|
105
|
103
|
104
|
110
|
108
|
107
|
France
|
|
Italija
|
97
|
97
|
96
|
98
|
98
|
98
|
Italy
|
|
Irska
|
176
|
181
|
189
|
95
|
94
|
95
|
Ireland
|
|
Cipar
|
87
|
88
|
89
|
92
|
93
|
94
|
Cyprus
|
|
Španjolska
|
91
|
92
|
91
|
90
|
91
|
90
|
Spain
|
|
Litva
|
75
|
78
|
80
|
85
|
87
|
89
|
Lithuania
|
|
Portugal
|
77
|
77
|
77
|
82
|
81
|
83
|
Portugal
|
|
Češka Republika
|
87
|
89
|
91
|
79
|
81
|
82
|
Czech Republic
|
|
Malta
|
95
|
97
|
98
|
78
|
78
|
80
|
Malta
|
|
Slovenija
|
83
|
85
|
87
|
77
|
78
|
79
|
Slovenia
|
|
Grčka
|
68
|
67
|
68
|
77
|
76
|
77
|
Greece
|
|
Poljska
|
68
|
69
|
70
|
74
|
75
|
76
|
Poland
|
|
Estonija
|
76
|
78
|
82
|
72
|
72
|
74
|
Estonia
|
|
Slovačka
|
72
|
72
|
73
|
68
|
69
|
73
|
Slovakia
|
|
Rumunjska
|
59
|
63
|
65
|
65
|
69
|
71
|
Romania
|
|
Letonija
|
64
|
66
|
69
|
66
|
67
|
69
|
Latvia
|
|
Hrvatska
|
60
|
61
|
63
|
61
|
62
|
64
|
Croatia
|
|
Mađarska
|
68
|
68
|
71
|
62
|
63
|
64
|
Hungary
|
|
Bugarska
|
49
|
50
|
51
|
54
|
54
|
56
|
Bulgaria
|
|
|
|
|
|
|
|
|
|
|
Države
članice EFTA-e
|
|
|
|
|
|
|
EFTA
Member States
|
|
Norveška
|
144
|
146
|
151
|
127
|
126
|
126
|
Norway
|
|
Švicarska
|
160
|
155
|
155
|
127
|
124
|
124
|
Switzerland
|
|
Island
|
129
|
129
|
130
|
114
|
116
|
118
|
Iceland
|
|
|
|
|
|
|
|
|
|
|
Zemlje
kandidatkinje za članstvo u EU
|
|
|
|
|
|
|
EU
Candidate Countries
|
|
Turska
|
65
|
65
|
64
|
67
|
68
|
67
|
Turkey
|
|
Crna
Gora
|
44
|
46
|
48
|
56
|
56
|
58
|
Montenegro
|
|
Srbija
|
39
|
38
|
39
|
47
|
47
|
48
|
Serbia
|
|
Sjeverna
Makedonija2)
|
37
|
36
|
37
|
42
|
41
|
41
|
North
Macedonia2)
|
|
Albanija
|
29
|
30
|
31
|
37
|
38
|
39
|
Albania
|
|
|
|
|
|
|
|
|
|
|
Zemlja
potencijalna kandidatkinja
za članstvo u EU
|
|
|
|
|
|
|
EU
Potential Candidate Country
|
|
Bosna
i Hercegovina (BiH)
|
31
|
31
|
31
|
41
|
40
|
41
|
Bosnia
and Herzegovina (BiH)
|
|
1)
|
Zemlje
su poredane po razini SIP-a po stanovniku u 2018. Zemlje s jednakom
vrijednošću poredane su prema protokolarnom redoslijedu.
|
|
2)
|
Republika
Hrvatska od 15. veljače 2019. godine u svim oblicima službene
komunikacije upotrebljava ime Republika Sjeverna Makedonija.
|
|
1)
|
Countries are ranked according to AIC per
capita in 2018. Countries with the same value are ranked by protocol order.
|
|
2)
|
As of 15 February 2019, the Republic of
Croatia uses the name Republic of North Macedonia in all forms of public
communication
|
METODOLOŠKA
OBJAŠNJENJA
|
|
NOTES
ON METHODOLOGY
|
|
|
|
|
|
|
|
|
|
Izvori podataka
|
|
Data
sources
|
|
|
|
|
|
Podaci o PKM-u, BDP-u i SKM-u, indeksi obujma i podaci o
stanovništvu objavljeni su na Eurostatovoj internetskoj stranici u odjeljku
National Accounts (including GDP), pododjeljku Annual national
accounts, te u Eurostatovoj bazi podataka (Tables by themes, Economy and finance, National accounts
(including GDP), Annual national accounts, GDP per capita in PPPs).
|
|
The
data on PPP, GDP in PPS, volume indices and population figures are
published on the Eurostat website under the domain National Accounts
(including GDP), collection Annual national accounts, as well as in Eurostat database
(Tables by themes, Economy and finance, National accounts (including GDP),
Annual national accounts, GDP per capita in PPPs).
|
|
|
|
|
|
Eurostat
također objavljuje PKM-ove i iz njih izvedene pokazatelje na
internetskoj stranici Statistics Explained (Economy and finance,
Comparative price levels (PPPs)).
|
|
Eurostat
also publishes PPPs and derived indicators on the website Statistics
Explained (Economy and finance, Comparative price levels
(PPPs)).
|
|
|
|
|
|
|
|
|
|
Definicije i
objašnjenja
|
|
Definitions
and explanations
|
|
|
|
|
|
PKM-ovi su pokazatelji
razlike u razini cijena u pojedinim zemljama. Oni označavaju koliko
valutnih jedinica košta određena količina robe i usluga u
različitim zemljama. PKM-ovi se mogu koristiti kao stope konverzije
valuta za pretvaranje rashoda izraženih u nacionalnim valutama u umjetnu
zajedničku valutu (SKM), čime se eliminira učinak razlika u
razini cijena u pojedinim zemljama.
|
|
PPPs
are indicators of differences in price levels across countries. They
indicate how much currency units cost a certain amount of goods and
services in different countries. PPPs can be used as currency conversion
rates to convert expenditures denominated in national currencies into
artificial common currency (PPS), thus eliminating the effect of price
differentials in individual countries.
|
|
|
|
|
|
SKM je jedinica
umjetne valute koja eliminira razlike u razinama cijena među zemljama.
Na taj način jedna jedinca SKM-a kupuje istu količinu roba i
usluga u svim zemljama. Ta jedinica omogućuje usporedbu obujma
ekonomskih pokazatelja u zemljama. Agregati izraženi u SKM-u izvode se dijeljenjem
agregata u tekućim cijenama izraženim u nacionalnoj valuti s
pripadajućim PKM-om.
|
|
PPS is
an artificial reference currency unit that eliminates differences in the price
levels among countries. Thus, one PPS buys the same amount of goods and
services in all countries. That unit allows a comparison of the volume of economic
indicators across countries. Aggregates expressed in PPS are derived by
dividing the aggregates in current prices denominated in the national currency
by the respective PPP.
|
|
|
|
|
|
PPP i BDP u SKM-u
rezultat su multilateralnog statističkog istraživanja. Njegova je specifičnost
u usporedbi s drugim statističkim istraživanjima to da rezultate
izračunava međunarodni koordinator. Naime, nijedna od zemalja
sudionica ne može proizvesti rezultate samostalno. Druga specifičnost
je međusobna ovisnost rezultata među zemljama. Promjena podataka
jedne zemlje ne utječe samo na rezultate te zemlje, već
utječe, manje ili više, i na rezultate drugih zemalja.
|
|
PPP and
GDP in PPS are the results of a multilateral statistical survey. Its
specific feature compared to other statistical surveys is that the results
are calculated by the international coordinator. Specifically, none of the
participating countries can produce the results independently. The second
specific feature is inter-dependency of the results among countries. A
change in the data of one country does not influence only the results of
this country, but influences, more or less, the results of the other countries
as well.
|
|
|
|
|
|
Rezultati se
temelje na procjenama BDP-a za 2018. i posljednjim raspoloživim podacima o
PKM-u.
|
|
The
results are based on the latest GDP data for 2018 and the most recent PPPs
available.
|
|
|
|
|
|
PKM-ovi se koriste
za generiranje indeksa cijena i obujma koji su potrebni za ekonomska
istraživanja i analize koje uključuju usporedbe BDP-a i izdataka za
BDP među zemljama. Indeksi obujma koriste se za usporedbu veličine
ekonomije i razine materijalnog blagostanja ekonomija, potrošnje,
investicija, državne potrošnje i ukupne produktivnosti. Indeksi cijena
koriste se kako bi se usporedile razine cijena, strukture cijena,
konvergencija cijena i konkurentnost.
|
|
PPPs
are used to generate the price and volume indices that are needed for
economic research and analyses that include the comparisons of GDP and GDP
expenditure across countries. Volume indices are used to compare the size
of the economy and the level of material well-being of economies,
consumption, investment, government spending and overall productivity.
Price indices are used to compare price levels, price structures, price
convergence and competitiveness.
|
|
|
|
|
|
Uz istraživanje i
analizu, PKM i realni izdaci koji se dobivaju korištenjem PKM-a koriste se
za izračun statističkih podataka. Međunarodne organizacije
agregiraju realni BDP i njegove sastavnice za zemlje kako bi se dobile
ukupne vrijednosti za skupine zemalja, kao što je Europska Unija ili OECD.
Međunarodne organizacije također koriste udjele zemalja u svim
ukupnim vrijednostima kao pondere kad se ekonomski pokazatelji kao što su
indeksi cijena ili stope rasta kombiniraju kako bi se dobili prosjeci za
skupine zemalja.
|
|
In
addition to research and analysis, PPPs and real expenditures derived from
PPPs are used for statistical calculation. International organisations
aggregate real GDP and its components across countries to produce totals
for groups of countries, such as the European Union or the OECD.
International organisations also use country shares in all totals as
weights when economic indicators such as price indices or growth rates are
combined to obtain averages for country groups.
|
|
|
|
|
|
PKM-ovi se koriste
i u administrativne svrhe. Europska komisija koristi PKM kada alocira
sredstva iz Strukturnih fondova državama članicama. Strukturni fondovi
osnovani su kako bi se smanjile ekonomske razlike među državama
članicama. Glavni pokazatelj koji određuje može li se regija
prijaviti za dobivanje sredstava iz Strukturnih fondova je regionalni BPD po
stanovniku unutar zemlje koji je deflacioniran korištenjem PKM-a.
Međunarodni monetarni fond (MMF) koristi PKM kada donosi odluku o
kvoti svojih članica. Kvota zemlje, između ostalog, određuje
financijska sredstva koje je zemlja obvezna uplatiti MMF-u.
|
|
PPPs
are also used for administrative purposes. The European Commission uses the
PPP when allocating Structural Funds to Member States. Structural funds
have been set up to reduce economic disparities between Member States. The
main indicator that determines whether a region can apply for funding from
the Structural Funds is the regional BPD per capita within the country,
which is deflated by the use of PPPs. The International Monetary Fund (IMF)
uses the PPPs when deciding on its members' quota. The country's quota
determines, among other things, the financial resources that the country is
obliged to pay to the IMF.
|
|
|
|
|
|
|
|
|
|
Geografski podaci
|
|
Geographical
information
|
|
|
|
|
|
Europska unija (EU-28)
uključuje Belgiju, Bugarsku, Dansku, Češku Republiku,
Njemačku, Estoniju, Irsku, Grčku, Španjolsku, Francusku,
Hrvatsku, Italiju, Cipar, Letoniju, Litvu, Luksemburg, Mađarsku,
Maltu, Nizozemsku, Austriju, Poljsku, Portugal, Rumunjsku, Sloveniju,
Slovačku, Finsku, Švedsku i Ujedinjeno Kraljevstvo.
|
|
The European
Union (EU-28) includes Belgium, Bulgaria, Denmark, Czech Republic, Germany,
Estonia, Ireland, Greece, Spain, France, Croatia, Italy, Cyprus, Latvia,
Lithuania, Luxembourg, Hungary, Malta, the Netherlands, Austria, Poland,
Portugal, Romania, Slovenia, Slovakia, Finland, Sweden and the United
Kingdom.
|
|
|
|
|
|
Eurozona (EA-19)
obuhvaća Belgiju, Njemačku, Estoniju, Irsku, Grčku,
Španjolsku, Francusku, Italiju, Cipar, Letoniju, Litvu, Luksemburg, Maltu,
Nizozemsku, Austriju, Portugal, Sloveniju, Slovačku i Finsku.
|
|
The euro
area (EA-19) consists of Belgium, Germany, Estonia, Ireland, Greece, Spain,
France, Italy, Cyprus, Latvia, Lithuania, Luxembourg, Malta, the
Netherlands, Austria, Portugal, Slovenia, Slovakia and Finland.
|
|
|
|
|
|
|
|
|
|
Pravna osnova
|
|
Legal
basis
|
|
|
|
|
|
-
|
Uredba (EZ) br. 1445/2007
Europskog parlamenta i Vijeća od 11. prosinca 2007. o uspostavi
zajedničkih pravila za pružanje osnovnih informacija o paritetima
kupovne moći te za njihov izračun i diseminaciju
|
|
-
|
Regulation
(EC) No 1445/2007 of the European Parliament and of the Council of 11
December 2007 establishing common rules for the provision of basic
information on Purchasing Power Parities and for their calculation and
dissemination
|
|
|
|
|
|
|
|
-
|
Uredba Komisije
(EU) 2015/1163 оd 15. srpnja 2015. o provedbi Uredbe (EZ) br.
1445/2007 Europskog parlamenta i Vijeća u pogledu popisa osnovnih
kategorija s obzirom na paritete kupovne moći
|
|
-
|
Commission
Regulation (EU) 2015/1163 of 15 July 2015 implementing Regulation (EC) No
1445/2007 of the European Parliament and of the Council as regards the list
of basic headings used for Purchasing Power Parities
|
|
|
|
|
|
|
|
|
|
Kratice
|
|
Abbreviations
|
|
|
|
|
|
|
|
EFTA
|
Europsko udruženje
za slobodnu trgovinu
|
|
EC
|
European Community
|
|
EU
|
Europska unija
|
|
EFTA
|
European Free
Trade Association
|
|
Eurostat
|
Statistički
ured Europske unije
|
|
EU
|
European Union
|
|
EZ
|
Europska Zajednica
|
|
Eurostat
|
Statistical Office
of the European Communities
|
|
|
|
|
|
|
|
|
Objavljuje
i tiska Državni zavod za statistiku Republike Hrvatske, Zagreb, Ilica 3, p.
p. 80.
Published
and printed by the Croatian Bureau of Statistics, Zagreb, Ilica 3, P. O. B.
80
Telefon/ Phone:
+385 (0) 1 4806-111, telefaks/ Fax: +385 (0) 1 4817-666
Novinarski
upiti/
Press corner: press@dzs.hr
Odgovorne
osobe:
Persons
responsible:
Suzana Šamec,
načelnica Sektora makroekonomskih statistika
Suzana
Šamec, Director of Macroecomomic Statistics Directorate
Lidija
Brković, glavna ravnateljica
Lidija Brković, Director General
Priredili:
Suzana Čajkušić i Mirjana Lepušić
Prepared
by: Suzana Čajkušić and Mirjana Lepušić
|
|
MOLIMO KORISNIKE DA PRI
KORIŠTENJU PODATAKA NAVEDU IZVOR.
USERS
ARE KINDLY REQUESTED TO STATE THE SOURCE.
|
|
Naklada:
20 primjeraka
20 copies
printed
Podaci iz
ovog Priopćenja objavljuju se i na internetu.
First
Release data are also published on the Internet.
Služba za
odnose s korisnicima i zaštitu podataka
Customer
Relations and Data Protection Department
|
Informacije
i korisnički zahtjevi
Information
and user requests
|
|
Pretplata publikacija
Subscription
|
|
|
|
|
|
Telefon/ Phone:
+385 (0) 1 4806-138, 4806-154
Elektronička
pošta/ E-mail: stat.info@dzs.hr
Telefaks/
Fax: +385 (0) 1 4806-148
|
|
Telefon/
Phone: +385 (0) 1 4806-115
Elektronička
pošta/ E-mail: prodaja@dzs.hr
Telefaks/ Fax: +385 (0) 1 4806-148
|
|