|

|
GODINA/ YEAR: LVIII.
|
ZAGREB,
9. LIPNJA 2021./ 9 JUNE, 2021
|
BROJ/ NUMBER:
4.2.1/3.
|
CODEN POPCEA ISSN 1330-0350
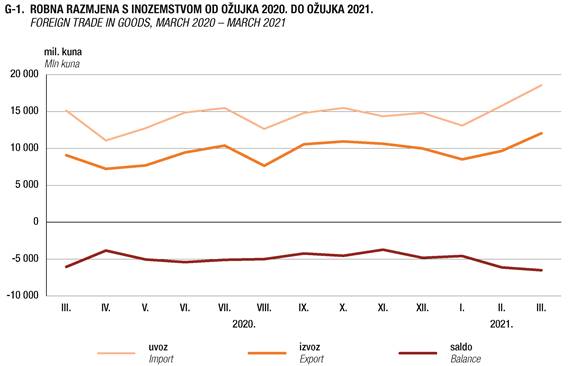
ROBNA
RAZMJENA REPUBLIKE HRVATSKE S INOZEMSTVOM − privremeni podaci
od siječnja do ožujka 2021. i od siječnja do travnja 2021.
FOREIGN TRADE IN GOODS OF THE
REPUBLIC OF CROATIA − Provisional Data
January – March 2021 and January – April 2021
|
Ukupan
izvoz Republike Hrvatske od siječnja do ožujka 2021., prema privremenim
podacima, iznosio je 30,2 milijarde kuna. Istodobno je uvoz iznosio 47,4
milijarde kuna. Vanjskotrgovinski deficit iznosio je 17,2 milijarde kuna.
|
|
According
to provisional data, from January to March 2021, total export of the
Republic of Croatia amounted to 30.2 billion kuna. At the same time, total
import was 47.4 billion kuna. Foreign trade deficit amounted to 17.2
billion kuna.
|
|
|
|
|
|
Pokrivenost
uvoza izvozom od siječnja do ožujka 2021. bila je 63,7%.
|
|
In
the period from January to March 2021, coverage of import by export was
63.7%.
|
|
|
|
|
|
Ukupan
izvoz Republike Hrvatske od siječnja do travnja 2021., prema Prvim
rezultatima, iznosio je 41,6 milijardi kuna, dok je uvoz iznosio 64,2
milijarde kuna. Vanjskotrgovinski deficit iznosio je 22,7 milijardi kuna.
|
|
According
to the First Results, in the period from January to April 2021, total
export of the Republic of Croatia amounted to 41.6 billion kuna, while
total import was 64.2 billion kuna. Foreign trade deficit amounted to 22.7
billion kuna.
|
|
|
|
|
|
Pokrivenost
uvoza izvozom od siječnja do travnja 2021., prema
Prvim rezultatima, bila je 64,7%.
|
|
According
to the First Results, coverage of import by export was 64.7% in the period
from January to April 2021.
|
1. ROBNA
RAZMJENA REPUBLIKE HRVATSKE S INOZEMSTVOM
FOREIGN
TRADE IN GOODS OF THE REPUBLIC OF CROATIA
|
|
Izvoz
Export
|
Uvoz
Import
|
Saldo robne
razmjene
Balance of foreign trade in goods
|
Pokrivenost
uvoza izvozom, %
Coverage of import by export, %
|
|
tis. kuna
Thousand
kuna
|
tis. eura
Thousand
euros
|
tis. USD
Thousand US
$
|
tis. kuna
Thousand
kuna
|
tis. eura
Thousand
euros
|
tis. USD
Thousand US
$
|
tis. kuna
Thousand
kuna
|
tis. eura
Thousand
euros
|
tis. USD
Thousand US
$
|
|
|
|
|
|
|
|
|
|
|
|
|
|
2020.
|
|
|
|
|
|
|
|
|
|
|
|
I.
|
8
694 772
|
1
168 060
|
1
308 115
|
14
372 383
|
1
930 499
|
2
163 169
|
-5
677 611
|
-762
440
|
-855
054
|
60,5
|
|
II.
|
9
645 029
|
1
297 130
|
1
434 031
|
16
006 581
|
2
152 595
|
2
377 119
|
-6
361 552
|
-855
466
|
-943
088
|
60,3
|
|
III.
|
9
079 665
|
1
218 182
|
1
336 181
|
15
122 617
|
2
028 555
|
2
230 559
|
-6
042 952
|
-810
373
|
-894
377
|
60,0
|
|
IV.
|
7
233 185
|
951
210
|
1
045 562
|
11
069 727
|
1
454 976
|
1
598 394
|
-3
836 542
|
-503
767
|
-552
831
|
65,3
|
|
V.
|
7
694 795
|
1
018 831
|
1
106 279
|
12
739 325
|
1
686 533
|
1
831 715
|
-5
044 530
|
-667
703
|
-725
436
|
60,4
|
|
VI.
|
9
454 061
|
1
248 035
|
1
382 034
|
14
860 449
|
1
961 037
|
2
175 267
|
-5
406 388
|
-713
002
|
-793
233
|
63,6
|
|
VII.
|
10
384 857
|
1
373 672
|
1
544 735
|
15
479 964
|
2
047 524
|
2
299 133
|
-5
095 107
|
-673
852
|
-754
398
|
67,1
|
|
VIII.
|
7
646 180
|
1
020 084
|
1
210 737
|
12
641 948
|
1
687 472
|
2
002 032
|
-4
995 768
|
-667
388
|
-791
295
|
60,5
|
|
IX.
|
10
560 807
|
1
404 277
|
1
672 524
|
14
796 240
|
1
967 500
|
2
343 673
|
-4
235 433
|
-563
223
|
-671
149
|
71,4
|
|
X.
|
10
944 588
|
1
450 972
|
1
699 948
|
15
483 318
|
2
052 343
|
2
403 863
|
-4
538 730
|
-601
370
|
-703
915
|
70,7
|
|
XI.
|
10
636 927
|
1
405 045
|
1
645 322
|
14
354 376
|
1
896 351
|
2
217 686
|
-3
717 449
|
-491
306
|
-572
364
|
74,1
|
|
XII.
|
9
990 547
|
1
322 407
|
1
579 919
|
14
808 829
|
1
960 530
|
2
344 176
|
-4
818 282
|
-638
123
|
-764
257
|
67,5
|
|
I.
– XII.
|
111
965 411
|
14
877 905
|
16
965 388
|
171
735 757
|
22
825 916
|
25
986 785
|
-59
770 346
|
-7
948 011
|
-9
021 397
|
65,2
|
|
|
|
|
|
|
|
|
|
|
|
|
|
2021.
|
|
|
|
|
|
|
|
|
|
|
|
I.
|
8
515 919
|
1
129 665
|
1
385 253
|
13
088 484
|
1
735 893
|
2
129 693
|
-4
572 565
|
-606
228
|
-744
440
|
65,1
|
|
II.
|
9
661 258
|
1
278 863
|
1
551 233
|
15
782 530
|
2
088 892
|
2
533 855
|
-6
121 272
|
-810
030
|
-982
622
|
61,2
|
|
III.
|
12
052 642
|
1
591 678
|
1
923 394
|
18
556 881
|
2
450 312
|
2
957 827
|
-6
504 239
|
-858
634
|
-1
034 433
|
64,9
|
|
I.
– III.
|
30
229 818
|
4
000 206
|
4
859 881
|
47
427 895
|
6
275 097
|
7
621 375
|
-17
198 076
|
-2
274 891
|
-2
761 495
|
63,7
|
I. ROBNA
RAZMJENA REPUBLIKE HRVATSKE S INOZEMSTVOM U KUNAMA
FOREIGN
TRADE IN GOODS OF THE REPUBLIC OF CROATIA, KUNA
1. IZVOZ
I UVOZ PREMA NKD-u 2007.
EXPORT
AND IMPORT, ACCORDING TO NKD 2007.
tis. kuna
Thousand kuna
|
|
|
|
Izvoz
Export
|
Uvoz
Import
|
|
|
|
|
|
|
|
I.
– III. 2020.
|
I.
– III. 2021.
|
indeksi
Indices
I.
– III. 2021.
I.
– III. 2020.
|
I.
– III. 2020.
|
I.
– III. 2021.
|
indeksi
Indices
I.
– III. 2021.
I.
– III. 2020.
|
|
|
|
|
|
|
|
|
|
|
|
|
|
|
|
|
|
|
|
Ukupno
|
27 419 465
|
30 229 818
|
110,2
|
45 501 580
|
47 427 895
|
104,2
|
|
|
Total
|
|
|
|
|
|
|
|
|
|
|
|
|
|
|
A
|
|
Poljoprivreda,
šumarstvo i ribarstvo
|
1 527 353
|
1 864 822
|
122,1
|
1 505 440
|
1 551 139
|
103,0
|
A
|
|
Agriculture,
forestry and fishing
|
|
|
|
|
|
|
|
|
|
|
|
|
|
|
B
|
|
Rudarstvo
i vađenje
|
1 208 556
|
1 826 886
|
151,2
|
1 658 270
|
2 049 276
|
123,6
|
B
|
|
Mining
and quarrying
|
|
|
|
|
|
|
|
|
|
|
|
|
|
|
C
|
|
Prerađivačka
industrija
|
23
683 642
|
25
146 127
|
106,2
|
41
344 534
|
42
594 548
|
103,0
|
C
|
|
Manufacturing
|
|
|
10
|
Proizvodnja
prehrambenih proizvoda
|
2
256 724
|
2
408 629
|
106,7
|
4
212 198
|
4
127 817
|
98,0
|
|
10
|
Manufacture
of food products
|
|
|
11
|
Proizvodnja
pića
|
241
233
|
249
561
|
103,5
|
408
566
|
387
574
|
94,9
|
|
11
|
Manufacture
of beverages
|
|
|
12
|
Proizvodnja
duhanskih proizvoda
|
285
557
|
296
439
|
103,8
|
257
145
|
265
700
|
103,3
|
|
12
|
Manufacture
of tobacco products
|
|
|
13
|
Proizvodnja
tekstila
|
326
592
|
326
177
|
99,9
|
865
803
|
775
004
|
89,5
|
|
13
|
Manufacture
of textiles
|
|
|
14
|
Proizvodnja
odjeće
|
1
015 146
|
1
120 039
|
110,3
|
1
959 128
|
2
069 170
|
105,6
|
|
14
|
Manufacture
of wearing apparel
|
|
|
15
|
Proizvodnja
kože i srodnih proizvoda
|
871
938
|
828
727
|
95,0
|
1
233 163
|
1
235 613
|
100,2
|
|
15
|
Manufacture
of leather and related products
|
|
|
16
|
Prerada
drva i proizvoda od drva i pluta, osim namještaja; proizvodnja proizvoda od
slame i pletarskih materijala
|
1
367 205
|
1
593 574
|
116,6
|
664
342
|
677
427
|
102,0
|
|
16
|
Manufacture
of wood and of products of wood and cork, except furniture; manufacture of
articles of straw and plaiting materials
|
|
|
17
|
Proizvodnja
papira i proizvoda od papira
|
546
930
|
580
448
|
106,1
|
993
448
|
961
017
|
96,7
|
|
17
|
Manufacture
of paper and paper products
|
|
|
18
|
Tiskanje i
umnožavanje snimljenih zapisa
|
3
834
|
3
628
|
94,6
|
2
834
|
4
943
|
174,4
|
|
18
|
Printing
and reproduction of recorded media
|
|
|
19
|
Proizvodnja
koksa i rafiniranih naftnih proizvoda
|
954
141
|
852
413
|
89,3
|
2
175 774
|
1
931 001
|
88,8
|
|
19
|
Manufacture
of coke and refined petroleum products
|
|
|
20
|
Proizvodnja
kemikalija i kemijskih proizvoda
|
1
642 149
|
1
551 861
|
94,5
|
3
897 595
|
4
191 065
|
107,5
|
|
20
|
Manufacture
of chemicals and chemical products
|
|
|
21
|
Proizvodnja
osnovnih farmaceutskih proizvoda i farmaceutskih pripravaka
|
1
594 398
|
2
148 354
|
134,7
|
3
579 750
|
3
129 111
|
87,4
|
|
21
|
Manufacture
of basic pharmaceutical products and pharmaceutical preparations
|
|
|
22
|
Proizvodnja
proizvoda od gume i plastike
|
905
639
|
1
054 740
|
116,5
|
1
945 092
|
2
277 335
|
117,1
|
|
22
|
Manufacture
of rubber and plastic products
|
|
|
23
|
Proizvodnja
ostalih nemetalnih mineralnih proizvoda
|
927
930
|
988
038
|
106,5
|
910
892
|
924
529
|
101,5
|
|
23
|
Manufacture
of other non-metallic mineral products
|
|
|
24
|
Proizvodnja
metala
|
981
261
|
1
278 306
|
130,3
|
2
522 112
|
3
038 420
|
120,5
|
|
24
|
Manufacture
of basic metals
|
|
|
25
|
Proizvodnja
gotovih metalnih proizvoda, osim strojeva i opreme
|
1
783 237
|
1
991 560
|
111,7
|
1
777 685
|
1
980 823
|
111,4
|
|
25
|
Manufacture
of fabricated metal products, except machinery and equipment
|
|
|
26
|
Proizvodnja
računala te elektroničkih i optičkih proizvoda
|
944
098
|
960
018
|
101,7
|
2
562 523
|
2
868 452
|
111,9
|
|
26
|
Manufacture
of computer, electronic and optical products
|
|
|
27
|
Proizvodnja
električne opreme
|
2
054 633
|
2
342 641
|
114,0
|
2
135 628
|
2
701 991
|
126,5
|
|
27
|
Manufacture
of electrical equipment
|
|
|
28
|
Proizvodnja
strojeva i uređaja, d. n.
|
1
637 989
|
1
812 924
|
110,7
|
3
594 660
|
3
603 390
|
100,2
|
|
28
|
Manufacture
of machinery and equipment n. e. c.
|
|
|
29
|
Proizvodnja
motornih vozila, prikolica i poluprikolica
|
1
342 143
|
1
266 100
|
94,3
|
3
395 990
|
3
245 258
|
95,6
|
|
29
|
Manufacture
of motor vehicles, trailers and semi-trailers
|
|
|
30
|
Proizvodnja
ostalih prijevoznih sredstava
|
1
207 538
|
569
663
|
47,2
|
543
612
|
388
854
|
71,5
|
|
30
|
Manufacture
of other transport equipment
|
|
|
31
|
Proizvodnja
namještaja
|
495
219
|
546
888
|
110,4
|
673
318
|
743
965
|
110,5
|
|
31
|
Manufacture
of furniture
|
|
|
32
|
Ostala
prerađivačka industrija
|
298
108
|
375
398
|
125,9
|
1
033 278
|
1
066 089
|
103,2
|
|
32
|
Other
manufacturing
|
|
|
|
|
|
|
|
|
|
|
|
|
|
|
D
|
|
Opskrba
električnom energijom, plinom, parom i klimatizacija
|
417
342
|
487
042
|
116,7
|
775
237
|
781
878
|
100,9
|
D
|
|
Electricity,
gas, steam and air conditioning supply
|
|
|
|
|
|
|
|
|
|
|
|
|
|
|
E
|
|
Opskrba
vodom; uklanjanje otpadnih voda, gospodarenje otpadom te djelatnosti
sanacije okoliša
|
453
040
|
776
617
|
171,4
|
94
463
|
346
528
|
366,8
|
E
|
|
Water
supply; sewerage, waste management and remediation activities
|
|
|
|
|
|
|
|
|
|
|
|
|
|
|
J
|
|
Informacije
i komunikacije
|
105
243
|
118
438
|
112,5
|
117
242
|
97
028
|
82,8
|
J
|
|
Information
and communication
|
|
|
|
|
|
|
|
|
|
|
|
|
|
|
M
|
|
Stručne,
znanstvene i tehničke djelatnosti
|
121
|
5
|
4,0
|
303
|
134
|
44,3
|
M
|
|
Professional,
scientific and technical activities
|
|
|
|
|
|
|
|
|
|
|
|
|
|
|
R
|
|
Umjetnost,
zabava i rekreacija
|
671
|
738
|
110,0
|
792
|
926
|
116,9
|
R
|
|
Arts,
entertainment and recreation
|
|
|
|
|
|
|
|
|
|
|
|
|
|
|
|
|
Neraspoređeno
|
23
496
|
9
144
|
38,9
|
5
300
|
6
437
|
121,4
|
|
|
Not
classified
|
2. IZVOZ
I UVOZ PO SEKTORIMA SMTK
EXPORT
AND IMPORT, ACCORDING TO SITC SECTIONS
tis. kuna
Thousand kuna
|
|
|
Izvoz
Export
|
Uvoz
Import
|
|
|
|
|
|
I.
– III. 2020.
|
I.
– III. 2021.
|
indeksi
Indices
I.
– III. 2021.
I.
– III. 2020.
|
I.
– III. 2020.
|
I.
– III. 2021.
|
indeksi
Indices
I.
– III. 2021.
I.
– III. 2020.
|
|
|
|
|
|
|
|
|
|
|
|
|
|
|
|
Ukupno
|
27
419 465
|
30
229 818
|
110,2
|
45
501 580
|
47
427 895
|
104,2
|
|
Total
|
|
|
|
|
|
|
|
|
|
|
|
|
0
|
Hrana i žive životinje
|
3
220 735
|
3
676 371
|
114,1
|
5
149 948
|
5
044 986
|
98,0
|
0
|
Food and live animals
|
|
1
|
Pića i duhan
|
516
300
|
534
691
|
103,6
|
671
194
|
661
110
|
98,5
|
1
|
Beverages and tobacco
|
|
2
|
Sirove materije, osim goriva
|
2
016 859
|
2
401 041
|
119,0
|
821
005
|
1
117 568
|
136,1
|
2
|
Crude materials, except fuels
|
|
3
|
Mineralna goriva i maziva
|
2
448 778
|
3
010 305
|
122,9
|
4
614 927
|
4
812 081
|
104,3
|
3
|
Mineral fuels and lubricants
|
|
4
|
Životinjska i biljna ulja i masti
|
116
750
|
183
555
|
157,2
|
201
328
|
229
519
|
114,0
|
4
|
Animal and vegetable oils and fats
|
|
5
|
Kemijski proizvodi
|
3
544 077
|
4
074 610
|
115,0
|
7
966 542
|
7
843 911
|
98,5
|
5
|
Chemical products
|
|
6
|
Proizvodi svrstani prema materijalu
|
4
700 981
|
5
326 950
|
113,3
|
8
091 039
|
8
732 482
|
107,9
|
6
|
Manufactured goods classified chiefly by material
|
|
7
|
Strojevi i prijevozna sredstva
|
7
163 561
|
6
771 592
|
94,5
|
11
586 163
|
12
182 557
|
105,1
|
7
|
Machinery and transport equipment
|
|
8
|
Razni gotovi proizvodi
|
3
576 974
|
4
082 598
|
114,1
|
6
345 988
|
6
740 309
|
106,2
|
8
|
Miscellaneous manufactured articles
|
|
9
|
Proizvodi i transakcije, d. n.
|
90
955
|
158
960
|
174,8
|
48
146
|
56
934
|
118,3
|
9
|
Commodities and transactions, n. e. s.
|
|
|
Neraspoređeno
|
23
496
|
9
144
|
38,9
|
5
300
|
6
437
|
121,4
|
|
Not classified
|
3. IZVOZ
I UVOZ PREMA EKONOMSKIM GRUPACIJAMA ZEMALJA
EXPORT
AND IMPORT, ACCORDING TO ECONOMIC CLASSIFICATION OF COUNTRIES
tis. kuna
Thousand kuna
|
|
Izvoz
Export
|
Uvoz
Import
|
|
|
|
I.
– III. 2020.
|
I.
– III. 2021.
|
indeksi
Indices
I.
– III. 2021.
I.
– III. 2020.
|
I.
– III. 2020.
|
I.
– III. 2021.
|
indeksi
Indices
I.
– III. 2021.
I.
– III. 2020.
|
|
|
|
|
|
|
|
|
|
|
|
Ukupno
|
27 419 465
|
30 229 818
|
110,2
|
45 501 580
|
47 427 895
|
104,2
|
Total
|
|
|
|
|
|
|
|
|
|
|
Države članice EU-a1)
|
18
996 713
|
20
838 598
|
109,7
|
36
766 294
|
37
698 560
|
102,5
|
EU Member States1)
|
|
Austrija
|
1
624 334
|
1
720 961
|
105,9
|
3
125 376
|
3
237 225
|
103,6
|
Austria
|
|
Belgija
|
491
784
|
443
105
|
90,1
|
1
512 789
|
1
109 936
|
73,4
|
Belgium
|
|
Bugarska
|
182
453
|
196
854
|
107,9
|
277
677
|
653
193
|
235,2
|
Bulgaria
|
|
Cipar
|
10
514
|
34
987
|
332,8
|
38
455
|
16
925
|
44,0
|
Cyprus
|
|
Češka
|
475
546
|
485
270
|
102,0
|
1
168 453
|
1
235 928
|
105,8
|
Czech Republic
|
|
Danska
|
111
773
|
161
887
|
144,8
|
254
825
|
287
677
|
112,9
|
Denmark
|
|
Estonija
|
27
635
|
21
983
|
79,5
|
10
620
|
12
348
|
116,3
|
Estonia
|
|
Finska
|
37
556
|
53
250
|
141,8
|
59
354
|
59
121
|
99,6
|
Finland
|
|
Francuska
|
760
669
|
856
321
|
112,6
|
1
343 873
|
1
249 472
|
93,0
|
France
|
|
Grčka
|
105
685
|
136
961
|
129,6
|
317
348
|
516
014
|
162,6
|
Greece
|
|
Irska
|
36
267
|
97
698
|
269,4
|
116
493
|
185
801
|
159,5
|
Ireland
|
|
Italija
|
3
164 679
|
3
935 499
|
124,4
|
5
862 603
|
5
952 700
|
101,5
|
Italy
|
|
Letonija
|
22
526
|
21
462
|
95,3
|
25
401
|
21
944
|
86,4
|
Latvia
|
|
Litva
|
82
584
|
96
618
|
117,0
|
81
270
|
83
413
|
102,6
|
Lithuania
|
|
Luksemburg
|
804
468
|
25
808
|
3,2
|
20
488
|
31
808
|
155,3
|
Luxembourg
|
|
Mađarska
|
1
992 154
|
2
702 484
|
135,7
|
3
779 896
|
3
687 075
|
97,5
|
Hungary
|
|
Malta
|
27
763
|
59
395
|
213,9
|
12
541
|
9
929
|
79,2
|
Malta
|
|
Nizozemska
|
380
015
|
422
502
|
111,2
|
1
881 281
|
1
911 740
|
101,6
|
Netherlands
|
|
Njemačka
|
3
614 587
|
3
871 268
|
107,1
|
7
012 263
|
7
203 678
|
102,7
|
Germany
|
|
Poljska
|
502
498
|
634
253
|
126,2
|
1
712 600
|
1
926 122
|
112,5
|
Poland
|
|
Portugal
|
78
591
|
69
938
|
89,0
|
48
553
|
59
257
|
122,0
|
Portugal
|
|
Rumunjska
|
602
192
|
606
468
|
100,7
|
533
116
|
482
893
|
90,6
|
Romania
|
|
Sjeverna Irska
|
…
|
2
326
|
2)
|
…
|
13
417
|
2)
|
Northern Ireland
|
|
Slovačka
|
277
720
|
281
377
|
101,3
|
970
981
|
1
094 245
|
112,7
|
Slovakia
|
|
Slovenija
|
2
920 292
|
3
136 704
|
107,4
|
5
334 343
|
5
361 418
|
100,5
|
Slovenia
|
|
Španjolska
|
417
988
|
490
183
|
117,3
|
984
225
|
1
043 904
|
106,1
|
Spain
|
|
Švedska
|
240
304
|
268
515
|
111,7
|
281
397
|
251
235
|
89,3
|
Sweden
|
|
Neraspoređeno
|
4 134
|
4 519
|
109,3
|
73
|
143
|
195,1
|
Not classified
|
|
|
|
|
|
|
|
|
|
|
Zemlje Efte
|
448
206
|
655
486
|
146,2
|
389
288
|
353
405
|
90,8
|
EFTA countries
|
|
Island
|
1
053
|
2
909
|
276,2
|
163
|
46
|
28,0
|
Iceland
|
|
Lihtenštajn
|
816
|
26
855
|
3)
|
28
|
106
|
372,2
|
Liechtenstein
|
|
Norveška
|
79
008
|
160
693
|
203,4
|
29
564
|
21
177
|
71,6
|
Norway
|
|
Švicarska
|
367 329
|
465 029
|
126,6
|
359 533
|
332 078
|
92,4
|
Switzerland
|
|
|
|
|
|
|
|
|
|
|
Zemlje Cefte
|
4
446 434
|
4
567 713
|
102,7
|
2
463 800
|
3
097 493
|
125,7
|
CEFTA countries
|
|
Albanija
|
130
271
|
143
902
|
110,5
|
15
747
|
25
146
|
159,7
|
Albania
|
|
Bosna i Hercegovina
|
2
364 164
|
2
359 483
|
99,8
|
1
251 491
|
1
683 855
|
134,5
|
Bosnia and Herzegovina
|
|
Crna Gora
|
302
616
|
301
528
|
99,6
|
9
754
|
7
446
|
76,3
|
Montenegro
|
|
Kosovo
|
220
284
|
177
464
|
80,6
|
8
114
|
7
515
|
92,6
|
Kosovo
|
|
Moldavija
|
1
170
|
2
009
|
171,7
|
4
270
|
2
127
|
49,8
|
Moldova
|
|
Sjeverna Makedonija
|
234
780
|
235
494
|
100,3
|
143
537
|
145
809
|
101,6
|
North Macedonia
|
|
Srbija
|
1
193 150
|
1
347 833
|
113,0
|
1
030 887
|
1
225 596
|
118,9
|
Serbia
|
|
|
|
|
|
|
|
|
|
|
Zemlje OPEC-a
|
284
840
|
259
606
|
91,1
|
183
901
|
271
994
|
147,9
|
OPEC
countries
|
|
Alžir
|
12
127
|
5
403
|
44,6
|
31
155
|
62
370
|
200,2
|
Algeria
|
|
Angola
|
32
|
88
|
275,2
|
-
|
1
|
-
|
Angola
|
|
Ekvatorska Gvineja
|
305
|
-
|
-
|
-
|
-
|
-
|
Equatorial
Guinea
|
|
Gabon
|
560
|
313
|
55,9
|
-
|
154
|
-
|
Gabon
|
|
Irak
|
31
072
|
6
456
|
20,8
|
1
|
-
|
-
|
Iraq
|
|
Iran, Islamska Republika
|
5
544
|
7
641
|
137,8
|
4
496
|
6
989
|
155,4
|
Iran,
Islamic Republic of
|
|
Kongo
|
63
|
58
|
92,0
|
1
|
-
|
-
|
Congo
|
|
Kuvajt
|
14
612
|
7
926
|
54,2
|
301
|
5
|
1,6
|
Kuwait
|
|
Libija
|
16
787
|
19
226
|
114,5
|
335
|
55
180
|
3)
|
Libya
|
|
Nigerija
|
2
451
|
3
941
|
160,8
|
123
307
|
134
187
|
108,8
|
Nigeria
|
|
Saudijska Arabija
|
59
398
|
94
397
|
158,9
|
19
316
|
9
172
|
47,5
|
Saudi
Arabia
|
|
Ujedinjeni Arapski Emirati
|
141
888
|
114
055
|
80,4
|
4
981
|
3
049
|
61,2
|
United Arab
Emirates
|
|
Bolivarijanska Republika Venezuela
|
-
|
101
|
-
|
8
|
888
|
3)
|
Venezuela,
Bolivarian Republic of
|
|
|
|
|
|
|
|
|
|
|
Ostale europske zemlje
|
1
289 182
|
1
301 377
|
100,9
|
1
796 883
|
1
663 762
|
92,6
|
Other countries in Europe
|
|
Bjelorusija
|
71
554
|
32
621
|
45,6
|
7
425
|
26
842
|
361,5
|
Belarus
|
|
Rusija
|
246
577
|
289
336
|
117,3
|
367
072
|
639
463
|
174,2
|
Russian Federation
|
|
Turska
|
332
576
|
531
129
|
159,7
|
847
916
|
758
916
|
89,5
|
Turkey
|
|
Ujedinjena Kraljevina4)
|
516
852
|
308
995
|
59,8
|
509
649
|
163
328
|
32,0
|
United Kingdom4)
|
|
Ukrajina
|
120
617
|
138
623
|
114,9
|
64
324
|
74
306
|
115,5
|
Ukraine
|
|
Ostale zemlje
|
1 006
|
673
|
66,9
|
498
|
907
|
182,4
|
Other countries
|
|
|
|
|
|
|
|
|
|
|
Ostale azijske zemlje
|
786
768
|
960
275
|
122,1
|
3
181 069
|
3
423 797
|
107,6
|
Other
countries in Asia
|
|
Azerbajdžan
|
2
173
|
2
476
|
113,9
|
903
882
|
771
672
|
85,4
|
Azerbaijan
|
|
Bangladeš
|
398
|
3
327
|
835,2
|
23
904
|
20
369
|
85,2
|
Bangladesh
|
|
Filipini
|
12
220
|
3
132
|
25,6
|
3
170
|
2
059
|
64,9
|
Philippines
|
|
Hong Kong, Kina
|
19
199
|
87
399
|
455,2
|
2
332
|
2
552
|
109,4
|
Hong Kong,
China
|
|
Indija
|
46
522
|
93
335
|
200,6
|
368
758
|
243
472
|
66,0
|
India
|
|
Indonezija
|
5
396
|
5
219
|
96,7
|
39
286
|
49
422
|
125,8
|
Indonesia
|
|
Izrael
|
39
880
|
62
301
|
156,2
|
39
127
|
34
898
|
89,2
|
Israel
|
|
Japan
|
256
932
|
253
970
|
98,8
|
55
069
|
64
557
|
117,2
|
Japan
|
|
Katar
|
28
913
|
48
252
|
166,9
|
95
|
2
645
|
3)
|
Qatar
|
|
Kazahstan
|
37
005
|
27
227
|
73,6
|
3
046
|
32
827
|
3)
|
Kazakhstan
|
|
Kina
|
165
275
|
166
416
|
100,7
|
1
357 811
|
1
846 501
|
136,0
|
China
|
|
Koreja, Republika
|
19
569
|
17
687
|
90,4
|
112
994
|
100
713
|
89,1
|
Korea,
Republic of
|
|
Libanon
|
32
046
|
24
827
|
77,5
|
32
|
3
|
8,8
|
Lebanon
|
|
Malezija
|
7
732
|
22
876
|
295,9
|
18
144
|
37
280
|
205,5
|
Malaysia
|
|
Pakistan
|
3
317
|
1
281
|
38,6
|
22
320
|
16
164
|
72,4
|
Pakistan
|
|
Singapur
|
11
632
|
6
337
|
54,5
|
29
169
|
11
741
|
40,3
|
Singapore
|
|
Tajland
|
3
129
|
3
164
|
101,1
|
25
044
|
52
869
|
211,1
|
Thailand
|
|
Tajvan, Kina
|
3
520
|
58
277
|
3)
|
60
043
|
59
588
|
99,2
|
Taiwan,
China
|
|
Vijetnam
|
37
154
|
43
500
|
117,1
|
81
464
|
48
277
|
59,3
|
Viet Nam
|
|
Ostale zemlje
|
54 755
|
29 271
|
53,5
|
35 378
|
26 187
|
74,0
|
Other
countries
|
|
|
|
|
|
|
|
|
|
|
Ostale afričke zemlje
|
280
628
|
253
479
|
90,3
|
104
366
|
97
079
|
93,0
|
Other countries in Africa
|
|
Egipat
|
148
740
|
122
438
|
82,3
|
49
457
|
44
430
|
89,8
|
Egypt
|
|
Etiopija
|
7
394
|
12
332
|
166,8
|
9
872
|
1
394
|
14,1
|
Ethiopia
|
|
Južnoafrička Republika
|
9
079
|
23
585
|
259,8
|
6
018
|
6
462
|
107,4
|
South Africa
|
|
Maroko
|
54
817
|
39
354
|
71,8
|
21
894
|
22
101
|
100,9
|
Morocco
|
|
Tunis
|
2
009
|
10
465
|
520,9
|
3
503
|
5
977
|
170,6
|
Tunisia
|
|
Ostale zemlje
|
58 590
|
45 306
|
77,3
|
13 622
|
16 714
|
122,7
|
Other countries
|
|
|
|
|
|
|
|
|
|
|
Ostale američke zemlje
|
800
426
|
1
341 406
|
167,6
|
565
114
|
644
623
|
114,1
|
Other
countries in America
|
|
Argentina
|
1
233
|
2
276
|
184,6
|
20
820
|
14
125
|
67,8
|
Argentina
|
|
Brazil
|
9
437
|
14
904
|
157,9
|
36
014
|
17
222
|
47,8
|
Brazil
|
|
Kanada
|
53
761
|
89
843
|
167,1
|
35
854
|
19
894
|
55,5
|
Canada
|
|
Meksiko
|
19
215
|
14
488
|
75,4
|
9
051
|
31
190
|
344,6
|
Mexico
|
|
SAD
|
684
425
|
1
192 194
|
174,2
|
410
811
|
507
380
|
123,5
|
United States
|
|
Ostale zemlje
|
32 354
|
27 700
|
85,6
|
52 564
|
54 812
|
104,3
|
Other countries
|
|
|
|
|
|
|
|
|
|
|
Oceanijske zemlje
|
32
618
|
43
834
|
134,4
|
6
997
|
113
275
|
3)
|
Countries of Oceania
|
|
Australija
|
30
110
|
40
906
|
135,9
|
4
072
|
111
470
|
3)
|
Australia
|
|
Novi Zeland
|
1
661
|
2
034
|
122,4
|
968
|
1
805
|
186,5
|
New Zealand
|
|
Ostale zemlje
|
847
|
894
|
105,6
|
1 957
|
-
|
-
|
Other countries
|
|
|
|
|
|
|
|
|
|
|
Neraspoređeno
|
53 650
|
8 045
|
15,0
|
43 868
|
63 905
|
145,7
|
Not classified
|
1) Od
1. siječnja 2021. Ujedinjena Kraljevina prestala je biti država članica EU-a.
Protokol o Irskoj i Sjevernoj Irskoj omogućio je Sjevernoj Irskoj da i dalje
ostane sastavni dio carinskog teritorija Ujedinjene Kraljevine. Stoga su
podaci za Sjevernu Irsku uključeni u podatke o robnoj razmjeni s državama
članicama EU-a.
2) Indeks
se ne može iskazati.
3) Indeks je veći od 999.
4) Od
1. siječnja 2021. podaci za Ujedinjenu Kraljevinu ne uključuju podatke za
Sjevernu Irsku.
1) Since 1
January 2021, the United Kingdom has withdrawn from the European Union. The
Protocol on Ireland and Northern Ireland ensures that Northern Ireland
remains the constitutional part of the customs territory of the United
Kingdom. Therefore, the data for Northern Ireland are included in the data on
trade in goods with EU Member States.
2) The
index cannot be presented.
3) The index exceeds 999.
4) As
of 1 January 2021, the data for the United Kingdom do not include the data
for Northern Ireland.
4. PRVI
REZULTATI ROBNE
RAZMJENE REPUBLIKE HRVATSKE S INOZEMSTVOM
FIRST
RESULTS OF FOREIGN TRADE IN GOODS OF THE REPUBLIC OF
CROATIA
tis. kuna
Thousand kuna
|
|
I.
‒ IV. 2020.
|
I.
‒ IV. 2021.
|
Indeksi
Indices
I.
‒ IV. 2021.
I.
‒ IV. 2020.
|
|
|
|
|
|
|
|
|
Izvoz
|
34
652 650
|
41
558 995
|
119,9
|
Export
|
|
Države članice EU-a1)
|
23
823 867
|
27
945 780
|
117,3
|
EU Member
States1)
|
|
Države nečlanice EU-a2)
|
10
828 783
|
13
613 215
|
125,7
|
Non-EU
Member States2)
|
|
|
|
|
|
|
|
Uvoz
|
56
571 307
|
64
220 026
|
113,5
|
Import
|
|
Države članice EU-a1)
|
45
280 132
|
50
446 806
|
111,4
|
EU Member
States1)
|
|
Države nečlanice EU-a2)
|
11
291 176
|
13
773 220
|
122,0
|
Non-EU
Member States2)
|
|
|
|
|
|
|
|
Saldo robne razmjene
|
-21
918 657
|
-22
661 030
|
3)
|
Balance of foreign trade in goods
|
|
Pokrivenost uvoza izvozom, %
|
61,3
|
64,7
|
3)
|
Coverage of import by export, %
|
1) Od 1. siječnja 2021. Ujedinjena
Kraljevina prestala je biti država članica EU-a. Protokol o Irskoj i
Sjevernoj Irskoj omogućio je Sjevernoj Irskoj da i dalje ostane sastavni dio
carinskog teritorija Ujedinjene Kraljevine. Stoga su podaci za Sjevernu Irsku
uključeni u podatke o robnoj razmjeni s državama članicama EU-a.
2) Od
1. siječnja 2021. u podatke za države nečlanice EU-a uključeni su podaci za
Ujedinjenu Kraljevinu bez Sjeverne Irske.
3) Indeks
se ne iskazuje.
1) Since 1 January 2021, the United Kingdom
has withdrawn from the European Union. The Protocol on Ireland and Northern
Ireland ensures that Northern Ireland remains the constitutional part of the
customs territory of the United Kingdom. Therefore, the data for Northern
Ireland are included in the data on trade in goods with EU Member States.
2) As of 1
January 2021, the data for non-EU Member States include data for the United
Kingdom excluding Northern Ireland.
3) The
index is not presented.
II. ROBNA
RAZMJENA REPUBLIKE HRVATSKE S INOZEMSTVOM U EURIMA
FOREIGN
TRADE IN GOODS OF THE REPUBLIC OF CROATIA, EURO
1. PROSJEČNA
VRIJEDNOST EURA ZA REPUBLIKU HRVATSKU
AVERAGE
EXCHANGE RATE OF EURO IN THE REPUBLIC OF CROATIA
|
|
Izvoz
Export
|
Uvoz
Import
|
|
|
|
I.
– III. 2020.
|
I.
– III. 2021.
|
indeksi
Indices
I.
– III. 2021.
I.
– III. 2020.
|
I.
– III. 2020.
|
I.
– III. 2021.
|
indeksi
Indices
I.
– III. 2021.
I.
– III. 2020.
|
|
|
|
|
|
|
|
|
|
|
|
Prosječan tečaj 1 eura u
kunama
|
7,4441
|
7,5571
|
101,5
|
7,4451
|
7,5581
|
101,5
|
Average
exchange rate for 1 euro in kuna
|
2. IZVOZ
I UVOZ PREMA NKD-u 2007.
EXPORT
AND IMPORT, ACCORDING TO NKD 2007.
tis. eura
Thousand euros
|
|
|
|
Izvoz
Export
|
Uvoz
Import
|
|
|
|
|
|
|
|
I.
– III. 2020.
|
I.
– III. 2021.
|
indeksi
Indices
I.
– III. 2021.
I.
– III. 2020.
|
I.
– III. 2020.
|
I.
– III. 2021.
|
indeksi
Indices
I.
– III. 2021.
I.
– III. 2020.
|
|
|
|
|
|
|
|
|
|
|
|
|
|
|
|
|
|
|
|
Ukupno
|
3
683 372
|
4
000 206
|
108,6
|
6
111 650
|
6
275 097
|
102,7
|
|
|
Total
|
|
|
|
|
|
|
|
|
|
|
|
|
|
|
A
|
|
Poljoprivreda,
šumarstvo i ribarstvo
|
205
186
|
246
797
|
120,3
|
202
185
|
205
220
|
101,5
|
A
|
|
Agriculture,
forestry and fishing
|
|
|
|
|
|
|
|
|
|
|
|
|
|
|
B
|
|
Rudarstvo i
vađenje
|
162
239
|
241
594
|
148,9
|
222
841
|
271
228
|
121,7
|
B
|
|
Mining and
quarrying
|
|
|
|
|
|
|
|
|
|
|
|
|
|
|
C
|
|
Prerađivačka
industrija
|
3
181 593
|
3
327 519
|
104,6
|
5
553 181
|
5
635 422
|
101,5
|
C
|
|
Manufacturing
|
|
|
10
|
Proizvodnja
prehrambenih proizvoda
|
303
154
|
318
748
|
105,1
|
565
677
|
546
102
|
96,5
|
|
10
|
Manufacture
of food products
|
|
|
11
|
Proizvodnja
pića
|
32
410
|
33
030
|
101,9
|
54
867
|
51
272
|
93,4
|
|
11
|
Manufacture
of beverages
|
|
|
12
|
Proizvodnja
duhanskih proizvoda
|
38
356
|
39
233
|
102,3
|
34
541
|
35
156
|
101,8
|
|
12
|
Manufacture
of tobacco products
|
|
|
13
|
Proizvodnja
tekstila
|
43
871
|
43
161
|
98,4
|
116
289
|
102
536
|
88,2
|
|
13
|
Manufacture
of textiles
|
|
|
14
|
Proizvodnja
odjeće
|
136
361
|
148
185
|
108,7
|
263
168
|
273
732
|
104,0
|
|
14
|
Manufacture
of wearing apparel
|
|
|
15
|
Proizvodnja
kože i srodnih proizvoda
|
117
105
|
109
636
|
93,6
|
165
636
|
163
451
|
98,7
|
|
15
|
Manufacture
of leather and related products
|
|
|
16
|
Prerada
drva i proizvoda od drva i pluta, osim namještaja; proizvodnja proizvoda od
slame i pletarskih materijala
|
183
678
|
210
887
|
114,8
|
89
231
|
89
625
|
100,4
|
|
16
|
Manufacture
of wood and of products of wood and cork, except furniture; manufacture of
articles of straw and plaiting materials
|
|
|
17
|
Proizvodnja
papira i proizvoda od papira
|
73
461
|
76
811
|
104,6
|
133
421
|
127
149
|
95,3
|
|
17
|
Manufacture
of paper and paper products
|
|
|
18
|
Tiskanje i
umnožavanje snimljenih zapisa
|
515
|
480
|
93,2
|
381
|
654
|
171,8
|
|
18
|
Printing
and reproduction of recorded media
|
|
|
19
|
Proizvodnja
koksa i rafiniranih naftnih proizvoda
|
128
251
|
112
867
|
88,0
|
292
310
|
255
544
|
87,4
|
|
19
|
Manufacture
of coke and refined petroleum products
|
|
|
20
|
Proizvodnja
kemikalija i kemijskih proizvoda
|
220
593
|
205
347
|
93,1
|
523
450
|
554
444
|
105,9
|
|
20
|
Manufacture
of chemicals and chemical products
|
|
|
21
|
Proizvodnja
osnovnih farmaceutskih proizvoda i farmaceutskih pripravaka
|
214
124
|
284
353
|
132,8
|
480
790
|
414
048
|
86,1
|
|
21
|
Manufacture
of basic pharmaceutical products and pharmaceutical preparations
|
|
|
22
|
Proizvodnja
proizvoda od gume i plastike
|
121
643
|
139
546
|
114,7
|
261
247
|
301
278
|
115,3
|
|
22
|
Manufacture
of rubber and plastic products
|
|
|
23
|
Proizvodnja
ostalih nemetalnih mineralnih proizvoda
|
124
660
|
130
740
|
104,9
|
122
352
|
122
308
|
100,0
|
|
23
|
Manufacture
of other non-metallic mineral products
|
|
|
24
|
Proizvodnja
metala
|
131
793
|
169
138
|
128,3
|
338
774
|
401
977
|
118,7
|
|
24
|
Manufacture
of basic metals
|
|
|
25
|
Proizvodnja
gotovih metalnih proizvoda, osim strojeva i opreme
|
239
537
|
263
557
|
110,0
|
238
814
|
262
118
|
109,8
|
|
25
|
Manufacture
of fabricated metal products, except machinery and equipment
|
|
|
26
|
Proizvodnja
računala te elektroničkih i optičkih proizvoda
|
126
827
|
127
043
|
100,2
|
344
170
|
379
556
|
110,3
|
|
26
|
Manufacture
of computer, electronic and optical products
|
|
|
27
|
Proizvodnja
električne opreme
|
276
010
|
309
969
|
112,3
|
286
855
|
357
543
|
124,6
|
|
27
|
Manufacture
of electrical equipment
|
|
|
28
|
Proizvodnja
strojeva i uređaja, d. n.
|
220
034
|
239
913
|
109,0
|
482
833
|
476
770
|
98,7
|
|
28
|
Manufacture
of machinery and equipment n. e. c.
|
|
|
29
|
Proizvodnja
motornih vozila, prikolica i poluprikolica
|
180
286
|
167
488
|
92,9
|
456
114
|
429
231
|
94,1
|
|
29
|
Manufacture
of motor vehicles, trailers and semi-trailers
|
|
|
30
|
Proizvodnja
ostalih prijevoznih sredstava
|
162
357
|
75
356
|
46,4
|
73
010
|
51
425
|
70,4
|
|
30
|
Manufacture
of other transport equipment
|
|
|
31
|
Proizvodnja
namještaja
|
66
517
|
72
352
|
108,8
|
90
462
|
98
460
|
108,8
|
|
31
|
Manufacture
of furniture
|
|
|
32
|
Ostala
prerađivačka industrija
|
40
049
|
49
681
|
124,1
|
138
789
|
141
043
|
101,6
|
|
32
|
Other
manufacturing
|
|
|
|
|
|
|
|
|
|
|
|
|
|
|
D
|
|
Opskrba
električnom energijom, plinom, parom i klimatizacija
|
56
096
|
64
520
|
115,0
|
104
145
|
103
564
|
99,4
|
D
|
|
Electricity,
gas, steam and air conditioning supply
|
|
|
|
|
|
|
|
|
|
|
|
|
|
|
E
|
|
Opskrba
vodom; uklanjanje otpadnih voda, gospodarenje otpadom te djelatnosti
sanacije okoliša
|
60
855
|
102
794
|
168,9
|
12
691
|
45
833
|
361,2
|
E
|
|
Water
supply; sewerage, waste management and remediation activities
|
|
|
|
|
|
|
|
|
|
|
|
|
|
|
J
|
|
Informacije
i komunikacije
|
14
138
|
15
673
|
110,9
|
15
748
|
12
837
|
81,5
|
J
|
|
Information
and communication
|
|
|
|
|
|
|
|
|
|
|
|
|
|
|
M
|
|
Stručne,
znanstvene i tehničke djelatnosti
|
16
|
1
|
3,9
|
41
|
18
|
43,6
|
M
|
|
Professional,
scientific and technical activities
|
|
|
|
|
|
|
|
|
|
|
|
|
|
|
R
|
|
Umjetnost,
zabava i rekreacija
|
90
|
98
|
108,2
|
106
|
123
|
115,2
|
R
|
|
Arts,
entertainment and recreation
|
|
|
|
|
|
|
|
|
|
|
|
|
|
|
|
|
Neraspoređeno
|
3
157
|
1
210
|
38,3
|
712
|
853
|
119,7
|
|
|
Not
classified
|
3. IZVOZ
I UVOZ PO SEKTORIMA SMTK
EXPORT
AND IMPORT, ACCORDING TO SITC SECTIONS
tis. eura
Thousand euros
|
|
|
Izvoz
Export
|
Uvoz
Import
|
|
|
|
|
|
I.
– III. 2020.
|
I.
– III. 2021.
|
indeksi
Indices
I.
– III. 2021.
I.
– III. 2020.
|
I.
– III. 2020.
|
I.
– III. 2021.
|
indeksi
Indices
I.
– III. 2021.
I.
– III. 2020.
|
|
|
|
|
|
|
|
|
|
|
|
|
|
|
|
Ukupno
|
3
683 372
|
4
000 206
|
108,6
|
6
111 650
|
6
275 097
|
102,7
|
|
Total
|
|
|
|
|
|
|
|
|
|
|
|
|
0
|
Hrana i žive životinje
|
432
679
|
486
547
|
112,4
|
691
606
|
667
438
|
96,5
|
0
|
Food and live animals
|
|
1
|
Pića i duhan
|
69
357
|
70
766
|
102,0
|
90
146
|
87
466
|
97,0
|
1
|
Beverages and tobacco
|
|
2
|
Sirove materije, osim goriva
|
270
930
|
317
762
|
117,3
|
110
283
|
147
846
|
134,1
|
2
|
Crude materials, except fuels
|
|
3
|
Mineralna goriva i maziva
|
328
962
|
398
336
|
121,1
|
620
052
|
636
946
|
102,7
|
3
|
Mineral fuels and lubricants
|
|
4
|
Životinjska i biljna ulja i masti
|
15
681
|
24
286
|
154,9
|
27
043
|
30
377
|
112,3
|
4
|
Animal and vegetable oils and fats
|
|
5
|
Kemijski proizvodi
|
476
023
|
539
232
|
113,3
|
1
069 944
|
1
037 773
|
97,0
|
5
|
Chemical products
|
|
6
|
Proizvodi svrstani prema materijalu
|
631
447
|
704
839
|
111,6
|
1
086 787
|
1
155 321
|
106,3
|
6
|
Manufactured goods classified chiefly
by material
|
|
7
|
Strojevi i prijevozna sredstva
|
962
446
|
896
002
|
93,1
|
1
556 188
|
1
611 796
|
103,6
|
7
|
Machinery and transport equipment
|
|
8
|
Razni gotovi proizvodi
|
480
473
|
540
195
|
112,4
|
852
426
|
891
751
|
104,6
|
8
|
Miscellaneous manufactured articles
|
|
9
|
Proizvodi i transakcije, d. n.
|
12
218
|
21
032
|
172,1
|
6
464
|
7
530
|
116,5
|
9
|
Commodities and transactions, n. e. s.
|
|
|
Neraspoređeno
|
3 157
|
1 210
|
38,3
|
712
|
853
|
119,7
|
|
Not classified
|
4. IZVOZ
I UVOZ PREMA EKONOMSKIM GRUPACIJAMA ZEMALJA
EXPORT
AND IMPORT, ACCORDING TO ECONOMIC CLASSIFICATION OF COUNTRIES
tis.
eura
Thousand
euros
|
|
Izvoz
Export
|
Uvoz
Import
|
|
|
|
I.
– III. 2020.
|
I.
– III. 2021.
|
indeksi
Indices
I.
– III. 2021.
I.
– III. 2020.
|
I.
– III. 2020.
|
I.
– III. 2021.
|
indeksi
Indices
I.
– III. 2021.
I.
– III. 2020.
|
|
|
|
|
|
|
|
|
|
|
|
Ukupno
|
3 683 372
|
4 000 206
|
108,6
|
6 111 650
|
6 275 097
|
102,7
|
Total
|
|
|
|
|
|
|
|
|
|
|
Države članice EU-a1)
|
2 551 202
|
2 756 385
|
108,0
|
4 937 420
|
4 986 558
|
101,0
|
EU Member States1)
|
|
Austrija
|
218 124
|
227 639
|
104,4
|
419 696
|
428 234
|
102,0
|
Austria
|
|
Belgija
|
66 042
|
58 606
|
88,7
|
203 178
|
146 850
|
72,3
|
Belgium
|
|
Bugarska
|
24 501
|
26 038
|
106,3
|
37 293
|
86 404
|
231,7
|
Bulgaria
|
|
Cipar
|
1 412
|
4 626
|
327,6
|
5 161
|
2 239
|
43,4
|
Cyprus
|
|
Češka
|
63 870
|
64 194
|
100,5
|
156 909
|
163 478
|
104,2
|
Czech Republic
|
|
Danska
|
15 009
|
21 418
|
142,7
|
34 223
|
38 048
|
111,2
|
Denmark
|
|
Estonija
|
3 711
|
2 906
|
78,3
|
1 426
|
1 633
|
114,5
|
Estonia
|
|
Finska
|
5 042
|
7 044
|
139,7
|
7 970
|
7 817
|
98,1
|
Finland
|
|
Francuska
|
102 162
|
113 277
|
110,9
|
180 467
|
165 267
|
91,6
|
France
|
|
Grčka
|
14 195
|
18 118
|
127,6
|
42 627
|
68 291
|
160,2
|
Greece
|
|
Irska
|
4 870
|
12 931
|
265,5
|
15 644
|
24 572
|
157,1
|
Ireland
|
|
Italija
|
425 039
|
520 531
|
122,5
|
787 395
|
787 369
|
100,0
|
Italy
|
|
Letonija
|
3 025
|
2 839
|
93,8
|
3 410
|
2 904
|
85,2
|
Latvia
|
|
Litva
|
11 090
|
12 780
|
115,2
|
10 913
|
11 033
|
101,1
|
Lithuania
|
|
Luksemburg
|
108 205
|
3 412
|
3,2
|
2 751
|
4 206
|
152,9
|
Luxembourg
|
|
Mađarska
|
267 455
|
357 432
|
133,6
|
507 587
|
487 721
|
96,1
|
Hungary
|
|
Malta
|
3 728
|
7 859
|
210,8
|
1 684
|
1 314
|
78,0
|
Malta
|
|
Nizozemska
|
51 029
|
55 892
|
109,5
|
252 629
|
252 867
|
100,1
|
Netherlands
|
|
Njemačka
|
485 375
|
512 076
|
105,5
|
941 657
|
952 828
|
101,2
|
Germany
|
|
Poljska
|
67 480
|
83 905
|
124,3
|
229 983
|
254 768
|
110,8
|
Poland
|
|
Portugal
|
10 557
|
9 249
|
87,6
|
6 519
|
7 839
|
120,2
|
Portugal
|
|
Rumunjska
|
80 855
|
80 230
|
99,2
|
71 600
|
63 883
|
89,2
|
Romania
|
|
Sjeverna Irska
|
…
|
308
|
2)
|
…
|
1 774
|
2)
|
Northern Ireland
|
|
Slovačka
|
37 293
|
37 217
|
99,8
|
130 397
|
144 738
|
111,0
|
Slovakia
|
|
Slovenija
|
392 172
|
414 898
|
105,8
|
716 327
|
709 136
|
99,0
|
Slovenia
|
|
Španjolska
|
56 134
|
64 844
|
115,5
|
132 169
|
138 098
|
104,5
|
Spain
|
|
Švedska
|
32 269
|
35 517
|
110,1
|
37 792
|
33 227
|
87,9
|
Sweden
|
|
Neraspoređeno
|
556
|
598
|
107,7
|
10
|
19
|
192,2
|
Not classified
|
|
|
|
|
|
|
|
|
|
|
Zemlje Efte
|
60 253
|
86 793
|
144,0
|
52 328
|
46 819
|
89,5
|
EFTA countries
|
|
Island
|
142
|
385
|
272,2
|
22
|
6
|
27,7
|
Iceland
|
|
Lihtenštajn
|
110
|
3 553
|
3)
|
4
|
14
|
366,7
|
Liechtenstein
|
|
Norveška
|
10 622
|
21 259
|
200,1
|
3 974
|
2 805
|
70,6
|
Norway
|
|
Švicarska
|
49 379
|
61 596
|
124,7
|
48 328
|
43 994
|
91,0
|
Switzerland
|
|
|
|
|
|
|
|
|
|
|
Zemlje Cefte
|
597 720
|
604 952
|
101,2
|
331 201
|
410 259
|
123,9
|
CEFTA countries
|
|
Albanija
|
17 515
|
19 051
|
108,8
|
2 116
|
3 329
|
157,3
|
Albania
|
|
Bosna i Hercegovina
|
317 812
|
312 500
|
98,3
|
168 231
|
223 033
|
132,6
|
Bosnia and Herzegovina
|
|
Crna Gora
|
40 679
|
39 926
|
98,1
|
1 311
|
986
|
75,2
|
Montenegro
|
|
Kosovo
|
29 611
|
23 509
|
79,4
|
1 091
|
995
|
91,2
|
Kosovo
|
|
Moldavija
|
157
|
266
|
169,1
|
574
|
281
|
49,0
|
Moldova
|
|
Sjeverna Makedonija
|
31 558
|
31 185
|
98,8
|
19 294
|
19 305
|
100,1
|
North Macedonia
|
|
Srbija
|
160 388
|
178 517
|
111,3
|
138 584
|
162 329
|
117,1
|
Serbia
|
|
|
|
|
|
|
|
|
|
|
Zemlje OPEC-a
|
38 289
|
34 372
|
89,8
|
24 731
|
35 998
|
145,6
|
OPEC countries
|
|
Alžir
|
1 631
|
716
|
43,9
|
4 190
|
8 272
|
197,4
|
Algeria
|
|
Angola
|
4
|
12
|
270,4
|
-
|
0
|
-
|
Angola
|
|
Ekvatorska Gvineja
|
41
|
-
|
-
|
-
|
-
|
-
|
Equatorial Guinea
|
|
Gabon
|
75
|
41
|
55,0
|
-
|
20
|
-
|
Gabon
|
|
Irak
|
4 174
|
855
|
20,5
|
0
|
-
|
-
|
Iraq
|
|
Iran, Islamska Republika
|
746
|
1 012
|
135,8
|
604
|
926
|
153,2
|
Iran, Islamic Republic of
|
|
Kongo
|
8
|
8
|
90,8
|
0
|
-
|
-
|
Congo
|
|
Kuvajt
|
1 965
|
1 050
|
53,5
|
40
|
1
|
1,6
|
Kuwait
|
|
Libija
|
2 256
|
2 545
|
112,8
|
45
|
7 308
|
3)
|
Libya
|
|
Nigerija
|
330
|
521
|
158,1
|
16 586
|
17 736
|
106,9
|
Nigeria
|
|
Saudijska Arabija
|
7 985
|
12 496
|
156,5
|
2 595
|
1 214
|
46,8
|
Saudi Arabia
|
|
Ujedinjeni Arapski Emirati
|
19 074
|
15 102
|
79,2
|
669
|
404
|
60,4
|
United Arab Emirates
|
|
Bolivarijanska Republika Venezuela
|
-
|
13
|
-
|
1
|
118
|
3)
|
Venezuela, Bolivarian Republic of
|
|
|
|
|
|
|
|
|
|
|
Ostale
europske zemlje
|
173 214
|
172 328
|
99,5
|
241 484
|
220 349
|
91,2
|
Other
countries in Europe
|
|
Bjelorusija
|
9 621
|
4 325
|
45,0
|
998
|
3 554
|
356,0
|
Belarus
|
|
Rusija
|
33 134
|
38 323
|
115,7
|
49 348
|
84 689
|
171,6
|
Russian Federation
|
|
Turska
|
44 709
|
70 332
|
157,3
|
113 986
|
100 523
|
88,2
|
Turkey
|
|
Ujedinjena Kraljevina4)
|
69 402
|
40 917
|
59,0
|
68 438
|
21 620
|
31,6
|
United Kingdom4)
|
|
Ukrajina
|
16 212
|
18 343
|
113,1
|
8 647
|
9 843
|
113,8
|
Ukraine
|
|
Ostale zemlje
|
135
|
89
|
65,8
|
67
|
120
|
179,7
|
Other countries
|
|
|
|
|
|
|
|
|
|
|
Ostale azijske zemlje
|
105 776
|
127 206
|
120,3
|
427 642
|
453 428
|
106,0
|
Other countries in Asia
|
|
Azerbajdžan
|
292
|
328
|
112,3
|
121 503
|
102 144
|
84,1
|
Azerbaijan
|
|
Bangladeš
|
54
|
441
|
822,8
|
3 214
|
2 699
|
84,0
|
Bangladesh
|
|
Filipini
|
1 642
|
414
|
25,2
|
426
|
273
|
64,0
|
Philippines
|
|
Hong Kong, Kina
|
2 581
|
11 559
|
447,8
|
314
|
338
|
107,8
|
Hong Kong, China
|
|
Indija
|
6 252
|
12 359
|
197,7
|
49 567
|
32 248
|
65,1
|
India
|
|
Indonezija
|
725
|
692
|
95,4
|
5 281
|
6 540
|
123,9
|
Indonesia
|
|
Izrael
|
5 362
|
8 254
|
153,9
|
5 260
|
4 621
|
87,9
|
Israel
|
|
Japan
|
34 553
|
33 661
|
97,4
|
7 403
|
8 550
|
115,5
|
Japan
|
|
Katar
|
3 887
|
6 399
|
164,6
|
13
|
351
|
3)
|
Qatar
|
|
Kazahstan
|
4 974
|
3 606
|
72,5
|
410
|
4 344
|
3)
|
Kazakhstan
|
|
Kina
|
22 217
|
22 035
|
99,2
|
182 555
|
244 600
|
134,0
|
China
|
|
Koreja, Republika
|
2 631
|
2 343
|
89,1
|
15 189
|
13 341
|
87,8
|
Korea, Republic of
|
|
Libanon
|
4 308
|
3 294
|
76,5
|
4
|
0
|
8,7
|
Lebanon
|
|
Malezija
|
1 039
|
3 029
|
291,7
|
2 439
|
4 933
|
202,3
|
Malaysia
|
|
Pakistan
|
446
|
170
|
38,0
|
3 000
|
2 141
|
71,4
|
Pakistan
|
|
Singapur
|
1 564
|
839
|
53,7
|
3 919
|
1 554
|
39,6
|
Singapore
|
|
Tajland
|
421
|
419
|
99,6
|
3 366
|
6 998
|
207,9
|
Thailand
|
|
Tajvan, Kina
|
473
|
7 724
|
3)
|
8 071
|
7 891
|
97,8
|
Taiwan, China
|
|
Vijetnam
|
4 994
|
5 762
|
115,4
|
10 954
|
6 392
|
58,4
|
Viet Nam
|
|
Ostale zemlje
|
7 361
|
3 877
|
52,7
|
4 756
|
3 469
|
72,9
|
Other countries
|
|
|
|
|
|
|
|
|
|
|
Ostale afričke zemlje
|
37 723
|
33 584
|
89,0
|
14 030
|
12 853
|
91,6
|
Other countries in Africa
|
|
Egipat
|
19 993
|
16 217
|
81,1
|
6 648
|
5 883
|
88,5
|
Egypt
|
|
Etiopija
|
994
|
1 635
|
164,5
|
1 327
|
184
|
13,9
|
Ethiopia
|
|
Južnoafrička Republika
|
1 220
|
3 125
|
256,2
|
809
|
855
|
105,7
|
South Africa
|
|
Maroko
|
7 367
|
5 213
|
70,8
|
2 944
|
2 926
|
99,4
|
Morocco
|
|
Tunis
|
270
|
1 386
|
513,5
|
471
|
792
|
168,1
|
Tunisia
|
|
Ostale zemlje
|
7 879
|
6 007
|
76,2
|
1 831
|
2 214
|
120,9
|
Other countries
|
|
|
|
|
|
|
|
|
|
|
Ostale američke zemlje
|
107 599
|
177 713
|
165,2
|
75 977
|
85 383
|
112,4
|
Other countries in America
|
|
Argentina
|
166
|
301
|
181,8
|
2 799
|
1 874
|
66,9
|
Argentina
|
|
Brazil
|
1 268
|
1 973
|
155,6
|
4 842
|
2 281
|
47,1
|
Brazil
|
|
Kanada
|
7 224
|
11 899
|
164,7
|
4 819
|
2 633
|
54,6
|
Canada
|
|
Meksiko
|
2 583
|
1 919
|
74,3
|
1 217
|
4 132
|
339,6
|
Mexico
|
|
SAD
|
92 011
|
157 950
|
171,7
|
55 234
|
67 200
|
121,7
|
United States
|
|
Ostale zemlje
|
4 347
|
3 670
|
84,4
|
7 066
|
7 263
|
102,8
|
Other countries
|
|
|
|
|
|
|
|
|
|
|
Oceanijske zemlje
|
4 385
|
5 807
|
132,4
|
941
|
14 987
|
3)
|
Countries of Oceania
|
|
Australija
|
4 048
|
5 419
|
133,9
|
547
|
14 748
|
3)
|
Australia
|
|
Novi Zeland
|
223
|
270
|
120,7
|
130
|
239
|
183,6
|
New Zealand
|
|
Ostale zemlje
|
114
|
118
|
103,8
|
263
|
-
|
-
|
Other countries
|
|
|
|
|
|
|
|
|
|
|
Neraspoređeno
|
7 210
|
1 065
|
14,8
|
5 896
|
8 463
|
143,5
|
Not classified
|
1) Od
1. siječnja 2021. Ujedinjena Kraljevina prestala je biti država članica EU-a.
Protokol o Irskoj i Sjevernoj Irskoj omogućio je Sjevernoj Irskoj da i dalje
ostane sastavni dio carinskog teritorija Ujedinjene Kraljevine. Stoga su
podaci za Sjevernu Irsku uključeni u podatke o robnoj razmjeni s državama
članicama EU-a.
2) Indeks se ne može iskazati.
3) Indeks je veći od 999.
4) Od
1. siječnja 2021. podaci za Ujedinjenu Kraljevinu ne uključuju podatke za
Sjevernu Irsku.
1) Since 1 January 2021, the United
Kingdom has withdrawn from the European Union. The Protocol on Ireland and
Northern Ireland ensures that Northern Ireland remains the constitutional
part of the customs territory of the United Kingdom. Therefore, the data for
Northern Ireland are included in the data on trade in goods with EU Member
States.
2) The index cannot be presented.
3) The index exceeds 999.
4) As
of 1 January 2021, the data for the United Kingdom do not include the data
for Northern Ireland.
5. PROSJEČNA
VRIJEDNOST EURA ZA REPUBLIKU HRVATSKU − PRVI REZULTATI
AVERAGE
EXCHANGE RATE OF EURO IN THE REPUBLIC OF CROATIA − FIRST RESULTS
|
|
Izvoz
Export
|
Uvoz
Import
|
|
|
|
I.
– IV. 2020.
|
I.
– IV. 2021.
|
indeksi
Indices
I.
– IV. 2021.
I. – IV. 2020.
|
I.
– IV. 2020.
|
I.
– IV. 2021.
|
indeksi
Indices
I.
– IV. 2021.
I. – IV. 2020.
|
|
|
|
|
|
|
|
|
|
|
|
Prosječan
tečaj 1 eura u kunama
|
7,4770
|
7,5597
|
101,1
|
7,4764
|
7,5597
|
101,1
|
Average
exchange rate for 1 euro in kuna
|
6. PRVI
REZULTATI ROBNE RAZMJENE REPUBLIKE HRVATSKE S INOZEMSTVOM
FIRST
RESULTS OF FOREIGN TRADE IN GOODS OF THE REPUBLIC OF CROATIA
tis. eura
Thousand euros
|
|
I.
– IV. 2020.
|
I.
– IV. 2021.
|
Indeksi
Indices
I. – IV. 2021.
I. – IV. 2020.
|
|
|
|
|
|
|
|
|
Izvoz
|
4
634 581
|
5
497 410
|
118,6
|
Export
|
|
Države
članice EU-a1)
|
3
185 039
|
3
696 659
|
116,1
|
EU Member
States1)
|
|
Države
nečlanice EU-a2)
|
1
449 542
|
1
800 752
|
124,2
|
Non-EU
Member States2)
|
|
|
|
|
|
|
|
Uvoz
|
7
566 626
|
8
495 004
|
112,3
|
Import
|
|
Države
članice EU-a1)
|
6
055 239
|
6
673 087
|
110,2
|
EU Member
States1)
|
|
Države
nečlanice EU-a2)
|
1
511 387
|
1
821 917
|
120,5
|
Non-EU
Member States2)
|
|
|
|
|
|
|
|
Saldo robne razmjene
|
-2
932 045
|
-2
997 594
|
3)
|
Balance of foreign trade in goods
|
|
Pokrivenost uvoza izvozom, %
|
61,3
|
64,7
|
3)
|
Coverage of import by export, %
|
1) Od 1. siječnja 2021. Ujedinjena
Kraljevina prestala je biti država članica EU-a. Protokol o Irskoj i
Sjevernoj Irskoj omogućio je Sjevernoj Irskoj da i dalje ostane sastavni dio
carinskog teritorija Ujedinjene Kraljevine. Stoga su podaci za Sjevernu
Irsku uključeni u podatke o robnoj razmjeni s državama članicama EU-a.
2) Od 1. siječnja 2021. u podatke
za države nečlanice EU-a uključeni su podaci za Ujedinjenu Kraljevinu bez
Sjeverne Irske.
3) Indeks
se ne iskazuje.
1) Since 1 January 2021, the United Kingdom
has withdrawn from the European Union. The Protocol on Ireland and Northern
Ireland ensures that Northern Ireland remains the constitutional part of the
customs territory of the United Kingdom. Therefore, the data for Northern
Ireland are included in the data on trade in goods with EU Member States
2) As of 1 January 2021, the data for non-EU
Member States include data for the United Kingdom excluding Norhern Ireland.
3) The index is not presented.
METODOLOŠKA
OBJAŠNJENJA
|
|
NOTES
ON METHODOLOGY
|
|
|
|
|
|
|
|
|
|
Izvori
i metode prikupljanja podataka
|
|
Sources
and methods of data collection
|
|
|
|
|
|
Izvor
podataka za statistiku robne razmjene s državama članicama EU-a jest
Intrastatov obrazac kojim izvještajne jedinice izvješćuju o primicima i/ili
otpremama na mjesečnoj osnovi, tj. u mjesecu u kojem roba fizički ulazi ili
napušta teritorij Republike Hrvatske. Izvještajne jedinice jesu svi
poslovni subjekti, obveznici poreza na dodanu vrijednost, čija vrijednost
robne razmjene s državama članicama EU-a prelazi prag uključivanja
određenoga za izvještajnu godinu. Za 2021. određena je vrijednost
praga uključivanja za primitke od 2,5 milijuna kuna i za otpreme od 1,3
milijuna kuna. Radi potpunog usklađivanja s metodologijom i zakonodavstvom
EU-a u podatke o robnoj razmjeni s inozemstvom uključena je vrijednost
trgovine ispod praga uključivanja, procijenjena na osnovi podataka o
isporukama i stjecanjima dobara u države članice/iz država članica EU-a,
dobivenih od Porezne uprave Republike Hrvatske.
|
|
The
data source for statistics on trading in goods with EU Member States is the
Intrastat form used by the reporting units to report on arrivals and/or
dispatches on a monthly basis, that is, for each month in which goods
physically enter or leave the territory of the Republic of Croatia. The
reporting units are all business entities, value added tax payers whose
value of trading in goods with EU Member States exceeds the exemption
threshold determined for the reference year. For 2021, an exemption
threshold of 2.5 million kuna for arrivals and of 1.3 million kuna for
dispatches has been determined. In order to achieve complete harmonisation
with EU methodology and legislation, data on foreign trade in goods have
been supplemented with trade value below the exemption threshold after
being estimated on the basis of data on supplies and acquisitions of goods
in/from EU Member States provided by the Tax Administration Office of the
Republic of Croatia.
|
|
|
|
|
|
Prvi
rezultati statistike robne razmjene Republike Hrvatske s inozemstvom
sastavni su dio ovog Priopćenja i sadržavaju procjenu vrijednosti trgovine
ispod praga uključivanja za cjelokupno razdoblje na koje se
odnose.
|
|
The
First Results of the statistics concerning the foreign trade in goods of
the Republic of Croatia are an integral part of this First Release and they
contain the estimate of the trade value below the exemption threshold for
the entire period they refer to.
|
|
|
|
|
|
Izvor
podataka za statistiku robne razmjene s trećim zemljama, odnosno državama
nečlanicama EU-a, jesu Jedinstvene carinske deklaracije o izvozu i uvozu robe.
Državni zavod za statistiku Republike Hrvatske dobiva od Carinske uprave
Republike Hrvatske kontrolirane Jedinstvene carinske deklaracije u obliku
slogova.
|
|
The
data source for statistics on trading in goods with third countries, that
is, non-EU countries, are Single Administrative Documents on export and
import of goods. The Croatian Bureau of Statistics receives the reviewed
Single Administrative Documents from the Customs Administration of the
Republic of Croatia in the form of data records.
|
|
|
|
|
|
Poštujući
osnovne metodološke preporuke Statističkog ureda UN-a i Eurostata, Državni
zavod za statistiku prikupljene podatke Intrastata i Extrastata statistički
obrađuje i objavljuje kao jedinstveni podatak robne razmjene Republike
Hrvatske s inozemstvom.
|
|
Following
basic methodological recommendations of the UN Statistical Office and
Eurostat, the Croatian Bureau of Statistics statistically processes and
disseminates collected Intrastat and Extrastat data as unique information
on foreign trade in goods of the Republic of Croatia.
|
|
|
|
|
|
|
|
|
|
Pravna
osnova
|
|
Legal
basis
|
|
|
|
|
|
Pravna
osnova za provođenje istraživanja Intrastat jest europsko zakonodavstvo za
statistiku robne razmjene između država članica EU-a (Uredba (EZ) br.
638/2004 i dopune navedene uredbe br. 222/2009 i 659/2014 Europskog
parlamenta i Vijeća te provedbena Uredba Komisije br. 1982/2004 i dopune
navedene uredbe Komisije br. 1915/2005, 91/2010, 96/2010 i 1093/2013), Uredba
(EU) br. 2019/2152 te Provedbena uredba Komisije br. 2020/1197, Zakon o
službenoj statistici (NN, br. 25/20.), Godišnji provedbeni plan
statističkih
aktivnosti Republike Hrvatske 2020. godine (NN, br. 12/20.) i Zakon o
carinskoj službi (NN, br. 68/13., 30/14., 115/16., 39/19. i 98/19.). Opširnija
metodološka objašnjenja za ovo istraživanje objavljena su na mrežnim
stranicama Državnog zavoda za statistiku https://www.dzs.hr/Hrv/intrastat/intrastat.htm.
|
|
The
legal basis for the conduct of the Intrastat survey is the European
legislation related to statistics on trading in goods between EU Member
States (the Regulation (EC) No. 638/2004 and the amending regulations Nos
222/2009 and 659/2014 of the European Parliament and of the Council as well
as the Commission Implementing Regulation No. 1982/2004 and the Commission
amending regulations Nos 1915/2005, 91/2010, 96/2010 and 1093/2013), the
Regulation (EU) No. 2019/2152 as well as the Commission Implementing
Regulation No. 2020/1197, the Official Statistics Act (NN, No. 25/20), the
Annual Implementation Plan of Statistical Activities of the Republic of
Croatia 2020 (NN, No. 12/20) and the Customs Administration Act (NN, Nos
68/13, 30/14, 115/16, 39/19 and 98/19). More detailed notes on methodology
for this survey are published on the website of the Croatian Bureau of
Statistics http://www.dzs.hr/Eng/intrastat/intrastat.htm.
|
|
|
|
|
|
Pravna
osnova za Extrastat jest europsko zakonodavstvo za statistiku robne
razmjene s trećim zemljama (Uredba (EZ) br. 471/2009 i izmjene navedene
uredbe br. 2016/1724 i 2016/2119 Europskog parlamenta i Vijeća, Uredba
Komisije (EU) br. 92/2010 i izmjena navedene uredbe br. 2016/1253 i Uredba
Komisije (EU) br. 113/2010), Uredba (EU) br. 2019/2152 te Provedbena uredba
Komisije br. 2020/1197, Zakon o provedbi carinskog zakonodavstva Europske
unije (NN, br. 40/16.), Zakon o službenoj statistici (NN, br. 25/20.),
Godišnji provedbeni plan statističkih aktivnosti Republike Hrvatske 2020.
godine (NN, br. 12/20.), Zakon o carinskoj službi (NN, br. 68/13., 30/14.,
115/16., 39/19. i 98/19.) i Pravilnik o popunjavanju Jedinstvene carinske
deklaracije (NN, br. 65/19.).
|
|
The
legal basis for Extrastat is the European legislation related to statistics
on trading in goods with third countries (the Regulation (EC) No. 471/2009
and the amending regulations Nos 2016/1724 and 2016/2119 of the European
Parliament and of the Council, the Commission Regulation (EU) No. 92/2010
and the amending Regulation No. 2016/1253 as well as the Commission
Regulation (EU) No. 113/2010), the Regulation (EU) No. 2019/2152 as well as
the Commission Implementing Regulation No. 2020/1197, the EU Customs
Legislations Implementation Act (NN, No. 40/16), the Official Statistics
Act (NN, No. 25/20), the Annual Implementation Plan of Statistical
Activities of the Republic of Croatia 2020 (NN, No. 12/20), the Customs
Administration Act (NN, Nos 68/13, 30/14, 115/16, 39/19 and 98/19) and the
Ordinance on Filling in the Single Administrative Document (NN, No. 65/19).
|
|
|
|
|
|
|
|
|
|
Obuhvat
i usporedivost
|
|
Coverage
and comparability
|
|
|
|
|
|
Statistika
robne razmjene s inozemstvom obuhvaća svu robu koja se izvozi iz zemlje
odnosno uvozi u zemlju. U podatke o robnoj razmjeni s inozemstvom
uključeni su i izvoz i uvoz prema osnovi unutarnje i vanjske proizvodnje na
bruto osnovi.
|
|
Statistics
on foreign trade in goods include all goods exported from or imported into
the country. Data on foreign trade in goods include both export and import
based on gross inward and outward processing.
|
|
|
|
|
|
Statistička
vrijednost robe jest vrijednost robe na hrvatskoj granici. Kod izvoza,
odnosno otprema, vrijednosti su prikazane prema paritetu fob, a kod uvoza,
odnosno primitaka, vrijednosti se prikazuju prema paritetu cif.
|
|
Statistical
value of goods is the value of goods at the Croatian border. Values for
export, i. e. dispatches, are shown as an FOB-type value, while values for
import, i. e. arrivals, are shown as a CIF-type value.
|
|
|
|
|
|
Iznosi
u stranim valutama preračunani su u kune, eure i američke dolare primjenom
mjesečnih tečajnih lista određenih za izvještajni mjesec. Primjenjuje se
srednji valutni tečaj Hrvatske narodne banke.
|
|
Amounts
expressed in foreign currencies are converted into kuna, euros and American
dollars according to the monthly exchange rate lists determined for the
reporting month. The mean exchange rate of the Croatian National Bank is
used.
|
|
|
|
|
|
U
pojedinim tablicama može se dogoditi da ukupni zbroj ne odgovara zbroju
pojedinačnih stavki zbog zaokruživanja na tisuće.
|
|
In
certain tables, the sum total may not equal the sum of individual figures
due to the rounding to thousands.
|
|
|
|
|
|
U
prikazivanju podataka po djelatnostima primjenjuje se NKD 2007. (NN, br.
58/07. i 72/07.), koji je stupio na snagu 1. siječnja 2008. Utemeljen je na
europskoj klasifikaciji NACE, Rev. 2, koja je obvezatna za države članice
Europske unije. Podaci se iskazuju prema proizvodnom
načelu kod kojeg se podaci za izvoz i uvoz dobivaju prema djelatnosti koja
proizvodi dotični proizvod, odnosno iz koje proizvod potječe.
|
|
Data
by type of activities have been presented according to the NKD 2007.
(NN, Nos 58/07 and 72/07), which entered into force on 1 January
2008 and is based on the European classification NACE, Rev. 2, which is
obligatory in EU Member States. Data are presented using a production
approach by which export and import data are reported according to the
manufacturing activity from which the product originates.
|
|
|
|
|
|
Roba
koja se pojavljuje u izvozu i uvozu za potrebe statistike razvrstava se
prema Standardnoj međunarodnoj trgovinskoj klasifikaciji (SMTK, Rev. 4).
|
|
Goods
listed under export and import are classified, for statistical needs,
according to the Standard International Trade Classification (SITC, Rev.
4).
|
|
|
|
|
|
Podaci
se iskazuju kod izvoza robe prema zemljama namjene, a kod uvoza robe
primjenjuju se dva metodološka kriterija iskazivanja podataka uvoza prema
zemljama. U
Extrastatu se kod uvoza robe podaci iskazuju prema zemljama podrijetla
robe, dok se kod primitaka robe u Intrastatu iskazuju prema zemljama
otpreme.
|
|
Data
on export are shown by countries of destination, while two methodological
criterions has been applied, by which data on import are shown by
countries. In Extrastat, data on import are shown by countries of origin of
goods, while, in Intrastat, data on arrivals of goods are presented by
countries of dispatch.
|
|
|
|
|
|
Od
1. siječnja 2021. promijenio se način izvješćivanja za Intrastat. Protokol
o Irskoj i Sjevernoj Irskoj, koji je stupio na snagu 1. siječnja 2021.,
omogućio je Sjevernoj Irskoj da i dalje ostane sastavni dio carinskog
teritorija Ujedinjene Kraljevine, ali da istodobno ostvaruje određene
pogodnosti od jedinstvenog tržišta Europske unije.
|
|
As
of 1 January 2021, Intrastat reporting has been changed. The Protocol on
Ireland and Northern Ireland, which entered into force on 1 January
2021, allowed Northern Ireland to remain an integral part of the customs
territory of the United Kingdom, but at the same time to have certain
benefits from the single market of the European Union.
|
|
|
|
|
|
Protokol
o Irskoj i Sjevernoj Irskoj za obveznike izvješćivanja za Intrastat u
Republici Hrvatskoj (za razdoblje izvješćivanja od siječnja 2021. nadalje)
znači da otpremu robe u Sjevernu Irsku odnosno primitak robe iz Sjeverne
Irske i dalje moraju prijavljivati u Intrastatovim obrascima, a podaci su
uključeni u podatke o robnoj razmjeni s državama članicama EU-a. Robna
razmjena s Ujedinjenom Kraljevinom od 1. siječnja 2021. uključena je u
Ostale europske zemlje i isključuje podatke za Sjevernu Irsku.
|
|
The
Protocol on Ireland and Northern Ireland for PSIs in the Republic of
Croatia (for the reporting period from January 2021 onwards) means that the
dispatch and arrival of goods to and from Northern Ireland must still be
reported in Intrastat forms, and data are included in data on trade in
goods with EU Member States. As of 1 January 2021, trade in goods with the
United Kingdom is included under Other countries in Europe, and exclude the
data for Northern Ireland.
|
|
|
|
|
|
Članstvo
u OPEC-u podložno je čestim promjenama. Detaljnije informacije o državama
članicama OPEC-a objavljuju se na mrežnim stranicama
https://www.opec.org/.
|
|
OPEC
membership is subject to frequent changes. More detailed information about
Member Countries are published on the website https://www.opec.org/.
|
|
|
|
|
|
Za
određeni mjesec obrađuju se samo Jedinstvene carinske deklaracije koje
imaju datum prihvaćanja u carinarnici/ispostavi iz tog mjeseca i
Intrastatovi obrasci dostavljeni za izvještajni mjesec. U tekućoj godini
mijenjaju se već objavljeni podaci za prijašnje mjesece radi razvrstavanja
naknadno pristiglih i/ili ispravljenih Intrastatovih obrazaca i
Jedinstvenih carinskih deklaracija koje se odnose na prijašnja razdoblja.
|
|
Only
Single Administrative Documents containing the date of acceptance in a
customs office in a particular month are processed for that month as well
as Intrastat forms submitted for the reporting month. Already issued data
for previous months are changed during the current year in order to
classify subsequently received and/or corrected Intrastat forms and Single
Administrative Documents for earlier periods.
|
|
|
|
|
|
Mjesečni
podaci ispravljaju se sve dok se ne zaključi konačna obrada tekuće godine
(sredinom sljedeće godine). Mjesečni rezultati sve do konačne obrade tekuće
godine i objavljivanja konačnih podataka smatraju se privremenima.
|
|
Monthly
data are corrected until final data processing for the current year is done
(the middle of the next year). Monthly data are considered provisional until
the final processing of the current year and dissemination of final data is
done
|
|
|
|
|
|
Podaci
robne razmjene s inozemstvom dostupni su u vremenskim serijama objavljenim
na mrežnim stranicama Državnog zavoda za statistiku na poveznici Statistika
u nizu pod naslovom Gospodarstvo – osnovni pokazatelji (podaci od 2000.) i
pod naslovom Robna razmjena s inozemstvom (podaci od 2010.).
|
|
Data
on foreign trade in goods are available in the time series published on the
website of the Croatian Bureau of Statistics under Statistics in Line;
Economy – Basic Indicators (data from 2000) and Foreign
Trade in Goods (data from 2010).
|
|
|
|
|
|
|
|
|
|
|
|
|
|
Kratice
|
|
Abbreviations
|
|
|
|
|
|
|
|
Cefta
|
Sporazum
o slobodnoj trgovini srednjoeuropskih zemalja
|
|
CEFTA
|
Central European Free Trade Agreement
|
|
cif
|
cijena
s osiguranjem i vozarinom
|
|
CIF
|
cost, insurance and freight
|
|
d. n.
|
drugdje nespomenuto
|
|
EC
|
European Community
|
|
Efta
|
Europsko
udruženje za slobodnu trgovinu
|
|
EFTA
|
European Free Trade Association
|
|
EU
|
Europska unija
|
|
EU
|
European Union
|
|
Eurostat
|
Statistički ured Europske unije
|
|
Eurostat
|
Statistical Office of the European Communities
|
|
EZ
|
Europska zajednica
|
|
FOB
|
free on board
|
|
fob
|
franko brod
|
|
NACE
|
Statistical Classification of Economic
Activities
|
|
NACE
|
Statistička
klasifikacija ekonomskih djelatnosti u
|
|
|
in the European Community
|
|
|
Europskoj zajednici
|
|
n. e. c.
|
not elsewhere classified
|
|
NKD
2007.
|
Nacionalna klasifikacija djelatnosti, verzija 2007.
|
|
n. e.
s.
|
not elsewhere specified
|
|
NN
|
Narodne novine
|
|
NKD
2007.
|
National Classification of Activities, 2007 version
|
|
OPEC
|
Organizacija zemalja izvoznica nafte
|
|
NN
|
Narodne novine, official gazette of the Republic of
Croatia
|
|
SAD
|
Sjedinjene Američke Države
|
|
OPEC
|
Organization of Petroleum Exporting Countries
|
|
SMTK
|
Standardna međunarodna trgovinska klasifikacija
|
|
PSI
|
provider of statistical information
|
|
tis.
|
tisuća
|
|
SITC
|
Standard International Trade Classification
|
|
UN
|
Ujedinjeni narodi
|
|
UN
|
United Nations
|
|
USD
|
američki dolar
|
|
US $
|
American dollar
|
|
|
|
|
|
|
|
|
|
|
|
|
|
Znakovi
|
|
|
Symbols
|
|
|
|
|
|
|
|
|
-
|
nema pojave
|
|
-
|
no occurrence
|
|
0
|
podatak
je manji od 0,5 upotrijebljene mjerne jedinice
|
|
0
|
value not zero but less than 0.5 of the unit of
measure used
|
|
…
|
ne raspolaže se podatkom
|
|
...
|
data not available
|
Objavljuje Državni zavod za statistiku
Republike Hrvatske, Zagreb, Ilica 3, p. p. 80.
Published by the Croatian Bureau of
Statistics, Zagreb, Ilica 3, P. O. B. 80
Telefon/ Phone: +385
(0) 1 4806-111, telefaks/ Fax: +385 (0) 1 4817-666
Novinarski upiti/ Press
corner: press@dzs.hr
Odgovorne osobe:
Persons responsible:
Milenka Primorac Čačić, načelnica Sektora poslovnih
statistika
Milenka Primorac Čačić, Director of Business Statistics
Directorate
Lidija Brković, glavna
ravnateljica
Lidija Brković, Director
General
Priredili: Boro Žderić i Tamara Dodig Marić
Prepared by: Boro Žderić and Tamara
Dodig Marić
|
|
MOLIMO KORISNIKE DA PRI
KORIŠTENJU PODATAKA NAVEDU IZVOR.
USERS ARE KINDLY
REQUESTED TO STATE THE SOURCE.
|
|
Služba za odnose s korisnicima i zaštitu
podataka
Customer Relations and Data
Protection Department
|
Informacije i korisnički zahtjevi
Information and user requests
|
|
Pretplata publikacija
Subscription
|
|
|
|
|
|
Telefon/
Phone: +385 (0) 1 4806-138, 4806-154
Elektronička
pošta/ E-mail: stat.info@dzs.hr
Telefaks/ Fax: +385 (0) 1 4806-148
|
|
Telefon/
Phone: +385 (0) 1 4806-115
Elektronička
pošta/ E-mail: prodaja@dzs.hr
Telefaks/ Fax: +385 (0) 1 4806-148
|
|