|

|
GODINA/ YEAR:
LVIII.
|
ZAGREB,
16.
SRPNJA 2021./ 16 JULY, 2021
|
BROJ/ NUMBER: 13.1.1/6.
|
CODEN POPCEA ISSN 1330-0350
INDEKSI POTROŠAČKIH CIJENA U LIPNJU 2021.
CONSUMER PRICE INDICES, JUNE 2021
|
Cijene
dobara i usluga za osobnu potrošnju, mjerene indeksom potrošačkih cijena, u
lipnju 2021. u odnosu na svibanj 2021. u prosjeku su ostale na istoj
razini. U odnosu na lipanj 2020., tj. na godišnjoj razini, u prosjeku su
više za 2,0%, dok su u godišnjem prosjeku više
za 0,5%.
|
|
In
June 2021, as compared to May 2021, the prices of goods and services for
personal consumption, measured by the consumer price index, remained at the
same level on average. As compared to June 2020, that is, at the annual
level, they increased by 2.0% on average, while on the annual average they
increased by 0.5%.
|
|
|
|
|
|
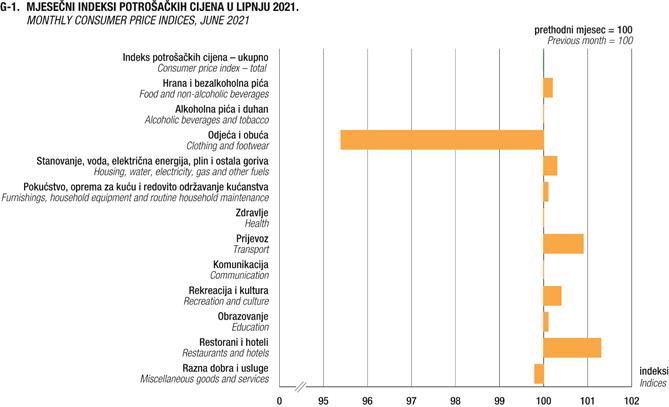
Promatrano
po glavnim skupinama prema namjeni potrošnje, u lipnju 2021. u odnosu na
svibanj 2021. najviše su porasle cijene Restorana i hotela, koje su u
prosjeku više za 1,3% (više cijene Usluga smještaja), cijene Prijevoza,
koje su u prosjeku više za 0,9%, cijene Rekreacije i kulture, koje su u
prosjeku više za 0,4%, cijene Stanovanja, vode, električne energije, plina
i ostalih goriva,
koje
su u prosjeku više za 0,3%, cijene Hrane i bezalkoholnih pića, koje su u prosjeku
više za 0,2%, te cijene Pokućstva, opreme za kuću i redovitog održavanja
kućanstva i cijene Obrazovanja, koje su u prosjeku po svakoj skupini više
za 0,1%.
|
|
Viewed
by main groups by purpose of consumption, in June 2021, as compared to May
2021, the highest increase was recorded in the prices
of
Restaurants
and hotels, by 1.3% on average (higher
prices of Accommodation services), in the prices of Transport, by 0.9% on
average, in the prices of Recreation and culture, by 0.4% on average, in
the prices of Housing, water, electricity, gas and others fuels, by 0.3% on
average, in the prices of Food and non-alcoholic
beverages, by 0.2% on average, as well as in the prices of Furnishings,
household equipment and routine household maintenance, and
the prices of Education, by 0.1%
(in each group) on average.
|
|
|
|
|
|
Porast
indeksa potrošačkih cijena u lipnju 2021. u odnosu na svibanj 2021.
ublažile su cijene Odjeće i obuće, koje su u prosjeku niže za 4,6%, te
cijene Raznih dobara i usluga, koje su u prosjeku niže za 0,2%.
|
|
The
increase in the consumer price indices in June 2021, as compared to May
2021, was alleviated by a decrease of 4.6% on average in the prices of Clothing
and footwear and of 0.2% on average in the prices of
Miscellaneous goods and services.
|
|
|
|
|
|
Istodobno
su cijene Alkoholnih pića i duhana, cijene Zdravlja i cijene Komunikacija u
lipnju 2021. u odnosu na svibanj 2021. u prosjeku ostale na razini cijena
iz svibnja 2021.
|
|
At
the same time, in June 2021, as compared to May 2021, the prices of Alcoholic
beverages and tobacco, the prices of Health and the prices of Communication
remained on average at the May 2021 level.
|
|
|
|
|
|
Najveći
doprinos porastu indeksa potrošačkih cijena u lipnju 2021. u odnosu na
svibanj 2021. imale su cijene Prijevoza (za 0,12%), a najveći doprinos
padu indeksa imale su cijene Odjeće i obuće (za
-0,26%).
|
|
The
prices of Transport (by
0.12%) contributed the most to the increase in the
consumer price indices in June 2021, as compared to May 2021, while
the prices of Clothing and footwear contributed the most to their decrease (by
-0.26%).
|
|
|
|
|
|
U
sklopu indeksa potrošačkih cijena, cijene Dobara u lipnju 2021. u odnosu na
svibanj 2021. u prosjeku su niže za 0,1%, dok su cijene Usluga u prosjeku
više za 0,3%.
|
|
Within
the consumer price indices, in June 2021, as compared to May 2021, the
prices of Goods decreased by 0.1% on average, while the prices of Services
increased by 0.3% on average.
|
1. INDEKSI
POTROŠAČKIH CIJENA U LIPNJU 2021.
CONSUMER
PRICE INDICES, JUNE 2021
|
|
COICOP
|
Struktura
Structure (%)
|
VI. 2021.
Ø 2015.
|
VI. 2021.
VI. 2020.
|
VI. 2021.
V. 2021.
|
I. − VI. 2021.
I. − VI. 2020.
|
VII. 2020. − VI. 2021.
VII. 2019. −
VI. 2020.
|
|
COICOP
|
|
|
|
|
|
|
|
|
|
|
|
|
00
|
Indeks potrošačkih cijena – ukupno
|
100,00
|
104,6
|
102,0
|
100,0
|
101,2
|
100,5
|
00
|
Consumer price index – total
|
|
|
|
|
|
|
|
|
|
|
|
|
01
|
Hrana i
bezalkoholna pića
|
27,20
|
105,8
|
99,9
|
100,2
|
99,3
|
100,0
|
01
|
Food
and non-alcoholic beverages
|
|
01.1
|
Hrana
|
24,65
|
105,5
|
100,0
|
100,3
|
98,9
|
99,7
|
01.1
|
Food
|
|
01.1.1
|
Kruh i žitarice
|
4,69
|
106,2
|
100,9
|
100,8
|
100,5
|
100,5
|
01.1.1
|
Bread
and cereals
|
|
01.1.2
|
Meso
|
7,18
|
104,5
|
99,0
|
100,6
|
97,5
|
99,5
|
01.1.2
|
Meat
|
|
01.1.3
|
Riba i plodovi mora
|
0,94
|
104,1
|
99,3
|
99,3
|
97,8
|
98,3
|
01.1.3
|
Fish
and seafood
|
|
01.1.4
|
Mlijeko, sir i jaja
|
3,91
|
103,7
|
100,5
|
101,5
|
98,4
|
98,5
|
01.1.4
|
Milk,
cheese and eggs
|
|
01.1.5
|
Ulja i masti
|
0,89
|
112,7
|
106,4
|
101,6
|
101,8
|
99,4
|
01.1.5
|
Oils
and fats
|
|
01.1.6
|
Voće
|
1,84
|
107,3
|
96,4
|
99,3
|
98,9
|
102,6
|
01.1.6
|
Fruit
|
|
01.1.7
|
Povrće
|
2,37
|
104,2
|
99,6
|
97,0
|
97,7
|
97,8
|
01.1.7
|
Vegetables
|
|
01.1.8
|
Šećer,
džem, med, čokolada i slatkiši
|
1,55
|
103,3
|
100,3
|
100,7
|
100,4
|
100,5
|
01.1.8
|
Sugar,
jam, honey, chocolate and confectionery
|
|
01.1.9
|
Prehrambeni proizvodi,
d. n.
|
1,28
|
111,9
|
101,6
|
100,3
|
102,2
|
102,2
|
01.1.9
|
Food
products n. e. c.
|
|
01.2
|
Bezalkoholna pića
|
2,55
|
109,3
|
99,5
|
99,2
|
102,6
|
103,1
|
01.2
|
Non-alcoholic beverages
|
|
01.2.1
|
Kava, čaj i kakao
|
1,06
|
104,3
|
98,4
|
99,4
|
99,7
|
99,8
|
01.2.1
|
Coffee,
tea and cocoa
|
|
01.2.2
|
Mineralna voda,
osvježavajuća pića, sokovi od voća i povrća
|
1,49
|
113,2
|
100,3
|
99,0
|
104,8
|
105,5
|
01.2.2
|
Mineral
waters, soft drinks, fruit and vegetable juices
|
|
|
|
|
|
|
|
|
|
|
|
|
02
|
Alkoholna pića i
duhan
|
5,20
|
121,9
|
105,8
|
100,0
|
106,2
|
105,5
|
02
|
Alcoholic
beverages and tobacco
|
|
02.1
|
Alkoholna pića
|
1,15
|
107,5
|
101,2
|
99,9
|
101,9
|
102,4
|
02.1
|
Alcoholic
beverages
|
|
02.1.1
|
Jaka alkoholna pića
|
0,18
|
111,6
|
100,4
|
100,0
|
104,4
|
106,3
|
02.1.1
|
Spirits
|
|
02.1.2
|
Vino
|
0,41
|
107,7
|
101,0
|
100,4
|
101,6
|
103,1
|
02.1.2
|
Wine
|
|
02.1.3
|
Pivo
|
0,56
|
105,9
|
101,6
|
99,5
|
101,3
|
100,8
|
02.1.3
|
Beer
|
|
02.2
|
Duhan
|
4,05
|
126,6
|
107,1
|
100,0
|
107,4
|
106,3
|
02.2
|
Tobacco
|
|
|
|
|
|
|
|
|
|
|
|
|
03
|
Odjeća i obuća
|
5,68
|
98,1
|
100,1
|
95,4
|
99,4
|
99,3
|
03
|
Clothing
and footwear
|
|
03.1
|
Odjeća
|
3,98
|
99,8
|
101,8
|
94,6
|
100,3
|
100,2
|
03.1
|
Clothing
|
|
03.1.1
|
Materijal za izradu
odjeće
|
0,01
|
104,5
|
100,6
|
100,0
|
101,4
|
101,4
|
03.1.1
|
Clothing
materials
|
|
03.1.2
|
Odjeća
|
3,88
|
99,7
|
101,8
|
94,5
|
100,3
|
100,3
|
03.1.2
|
Garments
|
|
03.1.3
|
Ostali odjevni
predmeti i odjevni dodaci
|
0,06
|
94,2
|
98,2
|
99,0
|
96,4
|
97,5
|
03.1.3
|
Other
articles of clothing and clothing accessories
|
|
03.1.4
|
Čišćenje, popravak i
iznajmljivanje odjeće
|
0,03
|
104,3
|
100,1
|
99,9
|
99,6
|
99,9
|
03.1.4
|
Cleaning,
repair and hire of clothing
|
|
03.2
|
Obuća
|
1,70
|
94,9
|
96,5
|
97,5
|
97,5
|
97,4
|
03.2
|
Footwear
|
|
03.2.1
|
Cipele i ostala obuća
|
1,70
|
94,8
|
96,5
|
97,5
|
97,5
|
97,4
|
03.2.1
|
Shoes
and other footwear
|
|
|
|
|
|
|
|
|
|
|
|
|
04
|
Stanovanje,
voda, električna energija, plin i ostala goriva
|
17,73
|
100,9
|
101,6
|
100,3
|
100,5
|
99,4
|
04
|
Housing,
water, electricity, gas and other fuels
|
|
04.1
|
Stvarne najamnine za
stanovanje
|
0,87
|
108,8
|
100,5
|
100,3
|
100,0
|
100,7
|
04.1
|
Actual
rentals for housing
|
|
04.3
|
Održavanje
i popravci stambenog objekta
|
0,91
|
112,9
|
105,2
|
100,9
|
103,6
|
103,1
|
04.3
|
Maintenance
and repair of the dwelling
|
|
04.3.1
|
Proizvodi za održavanje
i popravke stambenog objekta
|
0,42
|
108,5
|
103,7
|
101,8
|
101,7
|
101,5
|
04.3.1
|
Materials
for the maintenance and repair of the dwelling
|
|
04.3.2
|
Usluge za održavanje
i popravke stambenog objekta
|
0,49
|
121,5
|
106,7
|
100,1
|
105,4
|
104,8
|
04.3.2
|
Services
for the maintenance and repair of the dwelling
|
|
04.4
|
Opskrba vodom i razne
komunalne usluge za stambeni objekt
|
5,40
|
109,0
|
100,5
|
100,0
|
100,7
|
100,7
|
04.4
|
Water
supply and miscellaneous services relating to the dwelling
|
|
04.4.1
|
Opskrba vodom
|
2,56
|
106,1
|
100,0
|
100,0
|
100,1
|
100,2
|
04.4.1
|
Water
supply
|
|
04.4.2
|
Odvoz smeća i otpada
|
0,96
|
105,2
|
101,6
|
100,0
|
101,8
|
101,2
|
04.4.2
|
Refuse
collection
|
|
04.4.3
|
Odvodnja otpadnih voda
|
1,25
|
115,4
|
100,0
|
100,0
|
100,3
|
100,9
|
04.4.3
|
Sewage
collection
|
|
04.4.4
|
Ostale usluge za
stambeni objekt, d. n.
|
0,63
|
114,7
|
101,8
|
100,1
|
102,2
|
101,8
|
04.4.4
|
Other
services relating to the dwelling n. e. c.
|
|
04.5
|
Električna
energija, plin i ostala goriva
|
10,55
|
96,2
|
101,9
|
100,4
|
100,2
|
98,4
|
04.5
|
Electricity,
gas and other fuels
|
|
04.5.1
|
Električna energija
|
5,50
|
97,5
|
100,0
|
100,0
|
100,0
|
100,4
|
04.5.1
|
Electricity
|
|
04.5.2
|
Plin
|
2,23
|
95,8
|
110,7
|
100,8
|
105,2
|
101,4
|
04.5.2
|
Gas
|
|
04.5.3
|
Tekuća goriva
|
0,18
|
102,7
|
143,4
|
104,2
|
116,3
|
88,7
|
04.5.3
|
Liquid
fuels
|
|
04.5.4
|
Kruta goriva
|
2,27
|
94,5
|
96,0
|
100,4
|
95,1
|
92,2
|
04.5.4
|
Solid
fuels
|
|
04.5.5
|
Toplinska energija
|
0,37
|
98,9
|
99,8
|
100,0
|
99,6
|
99,7
|
04.5.5
|
Heat
energy
|
|
|
|
|
|
|
|
|
|
|
|
|
05
|
Pokućstvo,
oprema za kuću i redovito održavanje kućanstva
|
5,17
|
102,0
|
99,9
|
100,1
|
100,0
|
100,0
|
05
|
Furnishings,
household equipment and routine household maintenance
|
|
05.1
|
Namještaj i pokućstvo,
tepisi i druge podne obloge
|
1,31
|
105,9
|
100,2
|
99,9
|
99,7
|
99,6
|
05.1
|
Furniture
and furnishings, carpets and other floor coverings
|
|
05.1.1
|
Namještaj i pokućstvo
|
1,25
|
106,2
|
100,4
|
99,9
|
99,8
|
99,7
|
05.1.1
|
Furniture
and furnishings
|
|
05.1.2
|
Tepisi i ostale podne prostirke
|
0,05
|
97,0
|
96,5
|
99,6
|
97,6
|
97,5
|
05.1.2
|
Carpets and
other floor coverings
|
|
05.1.3
|
Popravci namještaja, pokućstva i
podnih prostirki
|
0,01
|
116,5
|
103,3
|
101,3
|
101,1
|
100,9
|
05.1.3
|
Repair of
furniture, furnishings and floor coverings
|
|
05.2
|
Tekstilni proizvodi za kućanstvo
|
0,23
|
92,3
|
99,0
|
100,1
|
98,0
|
98,4
|
05.2
|
Household
textiles
|
|
05.3
|
Kućanski aparati
|
0,87
|
102,0
|
101,5
|
100,1
|
101,4
|
100,6
|
05.3
|
Household
appliances
|
|
05.3.1
|
Veliki kućanski aparati,
električni ili neelektrični
|
0,75
|
102,1
|
101,5
|
100,3
|
101,4
|
100,6
|
05.3.1
|
Major
household appliances whether
electric or
not
|
|
05.3.2
|
Mali električni kućanski
aparati
|
0,10
|
101,2
|
102,6
|
98,6
|
102,3
|
101,1
|
05.3.2
|
Small
electric household appliances
|
|
05.3.3
|
Popravak kućanskih aparata
|
0,02
|
99,2
|
100,2
|
100,2
|
99,0
|
99,3
|
05.3.3
|
Repair of
household appliances
|
|
05.4
|
Stakleno i stolno posuđe te kućanski
pribor
|
0,18
|
101,4
|
97,9
|
100,5
|
96,9
|
97,8
|
05.4
|
Glassware,
tableware and household utensils
|
|
05.5
|
Alati i oprema za kuću i vrt
|
0,42
|
101,2
|
99,0
|
100,2
|
98,9
|
98,7
|
05.5
|
Tools and
equipment for house and garden
|
|
05.5.1
|
Veći alati i
oprema
|
0,18
|
111,6
|
99,3
|
99,9
|
99,9
|
100,1
|
05.5.1
|
Major tools
and equipment
|
|
05.5.2
|
Mali alati i razni pribor
|
0,24
|
93,8
|
98,7
|
100,4
|
98,1
|
97,7
|
05.5.2
|
Small tools
and miscellaneous accessories
|
|
05.6
|
Dobra i usluge za redovito
održavanje kućanstva
|
2,16
|
101,0
|
99,6
|
100,3
|
100,3
|
100,6
|
05.6
|
Goods and
services for routine household maintenance
|
|
05.6.1
|
Potrošna dobra za održavanje
kućanstva
|
1,98
|
100,8
|
99,5
|
100,3
|
100,2
|
100,5
|
05.6.1
|
Non-durable
household goods
|
|
05.6.2
|
Usluge
pomoći u domaćinstvu i kućanske usluge
|
0,18
|
103,4
|
100,3
|
100,0
|
101,4
|
101,8
|
05.6.2
|
Domestic
services and household Services
|
|
|
|
|
|
|
|
|
|
|
|
|
06
|
Zdravlje
|
3,09
|
105,8
|
101,1
|
100,0
|
101,3
|
101,2
|
06
|
Health
|
|
06.1
|
Medicinski proizvodi, pomagala i
oprema
|
2,03
|
103,6
|
99,7
|
99,9
|
99,8
|
100,1
|
06.1
|
Medical
products, appliances and equipment
|
|
06.1.1
|
Farmaceutski proizvodi
|
1,71
|
103,3
|
99,3
|
99,9
|
99,6
|
100,0
|
06.1.1
|
Pharmaceutical
products
|
|
06.1.2
|
Ostali medicinski proizvodi
|
0,02
|
101,5
|
98,0
|
98,8
|
101,9
|
104,3
|
06.1.2
|
Other
medical products
|
|
06.1.3
|
Terapeutska pomagala i oprema
|
0,30
|
105,3
|
102,0
|
100,2
|
101,1
|
100,6
|
06.1.3
|
Therapeutic
appliances and equipment
|
|
06.2
|
Izvanbolničke usluge
|
0,91
|
109,9
|
104,3
|
100,2
|
104,6
|
103,9
|
06.2
|
Out-patient
services
|
|
06.2.1
|
Medicinske usluge
|
0,27
|
111,6
|
102,6
|
100,0
|
103,5
|
103,3
|
06.2.1
|
Medical
services
|
|
06.2.2
|
Stomatološke usluge
|
0,49
|
109,6
|
105,7
|
100,0
|
106,0
|
104,6
|
06.2.2
|
Dental
services
|
|
06.2.3
|
Paramedicinske usluge
|
0,15
|
109,0
|
103,2
|
101,2
|
102,5
|
102,4
|
06.2.3
|
Paramedical
services
|
|
06.3
|
Bolničke
usluge
|
0,15
|
116,6
|
100,2
|
100,0
|
100,1
|
100,0
|
06.3
|
Hospital services
|
|
|
|
|
|
|
|
|
|
|
|
|
07
|
Prijevoz
|
13,30
|
105,1
|
109,0
|
100,9
|
105,4
|
100,2
|
07
|
Transport
|
|
07.1
|
Kupnja vozila
|
3,26
|
90,3
|
98,8
|
100,1
|
98,2
|
97,9
|
07.1
|
Purchase
of vehicles
|
|
07.1.1
|
Motorna vozila
|
3,19
|
89,4
|
98,6
|
100,1
|
98,0
|
97,7
|
07.1.1
|
Motor
cars
|
|
07.1.2
|
Motocikli
|
0,01
|
113,9
|
101,9
|
100,0
|
101,8
|
102,2
|
07.1.2
|
Motor
cycles
|
|
07.1.3
|
Bicikli
|
0,06
|
122,9
|
107,4
|
101,4
|
109,0
|
109,0
|
07.1.3
|
Bicycles
|
|
07.2
|
Održavanje osobnih
prijevoznih sredstava
|
9,05
|
109,6
|
113,4
|
101,2
|
108,3
|
100,6
|
07.2
|
Operation
of personal transport equipment
|
|
07.2.1
|
Rezervni dijelovi i
pribor za osobna prijevozna sredstva
|
0,90
|
108,1
|
102,6
|
100,7
|
102,7
|
102,5
|
07.2.1
|
Spare
parts and accessories for personal transport equipment
|
|
07.2.2
|
Goriva i maziva za
osobna prijevozna sredstva
|
5,87
|
111,6
|
119,3
|
101,6
|
111,4
|
100,1
|
07.2.2
|
Fuels
and lubricants for personal transport equipment
|
|
07.2.3
|
Održavanje i popravci
osobnih prijevoznih sredstava
|
0,96
|
110,0
|
106,9
|
100,0
|
106,7
|
105,3
|
07.2.3
|
Maintenance
and repair of personal transport equipment
|
|
07.2.4
|
Ostale usluge povezane
s osobnim prijevoznim sredstvima
|
1,32
|
102,2
|
100,0
|
100,3
|
99,7
|
99,4
|
07.2.4
|
Other
services in respect of personal transport equipment
|
|
07.3
|
Usluge prijevoza
|
0,99
|
100,4
|
104,2
|
100,5
|
103,7
|
101,8
|
07.3
|
Transport
services
|
|
07.3.1
|
Željeznički
putnički prijevoz
|
0,11
|
94,6
|
100,0
|
100,0
|
100,0
|
100,2
|
07.3.1
|
Passenger
transport by railway
|
|
07.3.2
|
Cestovni putnički
prijevoz
|
0,60
|
97,2
|
100,1
|
100,0
|
100,1
|
100,1
|
07.3.2
|
Passenger
transport by road
|
|
07.3.3
|
Zračni
putnički prijevoz
|
0,10
|
118,9
|
126,9
|
98,9
|
125,7
|
112,0
|
07.3.3
|
Passenger
transport by air
|
|
07.3.4
|
Putnički pomorski
prijevoz i prijevoz unutarnjim vodnim putovima
|
0,03
|
108,8
|
118,1
|
118,1
|
103,1
|
98,4
|
07.3.4
|
Passenger
transport by sea and inland waterway
|
|
07.3.5
|
Kombinirani
prijevoz putnika
|
0,15
|
93,6
|
100,0
|
100,0
|
100,0
|
100,0
|
07.3.5
|
Combined passenger transport
|
|
|
|
|
|
|
|
|
|
|
|
|
08
|
Komunikacija
|
6,16
|
97,9
|
101,2
|
100,0
|
101,1
|
101,4
|
08
|
Communication
|
|
08.1
|
Poštanske usluge
|
0,08
|
140,1
|
137,2
|
100,0
|
120,1
|
113,8
|
08.1
|
Postal
services
|
|
08.2
|
Telefonska i telefaks oprema
|
0,35
|
86,3
|
98,7
|
100,1
|
99,2
|
98,2
|
08.2
|
Telephone
and telefax equipment
|
|
08.3
|
Telefonske i telefaks usluge
|
5,73
|
98,1
|
100,8
|
100,0
|
100,9
|
101,4
|
08.3
|
Telephone
and telefax services
|
|
|
|
|
|
|
|
|
|
|
|
|
09
|
Rekreacija i kultura
|
5,34
|
103,8
|
101,5
|
100,4
|
101,7
|
101,3
|
09
|
Recreation and culture
|
|
09.1
|
Audiovizualna
i fotooprema i informatička oprema
|
0,64
|
93,5
|
101,0
|
99,7
|
100,0
|
99,1
|
09.1
|
Audio-visual, photographic and Information
processing equipment
|
|
09.1.1
|
Oprema za prijam, snimanje i
reprodukciju zvuka i slike
|
0,30
|
90,0
|
101,1
|
99,6
|
99,5
|
98,2
|
09.1.1
|
Equipment
for the reception, recording and reproduction of sound and picture
|
|
09.1.2
|
Fotografska i kinematografska
oprema i optički
instrumenti
|
0,05
|
100,6
|
101,2
|
99,9
|
101,8
|
101,1
|
09.1.2
|
Photographic
and cinematographic equipment and optical instruments
|
|
09.1.3
|
Informatička oprema za obradu
podataka
|
0,26
|
97,3
|
101,6
|
99,7
|
100,9
|
100,2
|
09.1.3
|
Information
processing equipment
|
|
09.1.4
|
Mediji za snimanje
|
0,02
|
85,7
|
92,7
|
99,3
|
92,6
|
94,5
|
09.1.4
|
Recording
media
|
|
09.3
|
Ostali predmeti i oprema za
rekreaciju, vrtove i kućne ljubimce
|
1,42
|
106,6
|
101,5
|
100,4
|
101,3
|
101,2
|
09.3
|
Other
recreational items and equipment, gardens and pets
|
|
09.3.1
|
Igre, igračke i hobiji
|
0,16
|
96,9
|
99,2
|
100,4
|
99,3
|
98,8
|
09.3.1
|
Games, toys
and hobbies
|
|
09.3.2
|
Oprema za sport, kampiranje i rekreaciju
na otvorenom
|
0,12
|
97,1
|
101,7
|
100,2
|
100,0
|
99,2
|
09.3.2
|
Equipment
for sport, camping and open-air recreation
|
|
09.3.3
|
Vrtovi, biljke i cvijeće
|
0,47
|
105,7
|
103,3
|
100,4
|
102,5
|
101,5
|
09.3.3
|
Gardens,
plants and flowers
|
|
09.3.4
|
Kućni ljubimci
i proizvodi za kućne ljubimce
|
0,52
|
113,0
|
101,1
|
100,6
|
101,5
|
102,2
|
09.3.4
|
Pets and
related products
|
|
09.3.5
|
Veterinarske i ostale usluge za
kućne ljubimce
|
0,15
|
98,8
|
100,0
|
100,0
|
100,0
|
100,0
|
09.3.5
|
Veterinary
and other services for pets
|
|
09.4
|
Rekreativne i kulturne
usluge
|
1,92
|
101,8
|
100,9
|
100,3
|
101,1
|
101,1
|
09.4
|
Recreational
and cultural services
|
|
09.4.1
|
Rekreativne i sportske
usluge
|
0,33
|
92,8
|
101,9
|
100,1
|
102,8
|
103,1
|
09.4.1
|
Recreational
and sporting services
|
|
09.4.2
|
Kulturne usluge
|
1,59
|
103,7
|
100,6
|
100,3
|
100,7
|
100,5
|
09.4.2
|
Cultural
services
|
|
09.5
|
Novine, knjige i
pribor za pisanje
|
0,94
|
105,7
|
104,0
|
100,1
|
103,7
|
101,8
|
09.5
|
Newspapers,
books and stationery
|
|
09.5.1
|
Knjige
|
0,41
|
88,5
|
108,6
|
100,0
|
108,1
|
102,7
|
09.5.1
|
Books
|
|
09.5.2
|
Novine i periodika
|
0,34
|
130,7
|
100,2
|
100,0
|
100,1
|
100,8
|
09.5.2
|
Newspapers
and periodicals
|
|
09.5.3
|
Razni tiskani
materijal
|
0,01
|
107,9
|
100,3
|
100,0
|
100,7
|
101,8
|
09.5.3
|
Miscellaneous
printed matter
|
|
09.6
|
Paket-aranžmani
|
0,41
|
113,4
|
102,5
|
103,2
|
103,2
|
103,3
|
09.6
|
Package
holidays
|
|
|
|
|
|
|
|
|
|
|
|
|
10
|
Obrazovanje
|
0,81
|
101,9
|
100,8
|
100,1
|
100,3
|
99,9
|
10
|
Education
|
|
|
|
|
|
|
|
|
|
|
|
|
11
|
Restorani i
hoteli
|
3,69
|
117,6
|
102,7
|
101,3
|
101,6
|
101,2
|
11
|
Restaurants
and hotels
|
|
11.1
|
Ugostiteljske usluge
|
3,33
|
118,5
|
102,7
|
100,2
|
101,7
|
101,4
|
11.1
|
Catering
services
|
|
11.1.1
|
Restorani, kafići i
slično
|
3,05
|
119,4
|
102,9
|
100,3
|
101,8
|
101,3
|
11.1.1
|
Restaurants,
cafés and the like
|
|
11.1.2
|
Kantine
|
0,28
|
111,9
|
100,3
|
100,1
|
100,2
|
101,2
|
11.1.2
|
Canteens
|
|
11.2
|
Usluge smještaja
|
0,36
|
108,8
|
104,4
|
111,5
|
100,9
|
98,8
|
11.2
|
Accommodation
services
|
|
|
|
|
|
|
|
|
|
|
|
|
12
|
Razna dobra i
usluge
|
6,63
|
103,6
|
99,4
|
99,8
|
100,5
|
101,3
|
12
|
Miscellaneous
goods and services
|
|
12.1
|
Osobna njega
|
3,91
|
102,2
|
98,8
|
99,5
|
100,5
|
101,3
|
12.1
|
Personal
care
|
|
12.1.1
|
Frizerski saloni i
centri za uljepšavanje
|
1,19
|
107,2
|
100,2
|
100,0
|
103,3
|
104,1
|
12.1.1
|
Hairdressing
salons and personal grooming establishments
|
|
12.1.2
|
Električni
uređaji za osobnu njegu
|
0,01
|
100,4
|
99,2
|
99,9
|
99,1
|
99,9
|
12.1.2
|
Electric
appliances for personal care
|
|
12.1.3
|
Ostali uređaji,
predmeti i proizvodi za osobnu njegu
|
2,71
|
100,1
|
98,2
|
99,3
|
99,4
|
100,1
|
12.1.3
|
Other
appliances, articles and products for personal care
|
|
12.3
|
Osobni predmeti, d. n.
|
0,28
|
100,1
|
99,6
|
100,3
|
99,6
|
99,1
|
12.3
|
Personal
effects n. e. c.
|
|
12.3.1
|
Nakit, zidni, stolni i
ručni satovi
|
0,03
|
127,1
|
109,6
|
101,2
|
112,5
|
113,8
|
12.3.1
|
Jewellery,
clocks and watches
|
|
12.4
|
Socijalna zaštita
|
0,17
|
107,2
|
99,5
|
100,0
|
100,1
|
100,7
|
12.4
|
Social
protection
|
|
12.5
|
Osiguranje
|
1,12
|
105,3
|
100,7
|
100,1
|
100,5
|
101,1
|
12.5
|
Insurance
|
|
12.5.2
|
Osiguranje povezano sa
stambenim objektom
|
0,06
|
105,5
|
104,6
|
100,0
|
102,8
|
101,0
|
12.5.2
|
Insurance
connected with the dwelling
|
|
12.5.3
|
Zdravstveno osiguranje
|
0,33
|
100,0
|
100,0
|
100,0
|
96,4
|
95,9
|
12.5.3
|
Insurance
connected with health
|
|
12.5.4
|
Osiguranje povezano s prijevozom
|
0,73
|
108,2
|
100,8
|
100,2
|
102,3
|
103,8
|
12.5.4
|
Insurance
connected with transport
|
|
12.6
|
Financijske usluge, d. n.
|
0,58
|
116,0
|
107,2
|
100,0
|
107,2
|
106,5
|
12.6
|
Financial
services n. e. c.
|
|
12.7
|
Ostale usluge, d. n.
|
0,57
|
101,1
|
95,2
|
100,0
|
96,9
|
99,6
|
12.7
|
Other
services n. e. c.
|
2. INDEKSI
POTROŠAČKIH CIJENA PO POSEBNIM SKUPINAMA U LIPNJU 2021.
CONSUMER
PRICE INDICES, BY SELECTED GROUPS, JUNE 2021
|
|
Struktura
Structure (%)
|
VI. 2021.
Ø 2015.
|
VI. 2021.
VI. 2020.
|
VI. 2021.
V. 2021.
|
I. − VI. 2021.
I. − VI. 2020.
|
VII. 2020. −
VI.
2021.
VII.
2019. −
VI.
2020.
|
|
|
|
|
|
|
|
|
|
|
|
Dobra
|
74,79
|
104,0
|
102,1
|
99,9
|
101,1
|
100,1
|
Goods
|
|
Usluge
|
25,21
|
106,2
|
101,6
|
100,3
|
101,6
|
101,6
|
Services
|
|
Ukupno bez
energije
|
83,58
|
105,2
|
100,9
|
99,9
|
100,6
|
100,8
|
Total, without energy
|
|
Ukupno bez
energije i hrane
|
58,93
|
105,1
|
101,2
|
99,7
|
101,3
|
101,2
|
Total, without energy and food
|
|
Ukupno bez
energije, hrane, pića i duhana
|
51,18
|
103,4
|
100,8
|
99,7
|
100,7
|
100,7
|
Total, without energy, food, beverages and tobacco
|
|
Ukupno bez
energije i neprerađenih prehrambenih proizvoda
|
74,98
|
105,7
|
101,0
|
99,9
|
101,0
|
101,0
|
Total, without energy and unprocessed food
|
|
Dobra bez
električne energije
|
69,29
|
104,5
|
102,3
|
99,9
|
101,2
|
100,1
|
Goods without electricity
|
|
Dobra bez
električne energije i vode
|
66,73
|
104,5
|
102,4
|
99,9
|
101,2
|
100,1
|
Goods without electricity and water supply
|
|
Industrijski
neprehrambeni proizvodi bez energije
|
25,97
|
100,5
|
100,0
|
99,0
|
99,9
|
99,8
|
Non-food industrial goods without energy
|
|
Energija
|
16,42
|
101,6
|
108,1
|
100,8
|
104,2
|
98,9
|
Energy
|
|
Hrana, piće
i duhan
|
32,40
|
108,3
|
100,9
|
100,1
|
100,4
|
100,9
|
Food, beverages and tobacco
|
|
Dobra bez
hrane, pića i duhana
|
42,39
|
100,8
|
103,1
|
99,7
|
101,6
|
99,4
|
Goods without food, beverages and tobacco
|
|
Neprerađeni
prehrambeni proizvodi
|
8,60
|
102,4
|
99,1
|
99,4
|
97,1
|
98,4
|
Unprocessed food
|
|
Prerađeni
prehrambeni proizvodi
|
23,81
|
110,8
|
101,5
|
100,4
|
101,5
|
101,8
|
Processed
food
|
3. INDEKSI POTROŠAČKIH CIJENA
CONSUMER
PRICE INDICES
Ø
2015. = 100
|
|
I.
|
II.
|
III.
|
IV.
|
V.
|
VI.
|
VII.
|
VIII.
|
IX.
|
X.
|
XI.
|
XII.
|
|
|
|
|
|
|
|
|
|
|
|
|
|
|
|
|
|
|
|
|
|
Ukupno
Total
index
|
|
|
|
|
|
|
|
|
|
|
|
|
|
|
|
|
|
|
|
|
|
1998.
|
63,7
|
64,0
|
64,3
|
64,6
|
65,3
|
65,3
|
65,0
|
64,9
|
65,2
|
65,2
|
65,4
|
65,7
|
|
1999.
|
66,3
|
66,6
|
66,8
|
67,0
|
67,8
|
67,7
|
68,0
|
67,8
|
67,9
|
68,1
|
67,8
|
68,2
|
|
2000.
|
68,8
|
69,1
|
69,5
|
69,9
|
70,1
|
70,8
|
71,3
|
71,2
|
71,4
|
71,6
|
71,7
|
71,9
|
|
2001.
|
72,1
|
72,5
|
72,4
|
73,4
|
74,0
|
73,9
|
73,1
|
73,6
|
73,8
|
73,4
|
73,4
|
73,7
|
|
2002.
|
74,4
|
74,3
|
74,3
|
74,5
|
74,9
|
74,5
|
74,2
|
74,1
|
74,5
|
74,6
|
74,7
|
75,0
|
|
2003.
|
75,4
|
75,6
|
75,9
|
75,7
|
75,9
|
75,6
|
75,7
|
75,8
|
75,9
|
75,9
|
76,1
|
76,3
|
|
2004.
|
77,0
|
77,0
|
77,0
|
77,2
|
77,7
|
77,5
|
77,2
|
77,2
|
77,1
|
77,4
|
77,8
|
78,4
|
|
2005.
|
78,6
|
79,5
|
80,1
|
79,9
|
79,8
|
79,7
|
79,5
|
79,6
|
80,0
|
80,6
|
80,8
|
81,2
|
|
2006.
|
81,7
|
82,3
|
82,4
|
82,6
|
83,0
|
83,0
|
82,3
|
82,3
|
82,3
|
82,3
|
82,8
|
82,9
|
|
2007.
|
83,1
|
83,4
|
83,9
|
84,5
|
84,9
|
84,6
|
84,0
|
84,5
|
85,5
|
85,8
|
86,7
|
87,7
|
|
2008.
|
88,3
|
88,2
|
88,7
|
89,3
|
90,3
|
91,0
|
91,1
|
90,8
|
91,0
|
90,9
|
90,7
|
90,2
|
|
2009.
|
91,3
|
91,9
|
92,1
|
92,8
|
92,8
|
92,8
|
92,2
|
92,1
|
91,9
|
92,0
|
92,4
|
91,9
|
|
2010.
|
92,3
|
92,5
|
92,9
|
93,3
|
93,5
|
93,5
|
93,1
|
92,9
|
93,2
|
93,3
|
93,5
|
93,6
|
|
2011.
|
94,1
|
94,6
|
95,3
|
95,5
|
95,8
|
95,4
|
94,9
|
94,8
|
95,2
|
95,8
|
96,0
|
95,6
|
|
2012.
|
95,2
|
95,8
|
97,2
|
98,0
|
99,6
|
99,0
|
98,1
|
98,6
|
99,9
|
100,4
|
100,2
|
100,0
|
|
2013.
|
100,2
|
100,5
|
100,8
|
101,2
|
101,2
|
101,0
|
100,3
|
100,5
|
101,1
|
100,6
|
100,5
|
100,3
|
|
2014.
|
100,3
|
99,9
|
100,4
|
100,7
|
100,9
|
100,6
|
100,2
|
100,2
|
100,9
|
101,0
|
100,7
|
99,8
|
|
2015.
|
99,3
|
99,5
|
100,5
|
100,6
|
101,0
|
100,6
|
99,8
|
99,6
|
100,0
|
100,1
|
99,8
|
99,2
|
|
2016.
|
98,5
|
98,2
|
98,8
|
98,9
|
99,1
|
99,0
|
98,3
|
98,1
|
99,1
|
99,5
|
99,6
|
99,4
|
|
2017.
|
99,3
|
99,5
|
99,9
|
100,3
|
100,2
|
99,7
|
99,0
|
99,0
|
100,5
|
100,9
|
101,0
|
100,6
|
|
2018.
|
100,4
|
100,3
|
100,9
|
101,7
|
102,1
|
102,1
|
101,1
|
101,1
|
101,9
|
102,5
|
102,3
|
101,5
|
|
2019.
|
100,6
|
100,8
|
101,9
|
102,4
|
103,0
|
102,7
|
102,2
|
101,9
|
102,7
|
103,2
|
103,0
|
102,9
|
|
2020.
|
102,6
|
102,3
|
102,5
|
102,3
|
102,4
|
102,5
|
102,0
|
101,8
|
102,7
|
103,1
|
102,8
|
102,2
|
|
2021.
|
102,3
|
102,6
|
103,7
|
104,4
|
104,6
|
104,6
|
|
|
|
|
|
|
|
|
|
|
|
|
|
|
|
|
|
|
|
|
|
|
|
|
|
|
|
Dobra1)
Goods1)
|
|
|
|
|
|
|
|
|
|
|
|
|
|
|
|
|
|
|
|
|
|
1998.
|
66,2
|
66,4
|
66,5
|
66,8
|
67,0
|
66,8
|
66,3
|
66,2
|
66,5
|
66,5
|
66,7
|
67,0
|
|
1999.
|
67,6
|
68,0
|
68,3
|
68,5
|
68,7
|
68,4
|
68,8
|
68,5
|
68,7
|
68,8
|
68,5
|
69,1
|
|
2000.
|
69,7
|
70,1
|
70,6
|
70,9
|
71,0
|
71,9
|
72,2
|
72,0
|
72,4
|
72,5
|
72,6
|
72,9
|
|
2001.
|
73,0
|
73,5
|
73,4
|
74,4
|
75,2
|
75,0
|
74,0
|
73,9
|
74,1
|
73,6
|
73,5
|
73,8
|
|
2002.
|
74,4
|
74,3
|
74,2
|
74,4
|
74,7
|
74,0
|
73,6
|
73,6
|
74,0
|
74,2
|
74,2
|
74,6
|
|
2003.
|
75,1
|
75,3
|
75,7
|
75,4
|
75,5
|
75,0
|
74,8
|
74,8
|
75,4
|
75,5
|
75,7
|
75,8
|
|
2004.
|
76,7
|
76,5
|
76,5
|
76,7
|
77,1
|
76,6
|
75,9
|
76,0
|
76,0
|
76,5
|
77,0
|
77,7
|
|
2005.
|
77,9
|
79,0
|
79,7
|
79,4
|
79,3
|
79,0
|
78,5
|
78,5
|
79,4
|
79,9
|
79,9
|
80,4
|
|
2006.
|
80,9
|
81,5
|
81,7
|
82,0
|
82,4
|
82,1
|
81,1
|
81,0
|
81,2
|
81,3
|
81,9
|
81,9
|
|
2007.
|
82,1
|
82,3
|
82,9
|
83,7
|
84,1
|
83,5
|
82,6
|
83,1
|
84,6
|
85,1
|
86,1
|
87,4
|
|
2008.
|
87,9
|
87,6
|
88,2
|
88,9
|
90,0
|
90,6
|
90,4
|
90,0
|
90,5
|
90,5
|
90,3
|
89,6
|
|
2009.
|
90,4
|
91,1
|
91,3
|
92,2
|
92,2
|
92,0
|
90,9
|
90,7
|
90,7
|
91,0
|
91,4
|
90,7
|
|
2010.
|
91,2
|
91,4
|
91,9
|
92,6
|
92,7
|
92,3
|
91,5
|
91,3
|
92,1
|
92,4
|
92,7
|
92,8
|
|
2011.
|
93,4
|
93,9
|
94,9
|
95,1
|
95,6
|
94,8
|
94,0
|
93,9
|
94,9
|
95,7
|
95,9
|
95,5
|
|
2012.
|
95,1
|
95,8
|
97,3
|
98,3
|
100,2
|
99,3
|
98,0
|
98,6
|
100,5
|
101,0
|
100,8
|
100,8
|
|
2013.
|
100,8
|
101,1
|
101,6
|
102,0
|
102,1
|
101,8
|
100,9
|
101,1
|
101,9
|
101,4
|
101,3
|
101,0
|
|
2014.
|
100,9
|
100,5
|
101,1
|
101,5
|
101,7
|
101,1
|
100,5
|
100,2
|
101,1
|
101,3
|
100,9
|
99,8
|
|
2015.
|
99,1
|
99,5
|
100,8
|
100,9
|
101,3
|
100,8
|
99,7
|
99,4
|
99,7
|
100,0
|
99,8
|
99,0
|
|
2016.
|
98,0
|
97,6
|
98,5
|
98,6
|
99,0
|
98,8
|
97,6
|
97,3
|
98,9
|
99,5
|
99,6
|
99,3
|
|
2017.
|
99,2
|
99,5
|
100,0
|
100,6
|
100,4
|
99,4
|
98,4
|
98,4
|
100,4
|
101,1
|
101,1
|
100,6
|
|
2018.
|
100,3
|
100,2
|
101,1
|
102,0
|
102,5
|
102,2
|
100,7
|
100,6
|
101,8
|
102,8
|
102,5
|
101,4
|
|
2019.
|
100,1
|
100,5
|
101,9
|
102,5
|
103,3
|
102,7
|
101,8
|
101,3
|
102,5
|
103,1
|
103,0
|
102,7
|
|
2020.
|
102,3
|
101,8
|
102,2
|
101,6
|
101,8
|
101,8
|
100,8
|
100,6
|
101,9
|
102,4
|
102,0
|
101,2
|
|
2021.
|
101,3
|
101,6
|
103,2
|
104,0
|
104,1
|
104,0
|
|
|
|
|
|
|
|
|
|
|
|
|
|
|
|
|
|
|
|
|
|
|
|
|
|
|
|
Usluge1)
|
|
|
|
|
|
|
|
|
|
|
|
|
|
Services1)
|
|
|
|
|
|
|
|
|
|
|
|
|
|
|
|
|
|
|
|
|
|
1998.
|
54,9
|
55,5
|
56,5
|
57,0
|
59,2
|
60,0
|
60,1
|
60,1
|
60,2
|
60,4
|
60,6
|
60,6
|
|
1999.
|
61,4
|
61,4
|
61,4
|
61,5
|
64,0
|
64,5
|
64,8
|
64,8
|
64,7
|
64,9
|
64,6
|
64,6
|
|
2000.
|
65,1
|
65,3
|
65,3
|
65,8
|
66,5
|
66,6
|
67,6
|
67,8
|
67,7
|
67,7
|
68,1
|
68,2
|
|
2001.
|
68,3
|
68,4
|
68,0
|
69,1
|
69,1
|
69,4
|
69,6
|
72,4
|
72,4
|
72,5
|
72,5
|
72,8
|
|
2002.
|
73,9
|
74,2
|
74,5
|
74,7
|
75,3
|
76,1
|
76,3
|
75,9
|
76,1
|
76,1
|
76,5
|
76,2
|
|
2003.
|
76,3
|
76,5
|
76,7
|
76,7
|
77,1
|
77,5
|
79,0
|
79,0
|
77,6
|
77,4
|
77,5
|
77,8
|
|
2004.
|
78,1
|
78,5
|
78,7
|
78,7
|
79,9
|
80,4
|
81,3
|
81,5
|
80,9
|
80,4
|
80,5
|
80,6
|
|
2005.
|
80,8
|
81,1
|
81,2
|
81,4
|
81,8
|
82,2
|
83,1
|
83,2
|
82,3
|
82,9
|
83,5
|
83,9
|
|
2006.
|
84,7
|
85,4
|
85,4
|
85,3
|
85,7
|
86,3
|
87,0
|
87,4
|
86,8
|
86,5
|
86,6
|
86,7
|
|
2007.
|
87,3
|
87,7
|
87,9
|
87,8
|
88,2
|
88,8
|
89,7
|
90,3
|
89,2
|
88,8
|
88,9
|
89,1
|
|
2008.
|
89,9
|
90,3
|
90,6
|
90,9
|
91,4
|
92,6
|
93,7
|
94,1
|
93,0
|
92,4
|
92,6
|
92,8
|
|
2009.
|
94,9
|
95,2
|
95,1
|
94,9
|
95,2
|
96,2
|
97,4
|
97,8
|
96,5
|
96,2
|
96,3
|
96,5
|
|
2010.
|
96,8
|
97,0
|
96,9
|
96,4
|
96,9
|
98,0
|
99,3
|
99,5
|
97,5
|
97,0
|
96,9
|
96,8
|
|
2011.
|
96,9
|
97,1
|
97,1
|
97,2
|
97,0
|
97,7
|
98,6
|
98,2
|
96,6
|
96,3
|
96,2
|
95,8
|
|
2012.
|
95,7
|
95,8
|
96,9
|
97,1
|
97,7
|
98,2
|
98,6
|
98,7
|
98,1
|
98,4
|
98,0
|
97,7
|
|
2013.
|
98,3
|
98,4
|
98,4
|
98,6
|
98,2
|
98,4
|
98,7
|
98,4
|
98,3
|
98,2
|
98,1
|
98,1
|
|
2014.
|
98,3
|
98,2
|
98,2
|
98,3
|
98,5
|
98,9
|
99,3
|
100,0
|
100,0
|
100,0
|
99,8
|
99,9
|
|
2015.
|
99,8
|
99,8
|
99,7
|
99,7
|
99,7
|
99,9
|
100,3
|
100,4
|
100,9
|
100,1
|
99,8
|
99,9
|
|
2016.
|
99,9
|
99,8
|
99,7
|
99,9
|
99,5
|
99,9
|
100,3
|
100,4
|
99,9
|
99,7
|
99,6
|
99,8
|
|
2017.
|
99,7
|
99,7
|
99,7
|
99,6
|
99,7
|
100,7
|
100,8
|
101,0
|
100,8
|
100,6
|
100,6
|
100,7
|
|
2018.
|
100,7
|
100,7
|
100,7
|
100,9
|
101,0
|
101,7
|
102,3
|
102,4
|
102,2
|
101,8
|
101,6
|
101,9
|
|
2019.
|
101,9
|
101,8
|
101,9
|
102,2
|
102,3
|
103,0
|
103,6
|
103,7
|
103,4
|
103,4
|
103,3
|
103,4
|
|
2020.
|
103,7
|
103,7
|
103,6
|
104,1
|
104,1
|
104,6
|
105,3
|
105,2
|
104,9
|
105,0
|
105,2
|
105,2
|
|
2021.
|
105,3
|
105,5
|
105,4
|
105,6
|
105,9
|
106,2
|
|
|
|
|
|
|
1) Vidi
Metodološka objašnjenja.
1) See
Notes on Methodology.
4. INDEKSI
POTROŠAČKIH CIJENA, UKUPNO
CONSUMER
PRICE INDICES, TOTAL
|
|
I.
|
II.
|
III.
|
IV.
|
V.
|
VI.
|
VII.
|
VIII.
|
IX.
|
X.
|
XI.
|
XII.
|
|
|
|
|
|
|
|
|
|
|
|
|
|
|
|
|
|
|
|
Mjesečni
indeksi (prethodni mjesec = 100)
Monthly
indices (previous month = 100)
|
|
|
|
|
|
|
|
|
|
|
|
|
|
|
|
|
|
|
|
2000.
|
100,9
|
100,5
|
100,5
|
100,5
|
100,4
|
101,0
|
100,6
|
99,8
|
100,4
|
100,2
|
100,2
|
100,4
|
|
2001.
|
100,2
|
100,5
|
99,8
|
101,4
|
100,9
|
99,8
|
99,0
|
100,7
|
100,2
|
99,5
|
99,9
|
100,4
|
|
2002.
|
101,0
|
99,9
|
100,0
|
100,3
|
100,5
|
99,4
|
99,7
|
99,9
|
100,4
|
100,2
|
100,2
|
100,4
|
|
2003.
|
100,5
|
100,2
|
100,5
|
99,7
|
100,3
|
99,6
|
100,1
|
100,1
|
100,2
|
100,0
|
100,2
|
100,3
|
|
2004.
|
101,0
|
99,9
|
100,1
|
100,2
|
100,7
|
99,7
|
99,6
|
100,1
|
99,8
|
100,4
|
100,5
|
100,7
|
|
2005.
|
100,3
|
101,1
|
100,7
|
99,8
|
100,0
|
99,9
|
99,8
|
100,1
|
100,5
|
100,7
|
100,2
|
100,5
|
|
2006.
|
100,6
|
100,8
|
100,1
|
100,2
|
100,5
|
99,9
|
99,2
|
100,1
|
100,0
|
100,0
|
100,6
|
100,0
|
|
2007.
|
100,3
|
100,3
|
100,6
|
100,7
|
100,5
|
99,6
|
99,4
|
100,6
|
101,2
|
100,3
|
101,0
|
101,2
|
|
2008.
|
100,7
|
99,9
|
100,6
|
100,7
|
101,1
|
100,7
|
100,1
|
99,7
|
100,2
|
99,9
|
99,9
|
99,4
|
|
2009.
|
101,2
|
100,6
|
100,2
|
100,8
|
100,0
|
100,1
|
99,3
|
99,9
|
99,8
|
100,1
|
100,4
|
99,4
|
|
2010.
|
100,5
|
100,2
|
100,4
|
100,4
|
100,2
|
99,9
|
99,6
|
99,8
|
100,3
|
100,1
|
100,3
|
100,0
|
|
2011.
|
100,6
|
100,5
|
100,8
|
100,2
|
100,3
|
99,5
|
99,5
|
99,9
|
100,4
|
100,6
|
100,2
|
99,6
|
|
2012.
|
99,6
|
100,6
|
101,5
|
100,8
|
101,7
|
99,4
|
99,0
|
100,5
|
101,4
|
100,4
|
99,8
|
99,9
|
|
2013.
|
100,1
|
100,3
|
100,3
|
100,4
|
100,0
|
99,8
|
99,4
|
100,1
|
100,6
|
99,6
|
99,9
|
99,8
|
|
2014.
|
99,9
|
99,7
|
100,5
|
100,3
|
100,2
|
99,7
|
99,6
|
99,9
|
100,7
|
100,1
|
99,7
|
99,1
|
|
2015.
|
99,5
|
100,2
|
101,0
|
100,1
|
100,4
|
99,7
|
99,2
|
99,8
|
100,4
|
100,1
|
99,7
|
99,4
|
|
2016.
|
99,3
|
99,7
|
100,7
|
100,1
|
100,2
|
99,9
|
99,3
|
99,8
|
101,1
|
100,4
|
100,0
|
99,8
|
|
2017.
|
99,9
|
100,2
|
100,3
|
100,5
|
99,8
|
99,5
|
99,3
|
100,0
|
101,5
|
100,4
|
100,0
|
99,7
|
|
2018.
|
99,8
|
99,9
|
100,6
|
100,7
|
100,4
|
100,0
|
99,1
|
100,0
|
100,8
|
100,6
|
99,7
|
99,2
|
|
2019.
|
99,1
|
100,2
|
101,0
|
100,6
|
100,6
|
99,7
|
99,5
|
99,7
|
100,8
|
100,4
|
99,9
|
99,9
|
|
2020.
|
99,7
|
99,7
|
100,2
|
99,8
|
100,1
|
100,1
|
99,5
|
99,9
|
100,8
|
100,4
|
99,7
|
99,4
|
|
2021.
|
100,1
|
100,3
|
101,1
|
100,7
|
100,1
|
100,0
|
|
|
|
|
|
|
|
|
|
|
|
|
|
|
|
|
|
|
|
|
|
Godišnji
indeksi (isti mjesec prethodne godine = 100)
Annual
indices (same month of previous year = 100)
|
|
|
|
|
|
|
|
|
|
|
|
|
|
|
|
|
|
|
|
2000.
|
103,7
|
103,8
|
104,0
|
104,3
|
103,5
|
104,7
|
104,8
|
104,9
|
105,2
|
105,2
|
105,8
|
105,5
|
|
2001.
|
104,8
|
104,8
|
104,1
|
105,0
|
105,5
|
104,3
|
102,6
|
103,5
|
103,3
|
102,6
|
102,3
|
102,4
|
|
2002.
|
103,2
|
102,5
|
102,7
|
101,6
|
101,2
|
100,8
|
101,5
|
100,7
|
100,9
|
101,6
|
101,8
|
101,8
|
|
2003.
|
101,4
|
101,7
|
102,2
|
101,6
|
101,4
|
101,5
|
102,0
|
102,2
|
101,9
|
101,8
|
101,8
|
101,7
|
|
2004.
|
102,1
|
101,8
|
101,4
|
101,9
|
102,4
|
102,5
|
101,9
|
102,0
|
101,6
|
102,0
|
102,3
|
102,7
|
|
2005.
|
102,0
|
103,3
|
103,9
|
103,5
|
102,8
|
102,9
|
103,1
|
103,1
|
103,8
|
104,1
|
103,8
|
103,6
|
|
2006.
|
103,9
|
103,6
|
103,0
|
103,5
|
104,0
|
104,0
|
103,4
|
103,4
|
102,8
|
102,1
|
102,5
|
102,0
|
|
2007.
|
101,8
|
101,2
|
101,8
|
102,3
|
102,2
|
101,9
|
102,1
|
102,6
|
103,9
|
104,3
|
104,6
|
105,8
|
|
2008.
|
106,2
|
105,8
|
105,7
|
105,7
|
106,4
|
107,6
|
108,4
|
107,4
|
106,4
|
105,9
|
104,7
|
102,9
|
|
2009.
|
103,4
|
104,2
|
103,8
|
103,9
|
102,7
|
102,1
|
101,2
|
101,5
|
101,0
|
101,3
|
101,8
|
101,9
|
|
2010.
|
101,1
|
100,7
|
100,9
|
100,6
|
100,8
|
100,7
|
101,0
|
100,9
|
101,4
|
101,4
|
101,2
|
101,8
|
|
2011.
|
101,9
|
102,2
|
102,6
|
102,4
|
102,5
|
102,0
|
101,9
|
102,0
|
102,2
|
102,6
|
102,6
|
102,1
|
|
2012.
|
101,2
|
101,3
|
102,0
|
102,6
|
103,9
|
103,8
|
103,4
|
104,0
|
105,0
|
104,8
|
104,4
|
104,7
|
|
2013.
|
105,2
|
104,9
|
103,7
|
103,3
|
101,6
|
102,0
|
102,3
|
101,9
|
101,1
|
100,2
|
100,4
|
100,3
|
|
2014.
|
100,1
|
99,4
|
99,6
|
99,5
|
99,8
|
99,6
|
99,9
|
99,7
|
99,8
|
100,4
|
100,2
|
99,5
|
|
2015.
|
99,1
|
99,6
|
100,1
|
99,9
|
100,0
|
100,0
|
99,6
|
99,4
|
99,2
|
99,1
|
99,1
|
99,4
|
|
2016.
|
99,2
|
98,6
|
98,3
|
98,3
|
98,2
|
98,4
|
98,5
|
98,5
|
99,1
|
99,5
|
99,8
|
100,2
|
|
2017.
|
100,9
|
101,4
|
101,1
|
101,4
|
101,1
|
100,7
|
100,8
|
101,0
|
101,4
|
101,4
|
101,4
|
101,2
|
|
2018.
|
101,1
|
100,8
|
101,1
|
101,3
|
101,9
|
102,4
|
102,1
|
102,1
|
101,4
|
101,6
|
101,3
|
100,8
|
|
2019.
|
100,2
|
100,5
|
100,9
|
100,7
|
100,9
|
100,6
|
101,1
|
100,8
|
100,8
|
100,6
|
100,7
|
101,4
|
|
2020.
|
102,0
|
101,5
|
100,6
|
99,8
|
99,4
|
99,8
|
99,7
|
99,9
|
100,0
|
99,9
|
99,8
|
99,3
|
|
2021.
|
99,7
|
100,3
|
101,2
|
102,1
|
102,1
|
102,0
|
|
|
|
|
|
|
|
|
|
|
|
|
|
|
|
|
|
|
|
|
|
|
|
|
|
Dvanaestomjesečni
prosjek
Twelve-month
average
|
|
|
|
|
|
|
|
|
|
|
|
|
|
|
|
|
|
|
|
2000.
|
104,0
|
104,0
|
104,0
|
104,0
|
104,0
|
104,1
|
104,1
|
104,2
|
104,2
|
104,3
|
104,5
|
104,6
|
|
2001.
|
104,7
|
104,8
|
104,8
|
104,9
|
105,0
|
105,0
|
104,8
|
104,7
|
104,5
|
104,3
|
104,0
|
103,8
|
|
2002.
|
103,6
|
103,4
|
103,3
|
103,0
|
102,7
|
102,4
|
102,3
|
102,1
|
101,9
|
101,8
|
101,7
|
101,7
|
|
2003.
|
101,5
|
101,5
|
101,4
|
101,4
|
101,4
|
101,5
|
101,6
|
101,7
|
101,8
|
101,8
|
101,8
|
101,8
|
|
2004.
|
101,8
|
101,8
|
101,8
|
101,8
|
101,9
|
102,0
|
102,0
|
101,9
|
101,9
|
101,9
|
102,0
|
102,1
|
|
2005.
|
102,0
|
102,2
|
102,4
|
102,5
|
102,5
|
102,6
|
102,7
|
102,8
|
102,9
|
103,1
|
103,2
|
103,3
|
|
2006.
|
103,5
|
103,5
|
103,4
|
103,4
|
103,5
|
103,6
|
103,7
|
103,7
|
103,6
|
103,4
|
103,3
|
103,2
|
|
2007.
|
103,0
|
102,8
|
102,7
|
102,6
|
102,5
|
102,3
|
102,2
|
102,1
|
102,2
|
102,4
|
102,6
|
102,9
|
|
2008.
|
103,3
|
103,6
|
104,0
|
104,3
|
104,6
|
105,1
|
105,6
|
106,0
|
106,2
|
106,3
|
106,3
|
106,1
|
|
2009.
|
105,8
|
105,7
|
105,5
|
105,4
|
105,1
|
104,6
|
104,0
|
103,5
|
103,1
|
102,7
|
102,5
|
102,4
|
|
2010.
|
102,2
|
101,9
|
101,7
|
101,4
|
101,2
|
101,1
|
101,1
|
101,1
|
101,1
|
101,1
|
101,1
|
101,1
|
|
2011.
|
101,1
|
101,2
|
101,4
|
101,5
|
101,7
|
101,8
|
101,9
|
102,0
|
102,0
|
102,1
|
102,2
|
102,3
|
|
2012.
|
102,2
|
102,1
|
102,1
|
102,1
|
102,2
|
102,4
|
102,5
|
102,6
|
102,9
|
103,1
|
103,2
|
103,4
|
|
2013.
|
103,8
|
104,1
|
104,2
|
104,3
|
104,0
|
103,9
|
103,8
|
103,6
|
103,3
|
102,9
|
102,6
|
102,2
|
|
2014.
|
101,8
|
101,3
|
101,0
|
100,7
|
100,5
|
100,4
|
100,2
|
100,0
|
99,9
|
99,9
|
99,9
|
99,8
|
|
2015.
|
99,7
|
99,7
|
99,8
|
99,8
|
99,8
|
99,8
|
99,8
|
99,8
|
99,7
|
99,6
|
99,5
|
99,5
|
|
2016.
|
99,5
|
99,5
|
99,3
|
99,2
|
99,0
|
98,9
|
98,8
|
98,7
|
98,7
|
98,8
|
98,8
|
98,9
|
|
2017.
|
99,0
|
99,2
|
99,5
|
99,7
|
100,0
|
100,2
|
100,4
|
100,6
|
100,8
|
100,9
|
101,1
|
101,1
|
|
2018.
|
101,2
|
101,1
|
101,1
|
101,1
|
101,2
|
101,3
|
101,4
|
101,5
|
101,5
|
101,5
|
101,5
|
101,5
|
|
2019.
|
101,4
|
101,4
|
101,4
|
101,3
|
101,2
|
101,1
|
101,0
|
100,9
|
100,9
|
100,8
|
100,7
|
100,8
|
|
2020.
|
100,9
|
101,0
|
101,0
|
100,9
|
100,8
|
100,7
|
100,6
|
100,5
|
100,4
|
100,4
|
100,3
|
100,1
|
|
2021.
|
99,9
|
99,9
|
99,9
|
100,1
|
100,3
|
100,5
|
|
|
|
|
|
|
|
5. PROSJEČNI GODIŠNJI INDEKSI POTROŠAČKIH
CIJENA, UKUPNO
ANNUAL
AVERAGE CONSUMER PRICE INDICES, TOTAL
|
|
Prethodna godina = 100
Previous year = 100
|
2015. = 100
|
|
|
|
|
|
1998.
|
-
|
64,9
|
|
1999.
|
104,0
|
67,5
|
|
2000.
|
104,6
|
70,6
|
|
2001.
|
103,8
|
73,3
|
|
2002.
|
101,7
|
74,5
|
|
2003.
|
101,8
|
75,8
|
|
2004.
|
102,1
|
77,4
|
|
2005.
|
103,3
|
79,9
|
|
2006.
|
103,2
|
82,5
|
|
2007.
|
102,9
|
84,9
|
|
2008.
|
106,1
|
90,0
|
|
2009.
|
102,4
|
92,2
|
|
2010.
|
101,1
|
93,1
|
|
2011.
|
102,3
|
95,2
|
|
2012.
|
103,4
|
98,5
|
|
2013.
|
102,2
|
100,7
|
|
2014.
|
99,8
|
100,5
|
|
2015.
|
99,5
|
100,0
|
|
2016.
|
98,9
|
98,9
|
|
2017.
|
101,1
|
100,0
|
|
2018.
|
101,5
|
101,5
|
|
2019.
|
100,8
|
102,3
|
|
2020.
|
100,1
|
102,4
|
|
|
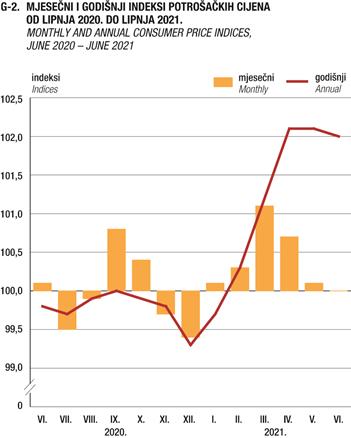
|
6. HARMONIZIRANI
INDEKSI POTROŠAČKIH CIJENA U LIPNJU 2021., STOPE PROMJENE
HARMONISED
INDICES OF CONSUMER PRICES, JUNE 2021,
RATES OF CHANGE
|
|
Struktura
Structure (%)
|
VI. 2021.1)
Ø 2015.
|
VI. 2021.
VI. 2020.
|
VI. 2021.
V. 2021.
|
VII. 2020. − VI. 2021.
VII. 2019. −
VI. 2020.
|
|
|
|
|
|
|
|
|
|
|
|
|
00
|
Harmonizirani indeks potrošačkih cijena – ukupno
|
100,00
|
105,40
|
2,2
|
0,4
|
0,6
|
00
|
Harmonised index of consumer prices – total
|
|
|
|
|
|
|
|
|
|
|
|
01
|
Hrana i
bezalkoholna pića
|
22,14
|
105,99
|
0,0
|
0,1
|
0,4
|
01
|
Food and
non-alcoholic beverages
|
|
02
|
Alkoholna
pića i duhan
|
7,23
|
117,92
|
4,6
|
0,0
|
4,7
|
02
|
Alcoholic
beverages and tobacco
|
|
03
|
Odjeća i
obuća
|
4,33
|
98,19
|
0,6
|
-4,8
|
-0,4
|
03
|
Clothing
and footwear
|
|
04
|
Stanovanje,
voda, električna energija, plin i ostala goriva
|
13,32
|
101,06
|
4,3
|
0,6
|
-1,0
|
04
|
Housing, water,
electricity, gas and other fuels
|
|
05
|
Pokućstvo,
oprema za kuću i redovito održavanje kućanstva
|
5,69
|
101,69
|
-0,5
|
0,1
|
-0,4
|
05
|
Furnishings,
household equipment and routine household maintenance
|
|
06
|
Zdravlje
|
5,49
|
108,74
|
1,2
|
0,0
|
1,2
|
06
|
Health
|
|
07
|
Prijevoz
|
10,94
|
104,45
|
8,1
|
0,9
|
0,6
|
07
|
Transport
|
|
08
|
Komunikacija
|
5,39
|
97,97
|
1,7
|
0,0
|
1,4
|
08
|
Communication
|
|
09
|
Rekreacija
i kultura
|
8,30
|
103,10
|
1,3
|
0,4
|
1,3
|
09
|
Recreation
and culture
|
|
10
|
Obrazovanje
|
1,33
|
101,86
|
0,8
|
0,1
|
-0,1
|
10
|
Education
|
|
11
|
Restorani
i hoteli
|
8,72
|
111,25
|
2,3
|
4,2
|
-0,3
|
11
|
Restaurants
and hotels
|
|
12
|
Razna
dobra i usluge
|
7,12
|
104,33
|
-0,6
|
-0,3
|
1,3
|
12
|
Miscellaneous
goods and services
|
1) Indeksi
(prema Uredbi Komisije (EU) br. 2015/2010 od 11. studenoga 2015. zajedničko
referentno razdoblje indeksa za HICP jest 2015. = 100)
1) Indices
(according to the Commission Regulation (EU) No. 2015/2010 of 11
November 2015, common index reference period for the HICP is 2015 = 100).
7. HARMONIZIRANI INDEKSI
POTROŠAČKIH CIJENA U EU U SVIBNJU 2021.1)
HARMONISED
INDICES OF CONSUMER PRICES IN EU, MAY 20211)
|
|
|
godišnje stope
Annual rates
|
|
(nastavak)
(continued)
|
|
godišnje stope
Annual rates
|
|
|
V. 2021.
V. 2020.
|
|
|
|
V. 2021.
V. 2020.
|
|
|
|
|
|
|
|
|
|
|
Područje eura2)
|
2,0
|
Euro area2)
|
|
|
|
|
|
EU-27
|
2,3
|
EU-27
|
|
|
|
|
|
Austrija
|
3,0
|
Austria
|
|
Litva
|
3,5
|
Lithuania
|
|
Belgija
|
2,5
|
Belgium
|
|
Luksemburg
|
4,0
|
Luxembourg
|
|
Bugarska
|
2,3
|
Bulgaria
|
|
Mađarska
|
5,3
|
Hungary
|
|
Cipar
|
1,5
|
Cyprus
|
|
Malta
|
0,2
|
Malta
|
|
Češka
|
2,7
|
Czech Republic
|
|
Nizozemska
|
2,0
|
Netherlands
|
|
Danska
|
1,9
|
Denmark
|
|
Njemačka
|
2,4
|
Germany
|
|
Estonija
|
3,2
|
Estonia
|
|
Poljska
|
4,6
|
Poland
|
|
Finska
|
2,3
|
Finland
|
|
Portugal
|
0,5
|
Portugal
|
|
Francuska
|
1,8
|
France
|
|
Rumunjska
|
3,2
|
Romania
|
|
Grčka
|
-1,2
|
Greece
|
|
Slovačka
|
2,0
|
Slovakia
|
|
Hrvatska
|
2,4
|
Croatia
|
|
Slovenija
|
2,2
|
Slovenia
|
|
Irska
|
1,9
|
Ireland
|
|
Španjolska
|
2,4
|
Spain
|
|
Italija
|
1,2
|
Italy
|
|
Švedska
|
2,4
|
Sweden
|
|
Letonija
|
2,6
|
Latvia
|
|
|
|
|
1) Izvor: Eurostat, europokazatelji,
Priopćenje za svibanj 2021., br. 71/2021. od 17. lipnja 2021.
2) Područje eura: Austrija, Belgija,
Cipar, Estonija, Finska, Francuska, Grčka, Irska, Italija, Letonija, Litva,
Luksemburg, Malta, Nizozemska, Njemačka, Portugal, Slovačka, Slovenija i
Španjolska
1) Source: Eurostat, Euro-indicators,
News Release for May 2021, No. 71/2021 of 17 June 2021.
2) Euro area: Austria, Belgium, Cyprus,
Estonia, Finland, France, Greece, Ireland, Italy, Latvia, Lithuania,
Luxembourg, Malta, the Netherlands, Germany, Portugal, Slovakia, Slovenia and
Spain.
|
METODOLOŠKA
OBJAŠNJENJA
|
|
NOTES
ON METHODOLOGY
|
|
|
|
|
|
|
|
|
|
Indeks
potrošačkih cijena
|
|
Consumer
price index
|
|
|
|
|
|
|
|
|
|
Definicija
|
|
Definition
|
|
|
|
|
|
Indeks
potrošačkih cijena odražava promjene u razini cijena dobara i usluga koje u
tijeku vremena nabavlja, koristi se njima ili ih plaća referentno
stanovništvo (privatna kućanstva) radi potrošnje.
|
|
The
consumer price index (CPI) measures changes in the prices of goods and
services acquired, used or paid over time by the reference population
(private households) for consumption purposes.
|
|
|
|
|
|
|
|
|
|
Namjena
|
|
Purpose
|
|
|
|
|
|
Indeks
potrošačkih cijena može imati različite namjene i služiti za mjerenje
inflacije, očuvanje vrijednosti kod ugovora s indeksnim klauzulama (npr. za
indeksiranje plaća u kolektivnim ugovorima, indeksiranje mirovina i
slično), usporedbu kretanja cijena unutar zemlje između određenih
gospodarskih sektora, kao osnova za deflacioniranje pojedinih kategorija
nacionalnih računa i drugih statističkih serija te se primjenjuje za
analitičke svrhe.
|
|
The
CPI can be used for various purposes. It can be used as a measure of
inflation, it can serve to guarantee the value of recurrent payments in
escalator clauses for contractual relationships (for example, the CPI can
serve for indexing wages and salaries in collective agreements, for
indexing pensions etc.), as well as a comparison of the price movements
within a particular country between different economy sectors, it can serve
as a basis for deflating the national accounts data and other statistical
series and can be used for analytical purposes.
|
|
|
|
|
|
|
|
|
|
Obuhvat
|
|
Scope
|
|
|
|
|
|
Indeks
potrošačkih cijena u Republici Hrvatskoj izračunava se na temelju
reprezentativne košarice koju čini oko 890 proizvoda. Svakog mjeseca
prikuplja se oko 38 000 cijena na unaprijed definiranu uzorku prodajnih
mjesta na devet geografskih lokacija.
|
|
The
CPI in the Republic of Croatia is calculated on the basis of a
representative basket consisting of about 890 different items. About 38 000 prices
are collected each month in a fixed panel of outlets in nine geographical
locations.
|
|
|
|
|
|
Obuhvat
stanovništva. Obuhvaćena su ukupna privatna kućanstva na domaćem
teritoriju bez obzira na tip naselja u kojem se nalaze, njihovu poziciju u
raspodjeli dohotka te njihova etnička i demografska obilježja.
|
|
Population
coverage. All private households in the country,
regardless of type of settlements, position in income distribution or their
ethnic and demographic characteristics are covered.
|
|
|
|
|
|
Geografski
obuhvat. Ponderi obuhvaćaju cijeli teritorij Republike
Hrvatske. Cijene se prikupljaju na devet lokacija (gradova) u zemlji
(Zagreb, Slavonski Brod, Osijek, Sisak, Rijeka, Pula, Split, Dubrovnik i
Varaždin) odabranih prema kriteriju broja stanovnika i reprezentativnosti
za pojedinu jedinicu prema NKPJS-u – 2. razina.
|
|
Geographic
coverage. The weight structure covers the whole
territory of the Republic of Croatia. The pricing takes place in nine
locations (cities and towns) throughout the country (Zagreb, Slavonski
Brod, Osijek, Sisak, Rijeka, Pula, Split, Dubrovnik and Varaždin), sampled
on the basis of the size of the population and representativeness at NUTS 2
level.
|
|
|
|
|
Obuhvat
proizvoda.
Obuhvaćena su sva dobra i usluge koje kupuje referentno stanovništvo radi
finalne potrošnje. Nisu obuhvaćeni imputirana stambena renta, izdaci za
igre na sreću i usluge životnog osiguranja. Obuhvat dobara i usluga
redovito se revidira kako bi se očuvala reprezentativnost košarice
proizvoda s obzirom na ukuse potrošača i njihove navike u smislu kupnje.
Proizvodi se obvezatno uključuju u izračunavanje indeksa potrošačkih cijena
ako je njihov udio u ukupnim izdacima referentnog stanovništva veći od
1/1000.
|
|
Product
coverage. All goods and services bought by the
reference population for the purpose of final consumption are included in
the index. Imputed rents, expenditures on lotteries and gambling as well as
life insurance are not included. The coverage of goods and services is
regularly revised in order to ensure the representativeness of the basket
with respect to consumer tastes and purchasing practices. Products have to
be included in the calculation of the index once their expenditure share
exceeds 1/1000 of the total expenditures of the reference population.
|
|
|
|
|
|
|
|
|
|
Snimanje
cijena
|
|
Price
collection
|
|
|
|
|
|
Većina
cijena prikuplja se lokalno, a centralno se prikupljaju nacionalno homogene
cijene. Za proizvode čije se cijene snimaju lokalno, snimatelji dobivaju
labave specifikacije i u početku samostalno izabiru konkretan proizvod čiju
će cijenu snimiti na prodajnome mjestu. Kako bi se osiguralo da snimatelji
iz mjeseca u mjesec snimaju cijene istih proizvoda te kako bi se moglo
pratiti koje proizvode izabiru na terenu, snimatelji bilježe i unaprijed
definiran skup dodatnih obilježja proizvoda. Takav način snimanja omogućuje
praćenje promjene kretanja cijena između dvaju razdoblja, ali ne i
usporedbu prosječnih cijena između različitih geografskih lokacija.
|
|
Most
of the prices are collected locally, while the central price collection is
applied to nationally homogeneous prices. For products for which prices are
collected locally, the price collectors receive loose specifications and
they are free to initially select a particular product for pricing in a
particular outlet. In order to make sure that the same products are then
re-priced each month, as well as to monitor which products are selected for
pricing, the price collectors also record a pre-defined set of additional
product characteristics. Such a method of price collection enables the
monitoring of price change between two periods, but not the comparison of
average prices between different geographic locations.
|
|
|
|
|
|
Za
potrebe indeksa potrošačkih cijena većina cijena snima se jedanput na
mjesec, radnim danom (cijene se ne snimaju vikendima i praznicima), i to
približno istog dana u mjesecu (između 13. i 23. dana u mjesecu). Dva puta
na mjesec snimaju se cijene poljoprivrednih proizvoda koji se prodaju na
tržnicama te cijene u zračnome putničkom prijevozu. Cijene goriva za osobne
automobile, cijene paket-aranžmana, cijene najma apartmana te cijene
smještaja u kampovima snimaju se tjedno. Cijene tržišnih najamnina snimaju
se tromjesečno, a cijene školskih knjiga i naknada za obrazovanje jedanput
na godinu.
|
|
For
the purpose of the CPI, most prices are recorded monthly, on working days
(prices are not recorded during weekends and public holidays) on
approximately the same day of the month (between 13th and 23rd
day of the reference month). Prices of agricultural products sold in market
places and prices of passenger air transport are recorded twice a month.
Prices of fuel for passenger cars, prices of package holidays, prices of
apartment rents and prices of accommodations in camps are recorded weekly.
Prices of market rents are recorded quarterly, while prices of education
fees and prices of school books are recorded once a year.
|
|
|
|
|
|
|
|
|
|
Ponderi
|
|
Weights
|
|
|
|
|
|
Ponderi
koji se primjenjuju za izračunavanje indeksa potrošačkih cijena odražavaju
relativnu važnost odabranih dobara i usluga u ukupnoj potrošnji rezidentnih
kućanstava na domaćem teritoriju.
|
|
The
weights used for calculating the CPI reflect the relative importance of the
sampled goods or services in the total consumption of resident households
within the domestic territory.
|
|
|
|
|
|
Osnovni
izvor podataka za izradu pondera za izračun indeksa potrošačkih cijena jest
Anketa o potrošnji kućanstava, koju Državni zavod za statistiku redovito
provodi od 1998. Taj izvor podataka nadopunjen je raspoloživim
administrativnim podacima. Za izračunavanje indeksa potrošačkih cijena od
siječnja 2021. primjenjuju se ponderi koji se temelje na potrošnji kućanstava
iz Ankete o potrošnji kućanstava od 2017., preračunani na cijene u prosincu
2020.
|
|
The
most important data source for calculating the weights used in the consumer
price indices is the Household Budget Survey, conducted on a regular basis
by the Croatian Bureau of Statistics since 1998. The data collected by
these surveys are supplemented by available administrative data. Since
January 2021, the compilation of the CPIs has been based on the weights
derived from data on household expenditures from the 2017 Household Budget
Survey recalculated to December 2020 prices.
|
|
|
|
|
|
Pandemija
bolesti COVID-19 u velikoj je mjeri utjecala na osobnu potrošnju kućanstava
i stoga su za izračun pondera u 2021. podaci iz Ankete o potrošnji
kućanstava za 2017. dodatno ažurirani procijenjenim podacima nacionalnih
računa o izdacima za konačnu potrošnju kućanstava za 2020.
|
|
The
COVID-19 pandemic has largely affected household personal consumption and
therefore, for the calculation of weights in 2021, data from the 2017 Household
Budget Survey were further updated with estimated national accounts data on
household final consumption expenditure for 2020.
|
|
|
|
|
|
Istodobno su za izračun pondera za
harmonizirani indeks potrošačkih cijena upotrijebljeni procijenjeni podaci
nacionalnih računa o izdacima za konačnu potrošnju kućanstava za 2020. i
nadopunjeni dodatnim raspoloživim izvorima podataka te preračunani na
razliku između prosjeka 2020. i prosinca 2020. u skladu s Eurostatovim preporukama.
|
|
At
the same time, estimated national accounts data on household final
consumption expenditure for 2020 were used to calculate the weights for the
harmonised consumer price index, supplemented by additional available data
sources and recalculated to the difference between the 2020 average and
December 2020 according to the Eurostat recommendations.
|
|
|
|
|
|
|
|
|
|
Klasifikacija
|
|
Classification
|
|
|
|
|
|
Za
klasificiranje proizvoda iz indeksa potrošačkih cijena upotrebljava se
Europska klasifikacija osobne potrošnje prema namjeni (ECOICOP).
|
|
The
classification of products used in the CPI is based on the European
Classification of Individual Consumption according to Purpose (ECOICOP).
|
|
|
|
|
|
|
|
|
|
Izračun
indeksa
|
|
Calculation
of indices
|
|
|
|
|
|
Izračunavanje
indeksa potrošačkih cijena počinje izračunavanjem indeksa elementarnih
agregata.
|
|
The
calculation of the CPIs begins with the computation of the elementary
aggregate indices.
|
|
|
|
|
|
Indeksi
elementarnih agregata izračunavaju se kao odnos geometrijskih sredina
cijena za svaku geografsku lokaciju. To znači da se cijene proizvoda unutar
elementarnog agregata u tekućemu mjesecu stavljaju u odnos s cijenama
referentnog razdoblja (prosinac prethodne godine).
Iz indeksa elementarnih agregata na razini geografskih lokacija
izračunavaju se indeksi elementarnih agregata na nacionalnoj razini
primjenom formule za vaganu aritmetičku sredinu.
|
|
The
elementary aggregate indices are compiled as a ratio of the geometric means
of prices for each geographical location. It means that prices for
product-offers within elementary aggregates in the current month are
compared to prices of the reference period (December of the
previous year). From elementary indices at the level of geographical
locations, elementary aggregate indices at national level are then
calculated by using the formula for the weighted arithmetic mean.
|
|
|
|
|
|
Indeksi
elementarnih agregata na nacionalnoj razini agregiraju se na više razine
indeksa primjenom formule Laspeyresova tipa.
|
|
Elementary
aggregate indices at national level are aggregated to higher index levels
using the Laspeyres’ type formula.
|
|
|
|
|
|
|
|
|
Sezonski
proizvodi
|
|
Treatment
of seasonal products
|
|
|
|
|
|
Pri
izračunavanju indeksa za sezonske proizvode primjenjuje se Uredba Komisije
(EZ) br. 330/2009 od 22. travnja 2009. (minimalni standardi za sezonske
proizvode).
|
|
In
calculating the index for seasonal products, the Commission Regulation (EC)
No. 330/2009 of 22 April 2009 (minimum standards for seasonal products)
applies.
|
|
|
|
|
|
|
|
|
|
|
|
|
|
Harmonizirani
indeks potrošačkih cijena
|
|
Harmonised
index of consumer prices
|
|
|
|
|
|
|
|
|
|
Definicija
|
|
Definition
|
|
|
|
|
|
Harmonizirani
indeks potrošačkih cijena (HICP) jest ekonomski pokazatelj koji mjeri
promjenu u razini cijena dobara i usluga koje u tijeku vremena nabavljaju,
koriste se njima ili plaćaju kućanstva te kao takav predstavlja skupinu
europskih indeksa potrošačkih cijena izračunanih prema harmoniziranom
pristupu i posebnom setu definicija koji omogućuje usporedivu mjeru
inflacije u području eura, Europskoj uniji, Europskome ekonomskom području
te za zemlje kandidatkinje.
|
|
The
harmonised index of consumer prices (HICP) is an economic indicator that measures
the change in the prices of goods and services acquired, used or paid by
households over time. As such, it represents a group of European consumer
price indices calculated according to the harmonised approach and a
separate set of definitions and provides a comparable measure of inflation
in the euro area, the European Union, the European Economic Area and the
candidate countries.
|
|
|
|
|
|
|
|
|
|
Razlika između
indeksa potrošačkih cijena i harmoniziranog indeksa potrošačkih cijena
|
|
Difference
between the consumer price index and the harmonised index of consumer
prices
|
|
|
|
|
|
Dok
se indeks potrošačkih cijena najčešće primjenjuje kao opća mjera inflacije
u nacionalnim okvirima, harmonizirani indeks potrošačkih cijena usporediva
je mjera inflacije sa zemljama Europske unije.
|
|
While
the consumer price index is mostly used as a general measure of inflation
in the national context, the harmonised index of consumer prices represents
a comparable measure of inflation in the European Union.
|
|
|
|
|
|
HICP
i CPI računaju se na temelju iste reprezentativne košarice dobara i usluga.
Osnovna razlika u odnosu na indeks potrošačkih cijena jest u obuhvatu
stanovništva i izvorima za ponderacijsku strukturu.
|
|
Both
HICP and CPI are calculated on the basis of the same representative basket
of goods and services. The main difference in relation to the consumer
price index is in population coverage and the sources for the weighting
structure.
|
|
|
|
|
|
HICP
obuhvaća ukupnu potrošnju institucionalnih kućanstava i nerezidenata na
ekonomskom teritoriju i ta potrošnja nije uključena u nacionalni indeks
potrošačkih cijena.
|
|
HICP
covers the total consumption of non-residents and institutional households
within the economic territory of a country. This type of consumption is not
included in the national CPI.
|
|
|
|
|
|
Glavni
izvor podataka za izračun ponderacijske strukture HICP-a na višim razinama
agregacije jesu podaci Nacionalnih računa, a za niže razine agregacije
upotrijebljeni su podaci Ankete o potrošnji kućanstava.
|
|
The
main data source for the calculation of the HICP weight structure at higher
aggregation levels are the data obtained from the National Accounts, while
the Household Budget Survey data are used at lower aggregation levels.
|
|
|
|
|
|
Državni
zavod za statistiku izračunava HICP od siječnja 2007. Kao i za nacionalne
indekse potrošačkih cijena izračunana je serija harmoniziranih indeksa
potrošačkih cijena unatrag do siječnja 1998., otkad je u primjeni
klasifikacija COICOP.
|
|
The
Croatian Bureau of Statistics has been calculating HICP since January 2007.
As is true of national consumer price indices, the series of the harmonised
indices of consumer prices was also backcasted to January 1998, when the
COICOP classification had started being used.
|
|
|
|
|
|
Harmonizirani
indeks potrošačkih cijena i metapodaci dostupni su također na Eurostatovim
mrežnim stranicama http://ec.europa.eu/eurostat/.
|
|
The
harmonised index of consumer prices and metadata for the Croatian HICP are
available on the Eurostat web page http://ec.europa.eu/eurostat/.
|
|
|
|
|
|
|
|
|
|
Harmonizirani
indeks potrošačkih cijena po stalnim poreznim stopama
|
|
Harmonised
index of consumer prices at constant
tax rates
|
|
|
|
|
|
HICP-CT
jest harmonizirani indeks potrošačkih cijena, gdje se stope poreza na
proizvode zadržavaju konstantnima u tekućem razdoblju u odnosu na
referentno razdoblje, tj. u tijeku vremena. U slučaju promjene poreznih
stopa razlika između tekućeg HICP-CT-a i HICP-a upućuje na utjecaj promjene
poreznih stopa na promjene cijena uz pretpostavku da su se promjene u
poreznim stopama primijenile trenutačno i potpuno.
|
|
HICP-CT
is the harmonised index of consumer prices where the rates of taxes on
products are kept constant in the observation period compared to the
reference period, i.e. through time. In the event of a tax rate change, the
difference between the current HICP-CT and HICP would indicate the effect
of the tax rate change on price changes assuming tax changes are passed on
instantaneously and fully.
|
|
|
|
|
|
Mjesečni
indeksi, mjesečne stope promjena i godišnje stope promjena HICP-CT-a dostupni
su na Eurostatovim mrežnim stranicama http://ec.europa.eu/eurostat.
|
|
Monthly
indices, monthly rates of change and annual rates of change of the HICP-CT
are available at Eurostat’s web page http://ec.europa.eu/eurostat.
|
|
|
|
|
|
Na
mrežnim stranicama Državnog zavoda za statistiku http://www.dzs.hr dostupni
su podaci za indeks na razini ukupno (Statistika u nizu).
|
|
Data
for total index are available on the web page of the Croatian Bureau of
Statistics http://www.dzs.hr (Statistics in Line).
|
|
|
|
|
|
|
|
|
|
Harmonizirani
indeks potrošačkih cijena po administrativnim cijenama
|
|
Harmonised
index of consumer prices – administered prices
|
|
|
|
|
|
Harmoniziranim
indeksom potrošačkih cijena po administrativnim cijenama (HICP-AP) prati se
kretanje administrativnih cijena (potpuno i djelomično administrativne
cijene).
|
|
The
HICP – administered prices (HICP-AP) provides a summary of the development
of fully administered prices and of mainly administered prices.
|
|
|
|
|
|
Državni
zavod za statistiku provodi godišnje ažuriranje podataka o potpuno i
djelomično administrativnim cijenama na temelju kojih Eurostat mjesečno
izračunava sljedeće posebne agregate indeksa za sve zemlje članice Europske
unije:
|
|
The
Croatian Bureau of Statistics carries out an annual update of fully and
mainly administrative prices on which the Eurostat calculates the following
special index aggregates for all EU member states on a monthly basis:
|
|
|
|
|
|
|
|
|
HICP
po administrativnim cijenama te za potpuno i djelomično administrativne
cijene
|
|
|
HICP
of administered prices, of fully administered prices and of mainly
administered prices
|
|
|
HICP
ukupno bez administrativnih cijena, isključujući potpuno administrativne
cijene i djelomično administrativne cijene.
|
|
|
HICP
all-items excluding administered prices, excluding fully administered
prices and excluding mainly administered prices.
|
|
|
|
|
|
Podaci
za HICP-AP dostupni su na Eurostatovim mrežnim stranicama
http://ec.europa.eu/eurostat/, gdje se također za razdoblje od 2001.
nadalje nalaze i metapodaci po zemljama o podindeksima klasifikacije COICOP
koji su klasificirani kao administrativni.
|
|
The
HICP-AP data are available on the Eurostat web page
http://ec.europa.eu/eurostat/ where, for the period from 2001 onwards,
metadata is also available by countries of the sub-indices of COICOP, which
are classified as administrative.
|
|
|
|
|
|
|
|
|
|
Ostale
definicije
|
|
Other
definitions
|
|
|
|
|
|
Elementarni
agregati jesu proizvodi na najnižoj razini agregacije, odnosno
proizvodi u svim prodajnim mjestima na jednoj geografskoj lokaciji.
Proizvodima iz elementarnog agregata ne može se dodijeliti ponder jer za to
ne postoje odgovarajući podaci.
|
|
Elementary
aggregates are products at the lowest aggregation
level, that is, products in all outlets on one geographical location. The
data required for the estimation of weights are typically not available
within an elementary aggregate.
|
|
|
|
|
|
Proizvodi
su
bilo koja dobra i usluge za potrošnju koja se mogu kupiti; skupni naziv za
dobra i usluge.
|
|
Products
are
all consumer goods or services that can be purchased; the term covers both
goods and services.
|
|
|
|
|
|
Dobra su svi
proizvodi osim usluga.
|
|
Goods are
products excluding services.
|
|
|
|
|
|
Energiju čine
električna energija, plin, tekuća i kruta goriva, toplinska energija,
goriva i maziva.
|
|
Energy
includes electricity, gas, liquid and solid fuels, heat energy, fuels and
lubricants.
|
|
|
|
|
|
Godišnjim
indeksom mjere se promjene cijena u tekućemu mjesecu u odnosu
na isti mjesec prethodne godine. Ta je mjera osjetljiva na posljednje
promjene u razini cijena, ali može biti pod utjecajem jednokratnog učinka u
svakome mjesecu.
|
|
An annual
index measures the price change between the current month and the same
month of the previous year. This measure is responsive to recent changes in
price levels but can be influenced by one-off effects in either month.
|
|
|
|
|
|
Dvanaestomjesečnim
prosječnim indeksom prevladava se taj učinak stavljanjem u
odnos prosjeka posljednjih 12 mjeseci s prosjekom prethodnih 12 mjeseci.
|
|
A twelve-month
average index overcomes this volatility by comparing the average in the
last 12 months to the average of the previous
12 months.
|
|
|
|
|
|
|
|
Kratice
|
|
|
Abbreviations
|
|
|
|
|
|
|
|
COICOP
|
Klasifikacija osobne potrošnje prema namjeni
|
|
COICOP
|
Classification of Individual Consumption by Purpose
|
|
COVID-19
|
bolest prouzročena
koronavirusom
|
|
COVID-19
|
COrona VIrus Disease-19
|
|
d. n.
|
drugdje nespomenuto
|
|
EC
|
European Community
|
|
EU
|
Europska unija
|
|
EU
|
European Union
|
|
Eurostat
|
Statistički ured Europske unije
|
|
Eurostat
|
Statistical Office of the European Communities
|
|
EZ
|
Europska zajednica
|
|
n. e. c.
|
not elsewhere classified
|
|
NKPJS
|
Nacionalna klasifikacija prostornih jedinica za
statistiku
|
|
NUTS
|
common classification of territorial units for
statistics
|
|
|
|
|
|
|
|
|
|
|
|
|
|
Znakovi
|
|
|
Symbols
|
|
|
|
|
|
|
|
|
-
|
nema pojave
|
|
-
|
no occurrence
|
Objavljuje Državni zavod za statistiku
Republike Hrvatske, Zagreb, Ilica 3, p. p. 80.
Published by the Croatian Bureau of
Statistics, Zagreb, Ilica 3, P. O. B. 80
Telefon/ Phone: +385
(0) 1 4806-111, telefaks/ Fax: +385 (0) 1 4817-666
Novinarski upiti/ Press
corner: press@dzs.hr
Odgovorne osobe:
Persons responsible:
Suzana Šamec, načelnica Sektora
makroekonomskih statistika
Suzana Šamec, Director of
Macroeconomic Statistics Directorate
Lidija Brković, glavna ravnateljica
Lidija Brković, Director General
Priredile: Sanja Jurleka, Jasminka
Stančić, Snježana Strukar, Gordana Šiletić i Marija Gudelj
Prepared by: Sanja Jurleka, Jasminka
Stančić, Snježana Strukar, Gordana Šiletić and Marija Gudelj
|
|
MOLIMO KORISNIKE
DA PRI KORIŠTENJU PODATAKA NAVEDU IZVOR.
USERS ARE KINDLY
REQUESTED TO STATE THE SOURCE.
|
|
Služba za odnose s korisnicima i
zaštitu podataka
Customer Relations and Data
Protection Department
|
Informacije i korisnički zahtjevi
Information and user requests
|
|
Pretplata publikacija
Subscription
|
|
|
|
|
|
Telefon/ Phone: +385 (0) 1 4806-138, 4806-154
Elektronička pošta/ E-mail: stat.info@dzs.hr
Telefaks/ Fax: +385 (0) 1 4806-148
|
|
Telefon/ Phone: +385 (0) 1 4806-115
Elektronička pošta/ E-mail: prodaja@dzs.hr
Telefaks/ Fax: +385 (0) 1 4806-148
|
|