| * |
corrected data |
| - |
no occurrence |
| ... |
data not available |
| . |
not zero, but not published due to the extremely inaccurate estimation |
| p |
less accurate estimation |
| ( ) |
less accurate data |
| bn |
billion |
| CEFTA |
Central European Free Trade Agreement |
| CHP |
combined heat and power generation |
| DWT |
deadweight tonne |
| ECOICOP |
Classification of Individual Consumption according to Purpose |
| EU |
European Union |
| EUR |
euro |
| GDP |
gross domestic product |
| GT |
gross tonnage (gross registered tonnage) |
| GWh |
gigawatt hour |
| ha |
hectare |
| km |
kilometre |
| km2 |
square kilometre |
| kW |
kilowatt |
m2 |
square metre |
| m3 |
cubic metre |
| MIGs 2009 |
Main Industrial Groupings 2009 |
| mln |
million |
| NIP |
Nomenclature of Industrial Products |
| NKD 2007 |
National Classification of Activities, 2007 version |
| NN |
Narodne novine, official gazette of the Republic of Croatia |
| NPISH |
non-profit institutions serving households |
| PIN (OIB) |
personal identification number |
| t |
tonne |
| '000 |
thousand |
| VAT |
value added tax |
Published by the Croatian Bureau of Statistics, Zagreb, Ilica 3, P. O. B. 80
Phone: (+385 1) 48 06 111
Web site: dzs.gov.hr
Press corner: press@dzs.hr
Persons responsible:
Andrea Galić Nagyszombaty, Director of Statistical Methodologies, Quality and Customer Relations Directorate
Mario Vlajčević, Director of Demographic and Social Statistics Directorate
Suzana Šamec, Director of Macroeconomic Statistics Directorate
Edita Omerzo, Director of Spatial Statistics Directorate
Milenka Primorac Čačić, Director of Business Statistics Directorate
Lidija Brković, Director General
Prepared by: Kristijan Jurić, Maja Marković and Ana Samaržija
Editor: Ljiljana Ostroški
Technical Editor: Ankica Bajzek Cesar
Language Editor: Maja Gregorić
Translator: Neda Batinić
Graphic Design: Sanja Huseinagić and Nino Mrša
ISSN 3044-1692
USERS ARE KINDLY REQUESTED TO STATE THE SOURCE WHEN USING THE DATA
Regular collection and monitoring of data from the field of transport statistics facilitate decision-making based on reliable information and regarding the development of transport policies and investments in infrastructure. The importance of these statistical indicators is reflected in the fact that they give insight into the efficiency of transport networks that serve as a basis for population mobility and international trade, and their regular monitoring and analysis are crucial for the optimisation of expenses in logistics.
In 2023, Croatian carriers transported 84 million passengers. The most passengers were transported by coaches in the road line transport (50.6%) and by railway (28.3%). The Croatian shippers in seawater and coastal transport carried 17.8%, while air carriers transported 3.3% of all passengers.
From the 130 million tonnes of goods transported in 2023, the most was transported by freight vehicles with Croatian plates (67.7%) and by railway carriers (11.6%).
The total length of public-ranked roads in 2023 amounted to 26 495 km. According to the type of road, the largest part of the road infrastructure is made of county roads (35.4%), followed by local roads (32.1%), state roads (27.4%) and motorways (5.1%).

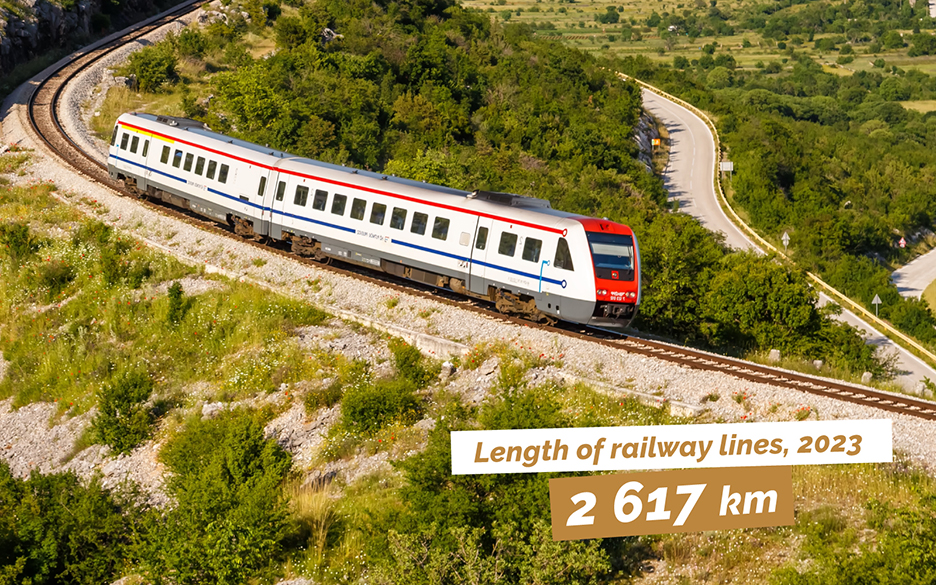
In 2023, 38.7% of the total length of railway lines was electrified.

In 2023, the length of gas and oil pipelines remained the same as in 2022. By using the existing infrastructure, 9,0% more oil was transported in 2023 compared to 2022, and most of the oil, more than three-fourths, was transported in transit through the Republic of Croatia. Gas transport recorded a decrease of 1.8%, compared to 2022, and most of the gas was transported within the Republic of Croatia.


The waterway fleet of Croatian shippers in 2023 had 92 passenger ships and 36 cargo ships available.
The capacity of the passenger ships in 2023 amounted to more than 36.5 thousand passenger seats or an average of 398 passenger seats per ship.
Croatian airway carriers had 34 aircrafts available in 2023, with a total of 3 852 available passenger seats or an average of 113 passenger seats per aircraft. An average of 1 141 working flights were made per year, or three flights per day per aircraft.
← Previous Next →
 Hrvatski
Download data


